CJ Freshway Stock: A 2.92% Margin the Whole Industry Shares
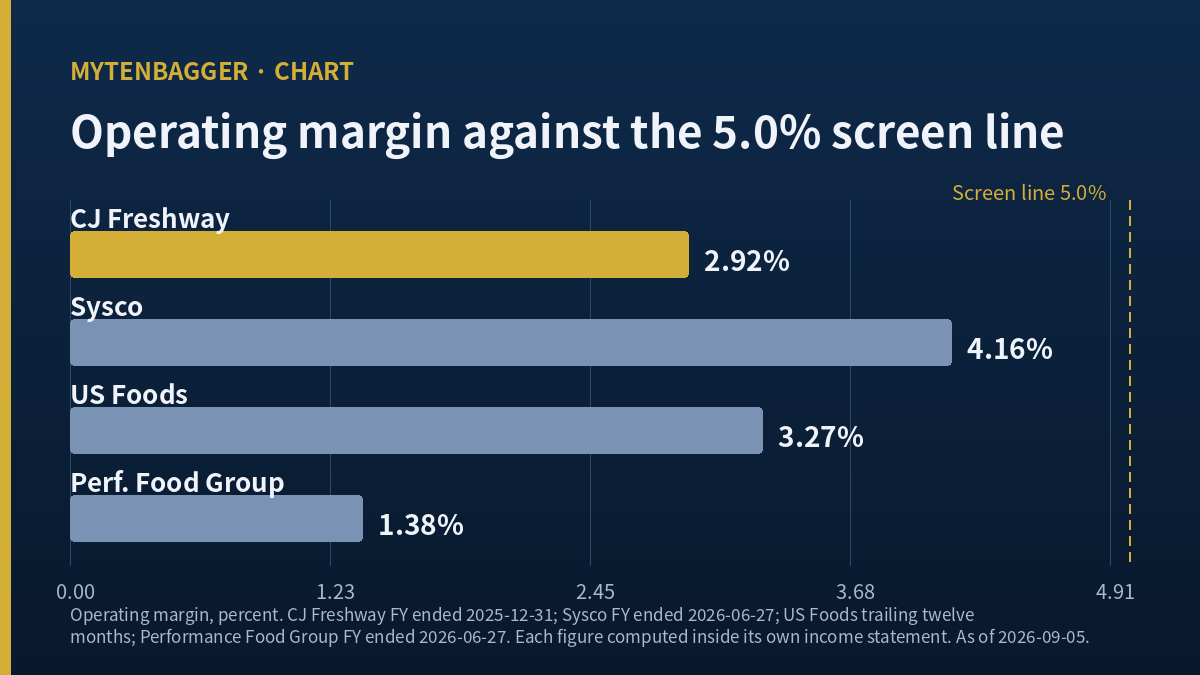
Five point zero percent. That is where a seven-item screen I keep draws its operating margin line, and CJ Freshway stock clears six of the seven items and fails only that one. The company earns 2.92 percent. On the screen’s own arithmetic it scores 86 and gets rejected anyway, because the rejection is binary and the miss is 2.08 percentage points wide.
So I went and checked what the three largest listed foodservice distributors in the United States earn on the same line. Sysco earns 4.16 percent. US Foods earns 3.27 percent. Performance Food Group earns 1.38 percent. Not one of them clears 5.0 percent either. The line is not measuring this company. It is measuring the business of buying food in bulk and delivering it to kitchens, which nobody anywhere does at a 5 percent operating margin. I do not own this company and I placed no order this week, and I stopped using that screen line as a reason.
The number that failed. Operating margin of 2.92 percent for the fiscal year ended December 31, 2025, against a 5.0 percent screen threshold. Six of seven items passed.
The number that reframed it. Sysco 4.16 percent, US Foods 3.27 percent, Performance Food Group 1.38 percent. All three under the threshold, and one of them under this company.
Where I landed. No position, no order, watching. The margin line stopped being my reason, so I had to find a different one, and the one I found has to do with timing instead of quality.
Contents
CJ Freshway Stock Fails a Screen on Exactly One Line
What the company is, and what KOSDAQ means
CJ Freshway (051500) is a Korean food distributor and contract caterer. It buys food ingredients in volume and sells them to restaurants, franchise chains, hospitals, schools and factory canteens, and it also runs institutional food service directly. It is listed on KOSDAQ, which is the smaller of Korea’s two main boards. KOSPI carries the large industrial and financial names that overseas investors usually know from index products; KOSDAQ carries mid and small caps and trades on the same exchange under separate listing standards. Neither board offers a US listing for this company, a point I come back to near the end.
The closing price on Friday, September 4, 2026 was KRW 23,700, or roughly USD 17.55 at that day’s rate. With 11,873,418 shares outstanding that puts market value at KRW 281.40bn, about USD 208.4M by my calculation. Trailing revenue for the fiscal year ended December 31, 2025 was KRW 3,481.08bn, about USD 2.58bn. The company is worth roughly eight percent of one year of what passes through it.
The seven items and the one that failed
The screen checks revenue scale, operating margin, earnings per share, return on equity, price to earnings, price to book and whether operating profit is positive. Six pass comfortably. Revenue is far above the scale minimum. Earnings per share is KRW 4,221 and positive. Return on equity is 11.5 percent against a 10.0 percent floor. Price to earnings is 5.62 against a 15.0 upper bound. Price to book is 0.62 against a 1.5 upper bound. Operating profit is KRW 101.65bn and positive.
Operating margin is 2.92 percent against a 5.0 percent floor. That is the whole failure. I have looked at a good number of Korean names this year and I cannot remember another one that lined up this cleanly on six items and then stopped dead on the seventh.
Why one line can carry that much weight
A screen threshold is a claim about what a healthy business looks like. When a company misses one, the useful question is whether the company is unusual or whether the threshold is. I could only answer that by leaving the company and going to look at the trade it operates in, which is what the next section does. Until I did that, I had been treating 2.92 percent as information about management. It turned out to be information about the industry.
The Line Is 5.0 Percent and the Global Trade Sits Under It
Sysco, the largest of them, earns 4.16 percent
Sysco (NYSE: SYY) reported USD 84,553M of revenue for the fiscal year ended June 27, 2026, with USD 3,517M of operating income and USD 1,757M of net income. That is a 4.16 percent operating margin on revenue 32.80 times this Korean company’s, by my calculation. Sysco is the reference case for broadline foodservice distribution worldwide, it has been at this for decades, and it is 0.84 percentage points short of the threshold that rejected CJ Freshway (Sysco financials).
US Foods earns 3.27 percent on a trailing basis
US Foods (NYSE: USFD) posted USD 39,424M of revenue and USD 1,248M of operating income for the fiscal year ended December 27, 2025, a 3.17 percent margin, and its trailing twelve month figures come to USD 40,133M of revenue at a 3.27 percent margin. Both figures are under 5.0 percent (US Foods financials).
Performance Food Group earns 1.38 percent, which is below the Korean company
Performance Food Group (NYSE: PFGC) reported USD 64,340M of revenue for the fiscal year ended June 27, 2026 with USD 887.5M of operating income and USD 359.3M of net income. That works out to 1.38 percent. It is the third largest of the three by revenue and the thinnest by margin, and it earns 1.54 percentage points less per dollar of revenue than the company my screen threw out (Performance Food Group financials).
What that arrangement tells me
Four companies, four different countries of listing or none, four different fiscal year ends, and every one of them under the line. When a threshold excludes every large participant in a trade, it has stopped being a filter and become a category exclusion. That is a legitimate thing for a screen to do if I built it to avoid low margin distribution entirely. It is not legitimate as a verdict on one company inside that trade, which is how I had been using it.
CJ Freshway Stock Against Three Listed Distributors
| Company | Market value | Revenue | Value per unit of revenue | Operating margin |
|---|---|---|---|---|
| CJ Freshway (KOSDAQ: 051500) | KRW 281.40bn (~USD 208.4M) | KRW 3,481.08bn (~USD 2.58bn) | 0.081 | 2.92% |
| Sysco (NYSE: SYY) | USD 38.69B | USD 84,553M | 0.458 | 4.16% |
| US Foods (NYSE: USFD) | USD 22.59B | USD 40,133M (TTM) | 0.563 | 3.27% |
| Performance Food Group (NYSE: PFGC) | USD 15.54B | USD 64,340M | 0.242 | 1.38% |
Five places this table is loose, and I would rather write them than hide them
First, the fiscal periods do not line up. Sysco and Performance Food Group closed on June 27, 2026, US Foods closed on December 27, 2025 with a separate trailing figure, and the Korean company closed on December 31, 2025. Second, the closing prices behind the three US market values are from Friday, September 4, 2026 for Sysco and Performance Food Group but Thursday, September 3, 2026 for US Foods, so one row is a day stale. Third, all four market values are equity only and carry no net debt adjustment, which matters here because the Korean company carried a 249.12 percent debt to equity ratio at its fiscal year end. Fourth, every Korean figure passes through one exchange rate on one date. Fifth, and largest, CJ Freshway also operates contract catering directly while the three American companies are distributors, so the business mixes are not identical.
What survives all five caveats
The margin column survives. Whatever I do to the fiscal periods, the debt treatment or the exchange rate, none of it moves an operating margin, because an operating margin is a ratio inside one company’s own income statement in its own currency. Four figures, computed independently in two currencies, all land under 5.0 percent. That is the only claim in the table I would defend without a caveat attached.
A Korean peer I looked at and left out
Korean press coverage from August 2026 reports that Daesang, another Korean food company, closed its own online ingredient marketplace at noon on Monday, August 31, 2026, weeks before this company closes its own. I read that as evidence about the channel and not about relative quality, so I did not build a Korean comparison row. I have no verified operating margin for Daesang’s distribution arm on its own, and a segment margin I cannot source is worse than no row at all.
The peer test I could not run
None of the three American companies breaks out a school and hospital catering segment the way this company would need for a clean match, and I did not open their filings to check whether such a segment exists under another name. So the table compares whole companies. I want that on the record before anyone leans on it.
What the June Quarter Actually Did
Revenue up, operating profit down, in the same three months
Korean quarterly filings report flow items cumulatively, so I subtracted the first quarter from the half year to get the June quarter on its own. Revenue came to KRW 923.16bn against KRW 883.32bn a year earlier, up 4.51 percent by my calculation. Operating profit came to KRW 23.53bn against KRW 27.44bn, down 14.23 percent. Korean press reporting on Thursday, August 6, 2026 carried the same two figures to the nearest ten billion won, which told me my subtraction held (Herald Business, Newspim).
Where the profit went, according to Korean sell-side
A Korean brokerage, IBK Investment Securities, moved its valuation on the company from KRW 48,000 to KRW 46,000 on Monday, July 13, 2026 while keeping a buy stance, and put the earnings decline down to spending aimed at expanding the online unit’s share. The same note put second quarter operating profit at KRW 23.5bn, which is what the company went on to report. A second Korean brokerage published its own second quarter preview a week later. I read this coverage through Korean secondary reporting and not in the original documents, so I carry the amount and the stated reason and nothing further (Hankyung, via Korean report coverage).
The spending has an end date, which is unusual
The company will shut its own online ingredient marketplace, Fresh&, at 2pm on Tuesday, September 29, 2026, according to Korean press. After that its business to business online route consolidates onto Sikbom, an open marketplace operated by Marketboro, in which this company took a 27.5 percent stake in February 2026 to become the largest shareholder (SEN TV, Business Post). I have sat through a lot of temporary investment phases in my own holdings and almost none of them came with a published closing time. This one does.
CJ Freshway Stock Costs Less Per Unit of Revenue Than Any of Them
The four ratios, and how far apart they are
Dividing market value by revenue gives 0.081 for the Korean company, 0.458 for Sysco, 0.563 for US Foods and 0.242 for Performance Food Group. The widest gap runs to US Foods at 6.96 times, by my calculation, and even the narrowest, against Performance Food Group, is 2.99 times. Sysco carries 32.80 times the revenue and 185.67 times the market value.
Three explanations I can think of, and what I can prove
The gap could be a currency and country discount that applies to Korean small caps generally. It could be the debt, since equity market value ignores what sits ahead of it and this company runs far more leverage than the American three. It could be that the market prices Korean contract catering and food distribution earnings as less durable than American distribution earnings. I can prove none of the three. I can only say that the ratio gap is large enough that it will not be closed by an accounting quibble.
Why I am not calling it cheap
A low ratio says something about price and revenue and says nothing at all about what the revenue converts into. On a 2.92 percent operating margin, one unit of revenue is not worth what a unit of revenue is worth at a software company or a branded manufacturer, and the market is entitled to price it accordingly. I have watched low ratios stay low for years while I told myself the market was about to catch up. That memory is doing more work in this paragraph than the arithmetic is.
What I Checked and Left Out of the Argument
Half year operating cash flow
Cumulative operating cash flow for the six months to June 30, 2026 was negative KRW 36.33bn and free cash flow was negative KRW 57.50bn. I left both out of the argument, because this company has run negative first half cash and strongly positive fourth quarter cash for several years running. Standalone fourth quarter operating cash flow was KRW 99.74bn in 2024 and KRW 99.04bn in 2025, both of which I computed from annual figures less nine month cumulative. Treating a seasonal working capital pattern as a warning signal would have me issuing the same warning every June.
A negative line inside consolidated equity
Non-controlling interests sat at zero through December 31, 2025 and then appear as negative KRW 71.03bn at March 31, 2026 and negative KRW 49.99bn at June 30, 2026. The identity closes: owners’ equity of KRW 432.65bn less KRW 49.99bn gives the KRW 382.66bn consolidated total, within one million won of rounding. I could not open the notes to find out what transaction produced it, and the timing overlaps with the February stake purchase without that overlap proving anything. So I recorded it and left it out.
Two data fields I could not reconcile
The indicator screen reports a free float of 11,872,000 shares, which is 99.988 percent of shares outstanding, while a Korean company information page dated Thursday, September 3, 2026 shows CJ and six related parties holding 47.96 percent. Those two cannot both be right, so I used neither. The same screen carries a dividend payout ratio of 11.8 and a raw payout field of 52.0, a gap of 4.41 times; the first reverses cleanly out of KRW 500 per share on 11,873,418 shares against KRW 50.11bn of net income, and the second does not reverse out of anything I could construct (WiseReport).
CJ Freshway Stock: Eight Places I Could Be Wrong
Group A, where the comparison itself gives way.
- Contract catering may carry a structurally different margin from pure distribution, in which case putting this company beside three pure distributors flatters or punishes it in a direction I cannot size.
- American distributors operate at national scale with private label lines that a Korean mid cap cannot match, so their margins may be an upper limit this company was never going to approach anyway.
- The revenue ratios ignore net debt entirely. On an enterprise basis the gap between this company and the American three would narrow, and I did not compute by how much.
- A 5.0 percent threshold might be defensible precisely because it screens out low margin distribution as a category, in which case my whole reframing is an argument for keeping the line, and I would be the one misreading it.
Group B, where my reading of the company gives way.
- Six Korean brokerages carry a consensus valuation of KRW 43,500 as of Thursday, September 3, 2026, which is 1.835 times the September 4 close. The weight of covering opinion is against my waiting.
- IBK called the cost temporary and stayed at buy. If that reading is right, the June quarter was the low point and waiting past September 29 costs me the recovery.
- June quarter operating margin of 2.55 percent is already above the March quarter’s 1.32 percent, so within the first half the direction has turned up once.
- Operating income is not defined identically across the two accounting regimes. Korean filings can carry other operating income inside the operating profit line where a US filer would report it below that line, and I did not reconcile the two definitions item by item. The four margins in my table may not be measuring quite the same thing, which is the most load-bearing assumption in this piece and the one I am least able to defend.

My Position on CJ Freshway Stock and What Would End It
I hold none of this company and I placed no order. Market value of KRW 281.40bn puts it outside the top hundred Korean listings, which sets my default at watching. What the peer work changed is the reason. I came in ready to reject the company on a margin line and I leave holding a company that earns a normal margin for its trade, sits at a fraction of its peers’ revenue ratio, and has one identifiable cost with a published end date. That is a different kind of no.
Two things would tell me I read it wrong. The first: if the third quarter report due around Monday, November 16, 2026 shows a nine month operating margin at or above 2.78 percent, which is what the first nine months of 2025 delivered, then the compression I built this on was already over before I wrote. The first half of 2026 ran 1.97 percent, so that recovery has to come almost entirely out of one quarter, and I checked that it has never done so in the four years my data reaches.
The second, and this is the one I want written down properly: if the marketplace closes on the announced date and the full year 2026 operating margin comes back to 2.92 percent or better, the line that failed this company on my screen will have stopped moving down, and I will not have owned it while that happened. When I record that outcome I have to write two sentences and not one. The first is that my reading was wrong. The second is that being wrong in that direction was good news for the company and a cost to me, and those are not the same fact. A page that only ever records the first sentence will read, years later, like a page that was right.
For related reading, I have written before about the year a group affiliate’s earnings ratio cell stayed blank and about a Korean food company that publishes revenue by market and profit by nothing. Both are about what a disclosure will not tell you. This one is about a threshold that told me something true about an industry while I was reading it as something about a company.
Prices and ratios reflect the Friday, September 4, 2026 close as checked at the time of writing. Korean won is the reference currency throughout and USD conversions are approximate, at roughly KRW 1,350.4 per dollar on that date, per Korean market reporting. Korean financial figures are consolidated and taken from regulatory filings, with quarterly standalone amounts computed by me from cumulative disclosures. US peer figures are as displayed by stockanalysis.com on September 4, 2026, except US Foods, whose price reflects September 3, 2026.