Nongshim Stock: Seven Revenue Lines, Not One Profit Line
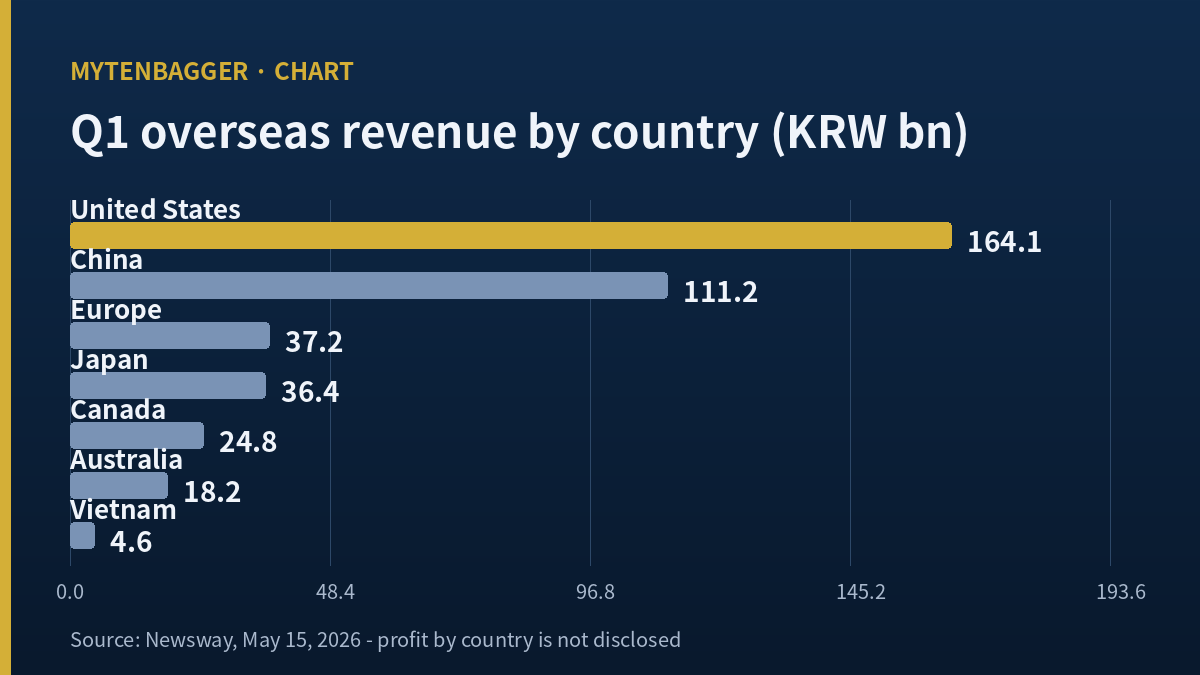
United States ₩164.1bn. China ₩111.2bn. Europe ₩37.2bn. Japan ₩36.4bn. Canada ₩24.8bn. Australia ₩18.2bn. Vietnam ₩4.6bn. That is Nongshim’s overseas revenue for the first quarter of 2026, broken out country by country, as reported by Korean business press on May 15, 2026. Seven markets, seven numbers, each one specific enough to build a thesis on. What I could not find anywhere, and what sent me back through the filings, is the second column. Nongshim stock is covered by analysts who write about margin improvement in China and North America, and the company publishes no profit figure for China or North America at all.
The two rows that carry this piece
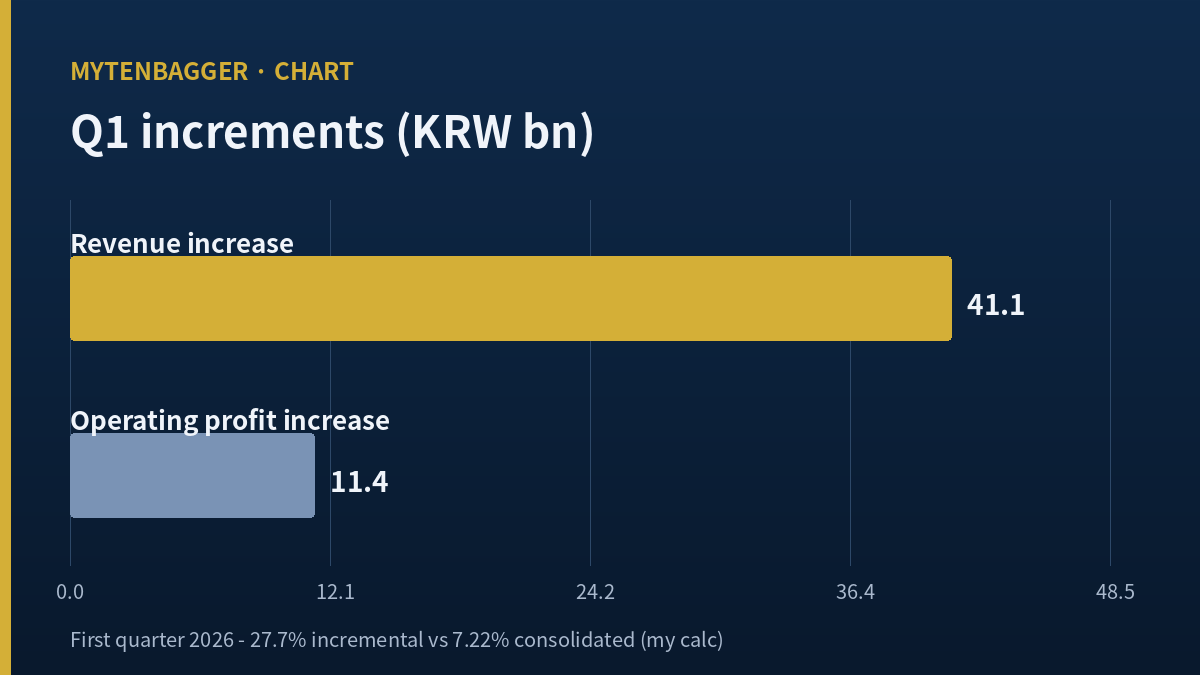
Revenue, Q1 2026 versus Q1 2025: +₩41.1bn (₩934.0bn against ₩893.0bn, the prior-year figure recovered from the reported +4.6%)
Operating profit, same comparison: +₩11.4bn (₩67.4bn against ₩56.0bn, recovered from the reported +20.3%)
Divide the second row by the first and ₩11.4bn on ₩41.1bn is a 27.7% incremental operating margin (my calculation), against a 7.22% consolidated operating margin in the same quarter. New revenue arrived carrying roughly four times the profitability of the base business, which is more than volume leverage usually explains.
Contents
What the first-quarter arithmetic says about Nongshim stock
Start with the reported figures. For the quarter ended March 2026, Nongshim posted consolidated revenue of ₩934.0bn, operating profit of ₩67.4bn and net profit of ₩60.7bn, up 4.6%, 20.3% and 16.3% respectively against the same quarter of 2025 (Herald Business, May 15, 2026). The domestic entity’s revenue fell 2.8% to ₩718.5bn. Overseas entities grew 23.1%.
Left as four growth rates, that set produces a tidy summary: weak at home, strong abroad, therefore better earnings. I wanted to know whether the middle clause carries the third one, so I reversed the growth rates into prior-year levels. Revenue of ₩934.0bn divided by 1.046 gives ₩893.0bn. Operating profit of ₩67.4bn divided by 1.203 gives ₩56.0bn. Both are my calculations from the reported percentages. The deltas are ₩41.1bn of revenue and ₩11.4bn of operating profit.
One division follows. ₩11.4bn over ₩41.1bn is 27.7%. The same quarter’s consolidated operating margin, ₩67.4bn over ₩934.0bn, is 7.22%. Every hundred won of new revenue delivered nearly twenty-eight won of operating profit, in a business that converts about seven won on average.
An incremental margin above the average is ordinary in packaged food. Fixed costs are already carried, so extra volume meets variable cost only. A gap approaching four times is where the volume explanation starts to thin out. The sell-side commentary I found on the quarter reached for pricing and cost lines rather than volume: Korea Investment & Securities analyst Kang Eun-ji attributed the improvement to price increases at the domestic and North American entities, demand recovery, and reduced promotional spending (CNews, summarising a December 30, 2025 report). Higher prices and thinner promotions raise what each unit of revenue leaves behind. Neither one means the company sold more noodles overseas.
So I take “overseas carried the quarter” as a statement about the top line. Where the profit improvement came from is a separate question, and one I cannot settle with what the company publishes.
The same shape, one quarter earlier
Before leaning on a single quarter I went looking for the pattern elsewhere, and found it in the September 2025 quarter. Nongshim reported revenue of ₩871.2bn, up 2.4%, and operating profit of ₩54.4bn, up 44.7%, with domestic revenue down 2% (Korean consumer press, November 17, 2025). Run the same reversal: prior-year revenue of ₩850.8bn and operating profit of ₩37.6bn, giving deltas of ₩20.4bn and ₩16.8bn. That is an 82.3% incremental operating margin (my calculation), against a 6.24% group margin for that quarter.
Two quarters, incremental margins of 82.3% and 27.7%, group margins of 6.24% and 7.22%. Whatever is driving the earnings recovery is arriving with far more profit attached per won of revenue than the base business produces, and it is doing so in quarters when the domestic top line is shrinking. Pricing and cost discipline fit that shape. Overseas volume growth, on its own, does not. This is the point in the work where I stopped treating the geographic revenue table as the explanation and started treating it as a description of something else.
One caution on the pair. The two quarters are not directly comparable in size or seasonality, and an 82.3% incremental margin on a small revenue delta is arithmetically fragile: a modest revision to either input moves it a lot. I am using the two figures as evidence of direction, not as a measured trend line.
A ratio I decided not to build
I tried to compute an overseas revenue share and stopped. Add the seven country lines and you get ₩396.5bn. Add the domestic entity’s ₩718.5bn and the total is ₩1,115.0bn. Consolidated revenue for the same quarter is ₩934.0bn. The entity-level sum exceeds the consolidated figure by ₩181.0bn (my calculation), which is presumably intercompany volume: product shipped from the Korean entity to the overseas ones and eliminated on consolidation.
That leaves the overseas share at 42.5% if the denominator is consolidated revenue, or 35.6% if it is the entity-level sum (both my calculations). I could not establish which denominator the company and the press are using, and a ratio whose denominator I cannot pin down is not a ratio I will publish. For the same reason I did not build a quarterly series: a November 17, 2025 report on the third quarter of 2025 cited overseas entity revenue of ₩266.1bn (Korean consumer press, November 17, 2025), a figure too far below ₩396.5bn to sit on the same line without an explanation I do not have.
Nongshim stock on the numbers, at the August 4, 2026 close
Nongshim trades on the KOSPI, the main board of the Korea Exchange, under code 004370. The KOSPI is Korea’s senior market, the venue for its largest industrial and consumer names, and it is distinct from the KOSDAQ, where smaller and earlier-stage companies list. Below are the figures I used, from Kiwoom Securities data.
| Metric | Value | Note |
|---|---|---|
| Close | ₩376,500 (about $263) | August 4, 2026 (Tue) |
| Market capitalisation | ₩2.290tn (about $1.60bn) | 6,082,603 shares × close, reconciles exactly |
| P/E · P/B | 13.46x · 0.79x | Trailing, Kiwoom basis |
| Return on equity | 6.2% | Only failing item on my seven-metric screen |
| FY2025 revenue · operating profit | ₩3.514tn · ₩183.9bn | Operating margin 5.23% |
| FY2025 net profit | ₩170.1bn | Net margin 4.84% |
| Dividend per share | ₩6,000 | Yield 1.59%, payout 21.5% |
| Debt to equity · interest cover | 36.97% · 9.83x | Balance sheet is not the issue here |
| Foreign ownership | 23.32% | Margin loan balance 0.36% |
| 250-day high · low | ₩579,000 · ₩319,000 | Intraday. Close sits −34.97% and +18.03% from them (my calculations) |
| Price performance | 1M +6.21% · 3M −0.13% · 12M −6.58% | 120-day average ₩379,519, close −0.80% below |
Prices and multiples reflect the August 4, 2026 close as checked at the time of writing. Dollar equivalents are approximate, at roughly ₩1,430 per dollar on that date; the Korean won is the reference currency throughout and the dollar figures are a convenience only.
One line in that table is not usable in the direction it appears to run. The earnings per share the vendor shows, ₩27,970, is derived by dividing the price by the P/E rather than the reverse, so rebuilding the multiple from it would be circular reasoning dressed as a cross-check. I confirmed the price basis another way instead: ₩376,500 over book value per share of ₩476,371 gives 0.79, matching the published P/B exactly, which tells me the book figure is stated against the same close and that the two valuation lines are internally consistent.
Something occurred to me while assembling that table. For years I have treated “overseas revenue share” as a single line worth screening on, and I have never once checked what sits in its denominator. This is the quarter where I went looking and found two candidates. I have not gone back to count how many companies I waved through on the strength of that line.
Nongshim stock against Samyang Foods, Toyo Suisan and Nissin
With no geographic profit split, the only profitability evidence available is at the group level. So I put three comparable companies beside it. The first is domestic, drawn from the same data vendor on the same date, which makes it the cleanest of the three.
| At the August 4, 2026 close | Nongshim | Samyang Foods |
|---|---|---|
| Revenue | ₩3.514tn | ₩2.352tn |
| Operating profit | ₩183.9bn | ₩524.2bn |
| Operating margin | 5.23% | 22.29% |
| Return on equity | 6.2% | 37.6% |
| Market capitalisation | ₩2.290tn | ₩9.183tn |
| P/E · P/B | 13.46x · 0.79x | 23.58x · 7.31x |
Rank the two by revenue and Nongshim leads by 1.49 times. Rank them by operating profit and Samyang Foods leads by 2.85 times. Market capitalisation follows the second ranking, not the first: Samyang Foods carries 4.01 times the market value (all three my calculations). The company that sells more noodles and the company that earns more from noodles are different companies, and the market priced the second one.
Where the Japanese incumbents sit
A domestic comparison alone cannot separate an industry margin from a company margin, so I looked at two Tokyo-listed makers. Toyo Suisan, whose Maruchan brand leads the American instant noodle aisle, closed at ¥10,535 on July 3, 2026 at 15:30 JST, with a market capitalisation near ¥1.03tn, a P/E of 14.77x and a 2.09% dividend yield. Revenue of ¥536.6bn and net profit of ¥70.2bn work out to a 13.08% net margin (my calculation). Nissin Foods Holdings closed at ¥2,893.50 on July 24, 2026 at 15:30 JST, market capitalisation near ¥830.8bn, forward P/E 17.11x, dividend yield 2.44%, revenue ¥788.1bn and net profit ¥45.4bn for a 5.76% net margin (my calculation). All of these come from stockanalysis.com and each row carries its own timestamp.
I left one cell out. The trailing P/E shown for Nissin, 183.91x, disagrees by a factor of ten with the 18.3x implied by market capitalisation over net profit on the same page (my calculation). One of the two has not been adjusted for a share split, and I could not determine which, so I dropped the trailing figure and carried only the forward multiple.
Why Toyo Suisan is the uncomfortable comparison
Toyo Suisan earns a low-teens net margin. That settles one question: nothing about instant noodles forces a mid-single-digit margin. And the market where Toyo Suisan earns that margin is the United States, which is precisely where Nongshim booked ₩164.1bn in the first quarter. In the same aisle, one company reports double-digit profitability at the group level and the other does not report what it earns there at all.
The 2030 plan, measured against the current run rate
None of this is news to management. In a disclosure dated May 29, 2025, Nongshim published a medium-term plan targeting revenue of ₩7.3tn by 2030, a 10% operating margin and a 61% overseas revenue share, against a 2024 base of ₩3.439tn, 4.7% and 37% (Economic Review, May 29, 2025). Getting from FY2025 revenue of ₩3.514tn to ₩7.3tn across five years requires 15.7% compound annual revenue growth (my calculation). FY2025 growth was 2.2%. Korean companies that scale offshore also tend to carry the cost of it somewhere the headline does not reach, which is the thing I keep looking for now after Krafton’s four-million-copy hit turned into a nine-figure earnout obligation. For Nongshim that cost is a plant, and the plant is the part of the plan I can actually watch. One further check: reversing the vendor’s FY2024 operating profit gives ₩163.0bn on ₩3.439tn, a 4.74% margin that matches the 4.7% in the company’s own disclosure, which is how I satisfied myself the FY2025 figures in my table are on the same footing.
The case against: why the June quarter may land lower
Four reasons to be less enthusiastic than I might otherwise be.
First, the second-quarter estimates sit below the first quarter on margin. A July 29, 2026 Korean report put Yuanta Securities at ₩936.7bn of revenue and ₩57.7bn of operating profit, and Kyobo Securities at ₩930.0bn and ₩52.3bn (Opinion News, July 29, 2026). Those imply operating margins of 6.16% and 5.62% (my calculations), down from 7.22%. Two houses, same direction.
The comparison cuts both ways, and I want to state the other side of it properly. Yuanta’s ₩57.7bn is framed as 43.8% growth, which puts the year-ago quarter at ₩40.1bn on ₩868.1bn of revenue, a 4.62% margin (my calculations). Measured against that base, even Kyobo’s more conservative ₩52.3bn is a full percentage point of margin improvement year on year. So the June quarter is expected to be weaker than March and much stronger than the previous June at the same time. Both readings are true, and which one a headline picks will decide how the print is received.
My own reason for caring about the sequential number rather than the annual one is narrow: the annual comparison tells me the recovery is real, which I already accept. The sequential comparison is the one that tests whether the first quarter’s unusually profitable increment repeats.
Second, the cost warning is specific. In the same report, Hana Securities flagged that rising input prices for packaging materials would slow domestic profitability, with packaging and palm oil named as second-half pressures. If my reading of the first quarter is right and much of the profit gain came from cost and price lines, then those same lines can give it back.
Third, the domestic trend points one way. Domestic revenue fell 2.8% in the first quarter of 2026 and 2% in the third quarter of 2025. I did not find a recent quarter where it grew. While the home market remains the larger block, a high overseas growth rate still leaves group growth in the low single digits, which is exactly what FY2025 delivered at 2.2%.
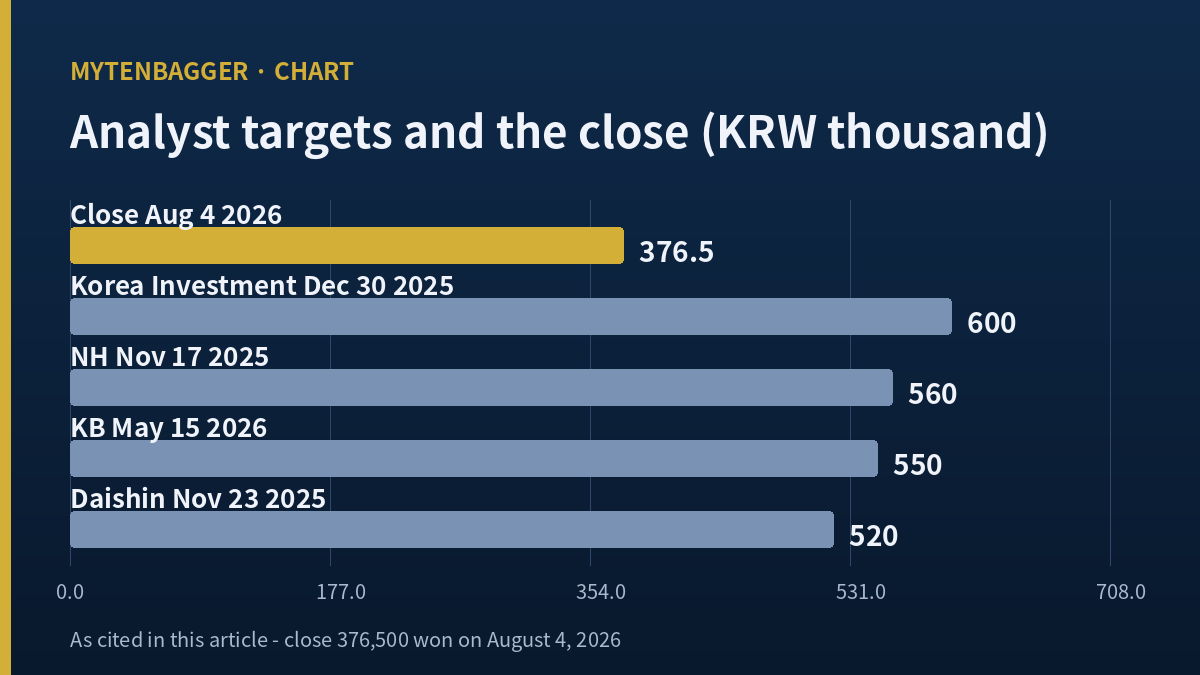
Fourth, most of the published valuations are stale. I found Korea Investment & Securities at ₩600,000 dated December 30, 2025, NH Investment & Securities at ₩560,000 dated November 17, 2025, KB Securities at ₩550,000 dated May 15, 2026, and Daishin Securities at ₩520,000 dated November 23, 2025. KB’s is the most recent and was published on the day of the first-quarter release, so no house in that list has responded to two subsequent quarters of information. Against the ₩376,500 close those sit +59.4%, +48.7%, +46.1% and +38.1% higher (all my calculations), and a meaningful share of that distance may simply be the passage of time.
Nongshim stock: my position and the line that breaks it
I do not own this and I am not buying it here. What is different this time is the reason.
Usually when I write that I am standing aside, it is because something is expensive or the numbers are poor. Neither applies. On my seven-metric screen this name passes six of seven for a score of 86, and the one failure is return on equity at 6.2%. A 13.46x P/E sits inside my 15x line and a 0.79x P/B is below book. Debt to equity of 36.97% with 9.83x interest cover is comfortable. Run a screen and this company survives it. I have bought large caps below book before and written up why, most recently when I took the tariff selloff in Kia, and I still think that reasoning held.
The difference is what was visible in that case. Kia’s earnings power could be traced by region. Nongshim’s revenue can be traced by region while its profit is available only as one consolidated figure. That means I have no way to test the bull case. When an analyst writes that margins are improving in China and North America, there is no published number that can confirm or contradict the sentence. I am not passing because the price is high or because the results are weak. I am passing because I cannot check. That is the whole of my position.
A neighbour on the same shelf stops one rung further along. Lotte Wellfood publishes the line this company withholds: ₩29.6bn of overseas operating profit for the second quarter of 2026 against ₩64.7bn consolidated, which puts on the record that a quarter of its sales made 45.75% of its profit. Country level profit is missing there too. But the sentence about overseas carrying the earnings can at least be tested against a published number, and that is the test I do not get here.
I know results and share prices can stay apart for a long stretch. Watching LG Electronics sit 56% below its high while printing record earnings was where I wrote that lag down. The difference is what I was waiting on. There I was waiting for recognition. Here I am waiting on disclosure granularity, which is a different thing to wait for and may never arrive.
What breaks my position. Two consecutive quarters of consolidated operating margin above 7% and I concede that the earnings mix is changing whether or not the geography is ever published. The first quarter’s 7.22% is quarter one. If the June quarter lands at Yuanta’s 6.16% or Kyobo’s 5.62%, the first quarter starts to look seasonal or one-off. If it clears 7% again, my “cannot check” stance loses its footing. Both estimates currently point the other way, which makes this a test set against me rather than for me, and that is how it should be.
Two things that would make me reopen the file. One is the second-quarter 2026 disclosure, which delivers the first verdict above. The other is the start-up of the Busan Noksan export-only plant. At groundbreaking the company described it as a dedicated export base with capacity for 500 million packs of ramyun a year and gave a second-half 2026 completion date (Sisaweek); whether that schedule has since moved, I have not confirmed. Once an export-only line runs, the boundary between domestic entity revenue and overseas entity revenue shifts again, which means the denominator problem I described earlier gets larger rather than smaller.
Where the noodle profit is actually booked
One comparison belongs here because it is where the listed exposure sits. The company earning a low-teens net margin in the US noodle aisle is Toyo Suisan, in Tokyo, not the brand whose name is on the packet. Shin Ramyun sits in Costco, Walmart and most large US grocery chains, and none of that shelf presence turns into margin on this income statement. The two are not comparable in any respect other than the aisle they share.
Two mechanical notes. Korean dividends are withheld at source and paid in won, so the 1.59% yield in my table is a gross figure and what is actually received is smaller and moves with the payment-date exchange rate. And Korean quarterly results arrive roughly six weeks after quarter-end, so the second-quarter numbers discussed here were still unpublished when I wrote this.
On the dividend itself, since it is the one shareholder-return line with a clear history here. Nongshim paid ₩5,000 per share for the FY2022, FY2023 and FY2024 years and raised it to ₩6,000 for FY2025, a 20% increase after three flat years. At 6,082,603 shares that is ₩36.5bn of total dividend, which divided by FY2025 net profit of ₩170.1bn gives the 21.5% payout in my table, reconciling exactly. I mention the reconciliation because the same data screen also displays a 51.7% payout figure that I could not reproduce from any combination of the disclosed totals, so I did not use it. A 1.59% yield on a 21.5% payout is not an income case. What it is, at most, is evidence that the board considers the recovery durable enough to move a number it had left alone for three years.
Where that leaves the two companies I put in a table earlier: one sells ₩3.514tn of noodles and keeps ₩183.9bn, the other sells ₩2.352tn and keeps ₩524.2bn, and the market has already decided which arrangement it prefers. Nongshim’s path to closing that gap is written into a 2030 plan I can read and a set of geographic results I cannot. Until the second column exists, or until the group margin makes the second column unnecessary, I am reading this one and holding none of it.
Related reading
- Ottogi Stock: Three Months Without a Single Analyst Note
- LG Corp Stock: Revenue Flat Four Years, Profit Down by Half