Korea Ratings Stock Trades at 4.3 Times Sales, Moody’s 10.5
I have been reading Korean credit ratings for years without once looking at the company that writes them. That changed five weeks ago when I noticed the name in my own opening sentence about a chemical producer whose grade had just been cut, and realized the writer of that grade was itself listed on an exchange I follow. Korea Ratings stock closed at KRW 103,900 on Friday, September 4, 2026, and I spent this session trying to work out what a rating opinion is worth when the opinion itself is the product.
The comparison I could actually build turned out to be a price one. Two global firms in the same business published statistics screens dated the same day I took my Korean close, and the distance between them and this company is much larger on price than it is on profitability.
What I assumed on the way in
A ratings franchise protected by licensing should price close to its global peers.
What the same-day screens said
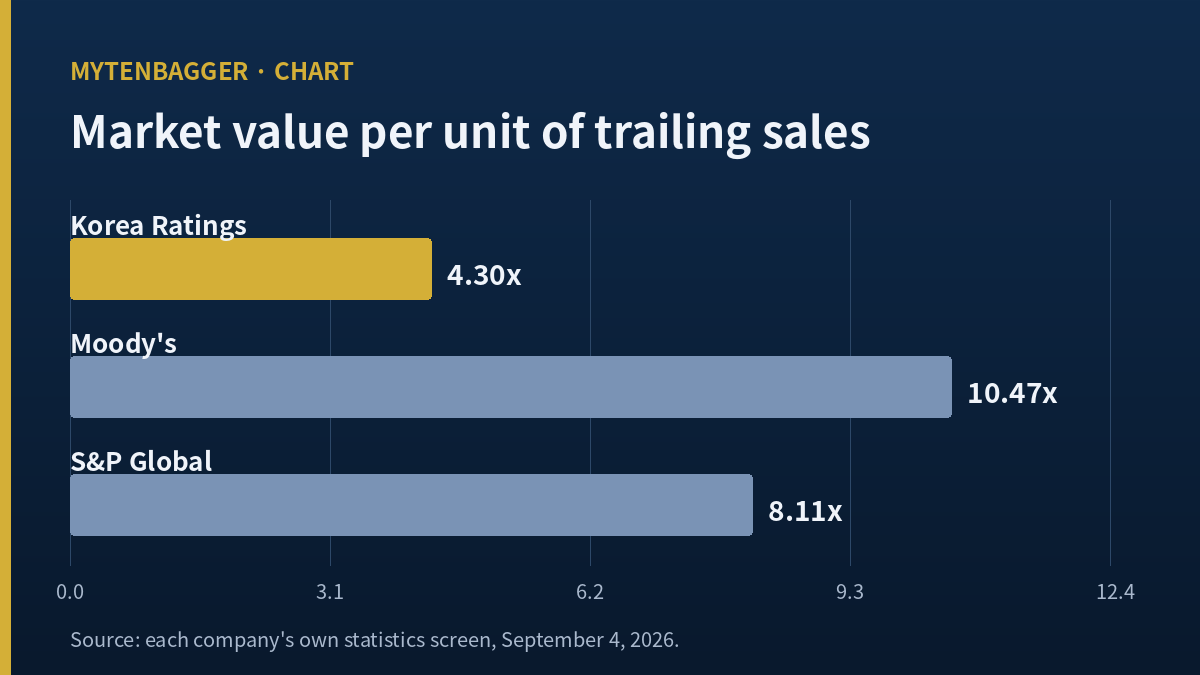
Market value per unit of sales: 4.30 here, 10.47 at Moody’s, 8.11 at S&P Global. Net margin: 26.76 percent here, 34.31 and 30.52 percent there.
What survives the gap
The price distance is 2.44x and 1.89x. The margin distance is 7.55 and 3.76 percentage points. Those two distances do not scale together, and I could not close the difference with anything I verified.
Stance No position, no order, watching. Priced off the September 4, 2026 close.
Contents
What Korea Ratings stock sells and who pays for it
Korea Ratings is one of three licensed credit rating agencies in South Korea and the only one of the three with a listing. It is quoted on KOSDAQ, the smaller of the two Korean boards, where mid-cap and growth names sit alongside the large-cap KOSPI board. Its market value is KRW 471.76 billion, which is about USD 349.3 million at 1,350.4 KRW per USD, the Seoul afternoon close reported for 2026-09-04.
The product is an opinion about whether a borrower can pay. The buyer of that opinion is the borrower. A Korean company that wants to sell bonds needs a grade, and to get a grade it commissions an assessment and pays a fee. I went in expecting that arrangement to make revenue a direct function of how much debt the country was issuing. It does not behave that way, and working out why took me to the fee schedule.
A regulator decides how many seats exist
In a plan dated September 21, 2016, the Financial Services Commission said it would not admit a fourth rating agency at that time, and would instead convene a market assessment committee to review entry conditions on a regular basis. The same plan introduced third-party commissioned ratings and an agency selection application scheme, both aimed at reducing how much influence issuers hold over the firms grading them. Three seats exist because a regulator decided they should, and the same document says the decision gets revisited.
A fee table anyone can open
The company publishes its fee schedule by product. For general corporate bond ratings the structure has three parts. A base fee set by the issuer’s total assets, running from 11 million to 33 million won. A proportional fee of one ten-thousandth of the face value of the bond, truncated below 10,000 won. And a ceiling of 60 million won per case.
The fourth line is the one I had been missing. A surveillance fee, which the schedule sets at 30 percent of the base fee, recurs while a grade remains outstanding. It is not attached to a new issue. If a company stops selling bonds but keeps its grade alive, that line keeps arriving. This is where issuance volume and revenue can separate.
Shorter paper carries half the proportional rate
The company also grades short-term instruments. The electronic short-term bond schedule sets the base fee at total assets multiplied by 0.3 per ten thousand, bounded between 10 million and 30 million won for large companies, with a proportional fee of the issuance limit multiplied by 0.5 per ten thousand and a 20 million won cap. Surveillance is again 30 percent of the base fee. Against the corporate bond proportional rate of one per ten thousand, the short-term rate of 0.5 per ten thousand is half.
So when issuance migrates from bonds to short-term paper, case counts rise and the proportional rate per case halves. How those two directions net out inside reported revenue cannot be counted from outside unless the company splits the line, and I did not find that split in what I could open this session.
Korea Ratings stock beside two comparables priced the same day
I wanted firms that sell the same product and publish enough on one screen to let me read market value per unit of sales and net margin together. Moody’s Corporation and S&P Global qualify, and both screens I used are dated September 4, 2026, the same session as my Korean close. That is the tightest date alignment I have managed on a peer table.
| Company | Screen date | Market value | Trailing sales | Value per sales | Net margin |
|---|---|---|---|---|---|
| Korea Ratings (KOSDAQ 034950) | 2026-09-04 | KRW 471.76bn | KRW 109.78bn | 4.30x | 26.76% |
| Moody’s (NYSE MCO) | 2026-09-04 | USD 85.47bn | USD 8.16bn | 10.47x | 34.31% |
| S&P Global (NYSE SPGI) | 2026-09-04 | USD 130.74bn | USD 16.12bn | 8.11x | 30.52% |
| Distance from Korea Ratings | same session | not compared | not compared | 2.44x and 1.89x | 7.55pp and 3.76pp |
Every ratio in that table is computed inside a single currency, so no conversion runs across the rows. I reproduced each screen before using it. Moody’s market value checks out at 493.55 times 173.18 million shares, and S&P Global at 443.51 times 294.77 million shares, both landing within 0.01 percent of the published figures. The one number I could not close was Moody’s stated 32.03 price-to-earnings against 493.55 divided by trailing earnings per share of 15.74, which gives 31.36, a 2.1 percent difference I did not resolve and did not build on.
The price gap is wider than the margin gap
Dividing 10.47 by 4.30 gives 2.44. Dividing 8.11 by 4.30 gives 1.89. On the profitability side the differences are 7.55 and 3.76 percentage points from a base of 26.76 percent. I deliberately did not multiply the two distances together or fold them into one score. Two ratios built on different bases do not combine into a third one that means anything, and a figure like that would look like evidence while carrying none.
What I will say is narrower. Whatever explains this price distance is not sitting in the net margin line. It could be scale, index membership, the breadth of the American firms beyond ratings, the depth of the market each trades in, or the simple fact that one of these is a KOSDAQ name with a market value under USD 400 million. I did not verify any of those, so I am listing them as candidates and leaving them unranked.

Korea Ratings stock against a bond market that shrank
The Financial Supervisory Service counts Korean corporate bond issuance every year. In the first half of 2026 it came to KRW 123.60 trillion, down KRW 22.10 trillion from KRW 145.70 trillion a year earlier, a 15.2 percent decline in the regulator’s wording. Over the same six months, short-term paper went the other way. Korean press reporting the regulator’s tally on August 4, 2026 put electronic short-term bond issuance at KRW 990.09 trillion, up KRW 470.03 trillion or 90.4 percent, with commercial paper and short-term paper together at KRW 1,272.85 trillion, up 68.0 percent.
This company’s revenue for those same six months rose. It went from KRW 64.72 billion to KRW 65.67 billion, an increase of KRW 0.95 billion, which is 1.47 percent against the KRW 64.72 billion base. A bond market that shrank by 15.2 percent sat beside revenue that grew.
The annual series says the same thing twice more
I checked the two full years where the regulator’s published growth rate and the company’s revenue were both available to me. In 2023 corporate bond issuance rose 28.6 percent to KRW 234.81 trillion from KRW 182.63 trillion, per the tally released January 24, 2024 and its predecessor of January 20, 2023. Revenue that year fell from KRW 101.58 billion to KRW 95.59 billion, which against the KRW 101.58 billion base is a 5.89 percent decline. In 2025 issuance edged down 0.7 percent to KRW 276.25 trillion across 4,184 deals, reported February 4, 2026, while revenue rose 5.50 percent from KRW 104.06 billion to KRW 109.78 billion.
Three checkable stretches, three opposite signs. The only year where the two moved together was 2024, and that is the year whose issuance growth rate I had to derive myself by dividing KRW 276.25 trillion by 0.993. I am uneasy that the agreeing observation is the derived one. Four points, one of them constructed, is not a law, and I am not going to call it one.
Dividing revenue by the published ceiling
A published ceiling permits arithmetic. Full-year 2025 revenue of KRW 109.78 billion divided by the 60 million won per-case ceiling gives 1,829.68 cases, and that assumes every single case collected the maximum. Real rates sit below the ceiling, so the true count would be higher. Set that derived 1,829.68 against the 4,184 deals the whole market produced in 2025 and the ratio is 43.73 percent. One of three licensed firms would have to grade nearly forty-four percent of every deal in the country at top rate before corporate bond work alone accounted for this revenue line.
That arithmetic says one thing and refuses to say several others. It says corporate bond assessments by themselves do not explain the revenue. It does not tell me how many cases this firm actually graded, how often two agencies rate a single deal, or how revenue splits between assessment fees and the research and information services the company also sells. Each of those three gaps is written into this piece as a gap. None of them is filled with a plausible guess.
What the half-year filing shows
The interim report was received on August 14, 2026 under receipt number 20260814002245. It reports six-month revenue of KRW 65.67 billion, operating profit of KRW 25.58 billion, consolidated net income of KRW 21.32 billion, and net income attributable to owners of KRW 17.96 billion. The cumulative operating margin is 38.95 percent.
Operating profit for those six months moved from KRW 25.559 billion to KRW 25.580 billion, an increase of KRW 21 million, or 0.08 percent on the KRW 25.559 billion base. Against KRW 0.95 billion of added revenue, KRW 21 million reached operating profit, so 2.21 percent of the increment survived. Revenue grew and profit did not follow it.
Across the four full years the operating margin held at 29.46 percent for 2022, 27.03 percent for 2023, 31.41 percent for 2024 and 31.28 percent for 2025, while revenue itself moved between KRW 95.59 billion and KRW 109.78 billion. That is a revenue spread of KRW 14.19 billion, or 14.84 percent measured on the KRW 95.59 billion low, sitting under a margin that stayed inside a range of 4.38 percentage points. Measured against its own midpoint the margin range is 15.0 percent and the revenue range is 14.84 percent, so the two move by almost the same proportion. I went in expecting the margin to swing harder than revenue on a cost base this fixed, and it did not.
The balance sheet at June 30, 2026 shows assets of KRW 175.99 billion, equity of KRW 128.32 billion, and liabilities of KRW 47.67 billion, a debt ratio of 37.15 percent. Interest expense for the half was KRW 27 million, and operating profit divided by that figure gives 947.4x, matching the 947.41 interest coverage on my data screen. Capital expenditure across the four years from 2022 to 2025 was KRW 0.192 billion, KRW 0.255 billion, KRW 0.273 billion and KRW 0.701 billion, summing to KRW 1.421 billion. Almost nothing goes into equipment here, which is the shape of a business whose asset is its staff.
Korea Ratings stock, the dividend, and a payout above profit
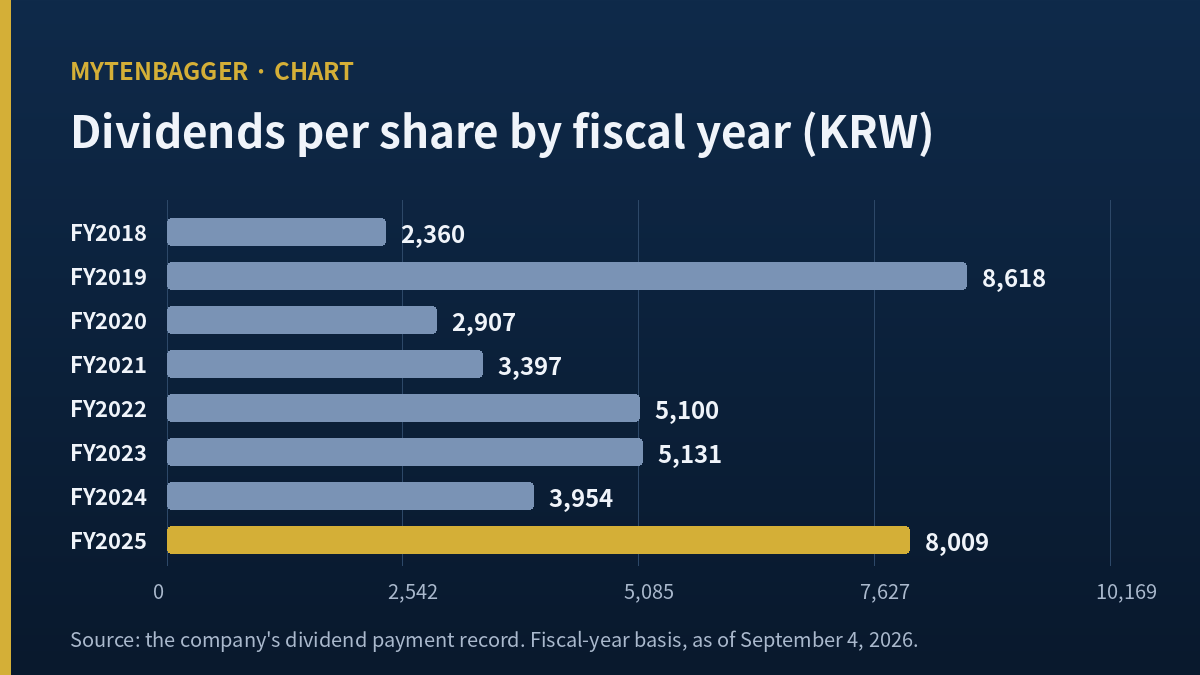
Dividends per share by fiscal year run 2,360 won for 2018, 8,618 for 2019, 2,907 for 2020, 3,397 for 2021, 5,100 for 2022, 5,131 for 2023, 3,954 for 2024, and 8,009 for 2025. No two of the eight are the same. A Korean dividend record shows the 8,009 won for fiscal 2025 carried a record date of February 27, 2026 and a payment date of April 10, 2026, and shows the fiscal 2023 amount arriving in two parts, 1,381 won on a June 30, 2023 record date and 3,750 won on a December 31, 2023 record date, which sum to 5,131. Whether other years carried interim payments is not settled by that table, so I have left it alone.
The 8,009 won for fiscal 2025 is 2.026x the 3,954 won for fiscal 2024. Owner net income across the same two years went from KRW 24.43 billion to KRW 25.23 billion, a rise of 3.25 percent. Multiplying 8,009 won by the 4,540,514 shares the company lists gives a dividend outlay of KRW 36.36 billion, which is 144.15 percent of fiscal 2025 owner net income. Both of those are my own derivations. At the September 4, 2026 close the dividend yield is 7.71 percent, and 8,009 divided by 103,900 returns 7.708 percent, so the screen figure reproduces.
What argues against me
- Four observations, one of them constructed. Signs disagreeing three times can happen by chance in a sample this small.
- I do not know the size of the surveillance line. The 30 percent ratio is published, but how many outstanding grades this firm maintains is not something I could count. Explaining a pattern with an item of unknown magnitude is half an explanation.
- One quarter did behave the way I first expected. Of the eighteen quarters I can build from the filings, exactly one shows an operating loss, and it is the quarter ended December 2022. Standalone revenue that quarter was KRW 17.08 billion against an operating loss of KRW 0.895 billion, a margin of negative 5.24 percent. That was the quarter Korean credit markets seized, and full-year 2022 issuance fell 11.6 percent to KRW 182.63 trillion. My premise is not refuted everywhere. It is refuted in the three stretches I could measure directly and supported in the one quarter where the shock was severe enough to show.
- The issuance decline is still running. First-half 2026 corporate bond issuance was KRW 22.10 trillion below the KRW 145.70 trillion of a year earlier. A long enough decline reduces the population of companies keeping a grade alive.
- The three-firm structure rests on a reviewable decision. The 2016 plan declined a fourth entrant at that time and set up a committee to keep reviewing entry.
- Nothing here is cheap on the screen. Trailing price-to-earnings is 18.7x and price-to-book is 3.5x on my data screen.
- No named brokerage forward estimate reached me. I found no named Korean sell-side model for this company in this session. That goes into the piece as a coverage blank, and no projection of my own goes in to cover it. When I looked at a Korean name resting on estimates nobody had revised, at least the estimates existed.
- I could not identify the largest shareholder from a primary filing. Foreign holders sit at 80.85 percent of the register on my data screen, but I did not confirm from an original document who inside that block holds what. Because of that I have kept ownership out of the argument entirely.
Korea Ratings stock and the numbers I could not reproduce
Multiplying the September 4, 2026 close of KRW 103,900 by the 4,540,514 listed shares the company reports gives KRW 471.76 billion, matching to the won the 471,759 million the company posts as its market value on the same date. My data screen carries 4,540,905 shares instead, 391 more, a difference of 0.0086 percent. I used the company figure.
Working back from the screen’s 18.7 price-to-earnings, 103,900 divided by 18.7 is 5,556 won, and multiplied by 4,540,514 shares that is KRW 25.228 billion. Fiscal 2025 owner net income is KRW 25.228 billion. The two agree to 0.0009 percent, which tells me the displayed ratio rests on owner profit and not on the KRW 29.38 billion consolidated figure. The gap between those two exists because KRW 13.77 billion of the KRW 146.02 billion consolidated equity belongs to minority holders. I split the profit line before I used any ratio built on it, the same habit I brought to a quarter whose revenue lines needed separating.
Book value per share of 29,647 won times 4,540,514 shares gives KRW 134.61 billion against year-end owner equity of KRW 132.25 billion, 1.787 percent higher, and I could not settle which date or basis the screen uses. Return on equity of 20.1 percent does reproduce as owner profit over average owner equity, 25.228 divided by the mean of 118.99 and 132.25, giving 20.083 percent. The payout ratio field of 144.2 percent reproduces as 8,009 over 5,556. A second payout field showing 23.5 percent did not reproduce against any profit measure I tried, and it appears nowhere in my argument.

Reaching Korea Ratings stock from outside Korea
There is no depositary receipt for this company that I could locate, so a holder outside Korea would need direct KOSDAQ access through a broker that offers it. What makes this one unusual is not the size of the market value, which at roughly USD 349.3 million is small but not exceptional. It is that foreign holders already sit at 80.85 percent of the register while the identity of the largest of them is something I could not pin down from an original filing. A prospective foreign buyer would be joining a register that is already almost entirely foreign, without my being able to tell them who is standing in it.
Anyone screening Korea through a broad country fund would want to check the holdings list before assuming exposure here. I did not confirm whether the widely held Korea funds carry this name, and I am not going to state that they do or do not on an assumption.
Where I leave Korea Ratings stock
No position and no order. Watching, priced off the September 4, 2026 close of KRW 103,900. Over 250 sessions the high is 115,000 and the low is 92,400, putting the close at 90.3 percent of the high and 12.4 percent above the low. The 20, 60 and 120 session averages sit at 102,940, 101,608 and 102,208, and the highest of the three is 1,332 won above the lowest.
What I am doing on the way out is not choosing an entry. It is ordering the four things I failed to close by how cheap each one is to check, so that the next person opening this file, which will be me, can work down the list. The published 2024 issuance figure is first, because one regulator release replaces my derived cell and settles whether the single agreeing year really agreed. The size of the surveillance fee line is second. The revenue split between assessment work and everything else is third and probably sits in the same footnote as the second. The largest shareholder and the stake is fourth, because the annual report certainly answers it and the answer certainly does not change this argument.
Ranking them that way exposes something uncomfortable. The first and fourth will open, and the second and third may never open. The two that decide whether my explanation holds are the two that might stay shut. The next scheduled look is the third quarter report on Monday, November 16, 2026, one day after the statutory filing date of November 15, which falls on a Sunday.
Sources and basis. Share price, market value, listed share count and the 52 week high and low are from the company’s own investor page for the September 4, 2026 close. Trailing price-to-earnings, price-to-book, return on equity, dividend yield, payout ratio, foreign ownership, moving averages and the 250 session high and low are from a Kiwoom Securities data feed, also on the September 4, 2026 close. Revenue, operating profit, net income, equity and cash flow figures come from the company’s consolidated filings, receipt number 20260326001257 for fiscal 2025 and 20260814002245 for the 2026 interim period. Corporate bond, commercial paper and short-term paper issuance figures are Financial Supervisory Service tallies as cited above. The currency reference used once in this piece is 1,350.4 KRW per USD at the Seoul afternoon close of 2026-09-04, as reported by Korean press that day. Every figure I labeled as derived was calculated by me from the values named beside it.