
Golfzon Stock Added 689 Stores As Revenue Per Store Fell
I play screen golf about twenty times a year, spread across three venues near my apartment. One of them closed early this year, and two new ones opened within a ten minute walk. I heard that store counts were rising from my own neighborhood before I read it in a company release.
So when I opened Golfzon stock, the first line I reached for was not revenue. It was the store count, because that is the number the company puts next to every weak quarter. In the May 6, 2026 first quarter release and again in the August second quarter release, two lines pointed upward: overseas revenue and the store count. Only one of those two can be counted in units.
I moved that line under the division bar and the direction flipped.
One revenue figure, divided three different ways (H1 2025 to H1 2026)
Undivided. Consolidated revenue KRW 250,895mn to KRW 213,040mn. Down 15.09 percent.
Per share outstanding. KRW 39,983 to KRW 33,951. Down 15.09 percent, because the share count held at 6,275,103.
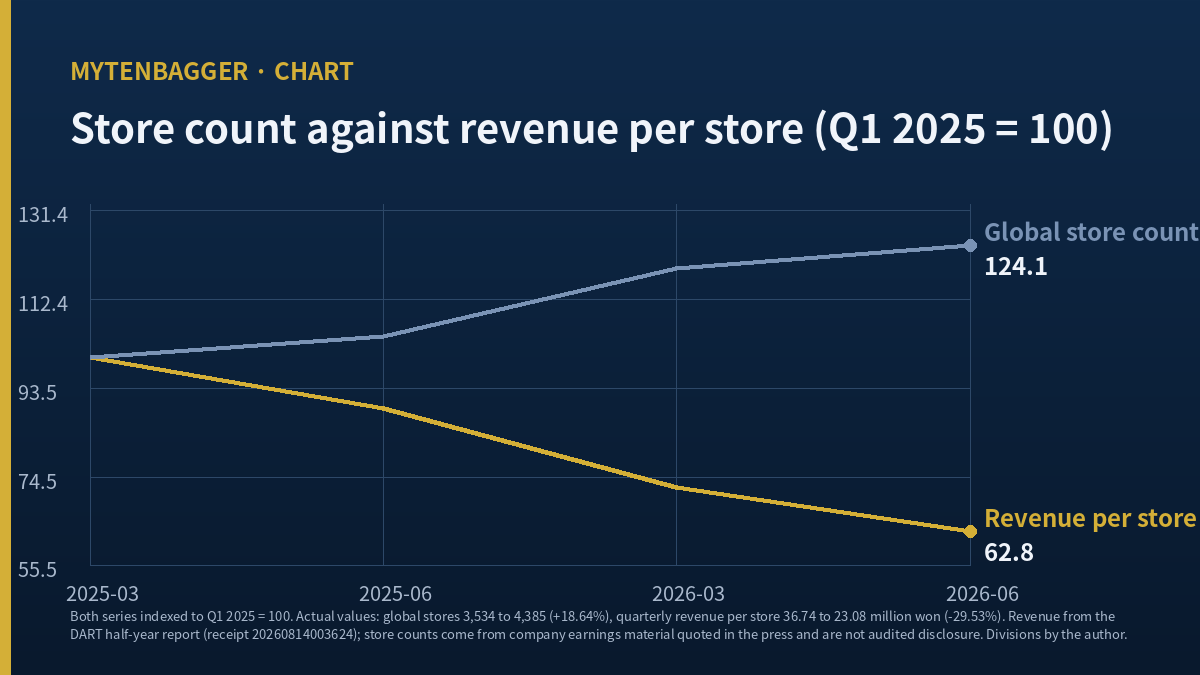
Per global store. KRW 67.88mn to KRW 48.58mn. Down 28.43 percent.
Same division, Q2 alone. KRW 32.75mn to KRW 23.08mn. Down 29.53 percent.
Revenue from the semiannual regulatory filing. Store counts from company releases carried by Korean press. The arithmetic is mine. Not owned, no order, watching.
Contents
Why I counted stores before I looked at Golfzon stock
Golfzon trades on KOSDAQ, the smaller of Korea’s two main boards. KOSDAQ lists growth and mid cap names; KOSPI lists the large caps that most foreign investors already know. The two boards clear through the same exchange but screen very differently, and a KOSDAQ line rarely shows up in an index product sold outside Korea.
The close on Monday, September 7, 2026 was KRW 36,350. Multiplied by 6,275,103 shares outstanding, market value comes to KRW 228.1bn, which matches the vendor screen at the precision the screen prints. At 1,340.5 KRW per USD, the Seoul afternoon fix on 2026-09-07, that is roughly USD 170mn. Par value of KRW 500 times the share count gives KRW 3.14bn, and the screen prints paid in capital of KRW 3.1bn. Price data is Kiwoom, on the 2026-09-07 close.
What this company actually sells
For readers outside Korea the business needs one paragraph, because there is no clean American analogue. Golfzon builds golf simulators: a hitting bay, a sensor array and course software. Those systems go into small indoor venues, most of them a few hundred square feet in a commercial building basement or upper floor, run by an individual operator. Some venues carry the brand under a franchise agreement and some buy the hardware without it, which is why the company reports franchise and non franchise lines separately. A third line, driving range, covers outdoor practice range installations. A fourth covers overseas, where the same hardware is sold into venues in the United States, Vietnam, Japan and elsewhere.
So a store, in this company’s counting, is not a company operated location the way a Topgolf venue is. It is a customer site running the company’s equipment. That distinction matters for what follows, because it means the store count is closer to an installed base than to a retail footprint, and an installed base can grow while the revenue attached to each unit shrinks.
My habit with any volume figure a company volunteers is the same. I ask whether it can sit underneath revenue in a division. If it can, I divide and check the sign. If it cannot, I write down why. I did the same thing when I built two interest coverage ratios for Emart out of one year.
The two numbers I anchored Golfzon stock to
Revenue comes from the semiannual report filed on August 14, 2026 under receipt number 20260814003624. Consolidated first half revenue was KRW 213,040mn against KRW 250,895mn a year earlier. Operating profit was KRW 20,684mn against KRW 46,536mn. Operating margin moved from 18.55 percent to 9.71 percent, both of those my own calculation from the filed lines.
Store counts are not audited. They come from company presentations relayed by the Korean press. The first quarter figure appeared in a May 6, 2026 report, which put global stores at 4,207 against 3,534 a year before. The second quarter figure appeared in an August industry piece, at 4,385 against 3,696, a gain of 689 stores or 18.64 percent.
What one store earns, quarter by quarter
I divided each quarter’s consolidated revenue by the global store count reported at that quarter end. Four cells came out.
| Quarter | Global stores | Revenue, quarter alone | Per store, my calculation |
|---|---|---|---|
| Q1 2025 | 3,534 | KRW 129,837mn | KRW 36.74mn |
| Q2 2025 | 3,696 | KRW 121,058mn | KRW 32.75mn |
| Q1 2026 | 4,207 | KRW 111,832mn | KRW 26.58mn |
| Q2 2026 | 4,385 | KRW 101,208mn | KRW 23.08mn |
Matching like quarter to like quarter, Q1 fell 27.65 percent, from KRW 36.74mn to KRW 26.58mn. Q2 fell 29.53 percent, from KRW 32.75mn to KRW 23.08mn. I lined up the same quarters to strip out seasonality, and the two results sit less than two points apart.
I ran the same division on operating profit, because revenue per unit can fall while the unit still pays for itself. It does not hold here. First half operating profit per store went from KRW 12.59mn to KRW 4.72mn, down 62.54 percent, against the 28.43 percent fall in revenue per store. On the second quarter alone the gap is wider: KRW 5.35mn to KRW 1.51mn, down 71.78 percent. Both of those are my own arithmetic on filed operating profit and reported store counts, and both inherit every defect I list in the next section.
The finding is narrow and I want to state it narrowly. Revenue fell 15.09 percent while the store base grew 18.64 percent, so the load carried by any single store shrank faster than revenue did. The line the company offers as evidence of growth, and the figure produced when that line sits under revenue, point opposite ways.
Three defects in my own division
First, the top and the bottom of my ratio do not cover the same ground. Revenue is consolidated and includes franchise, non franchise, driving range and overseas subsidiary lines. The store count is the company’s global venue total. Revenue that never passes through a venue is sitting in my top line.
Second, the store count is a point in time balance and revenue is a flow. A store that opened in May did not produce three months of sales, but it enters my count as a whole unit. That error pushes per store revenue lower than it truly is.
Third, the company does not break out domestic store count separately. Domestic and overseas venues cannot carry the same ticket, and I collapsed them into one figure. None of the three reverses the sign, in my reading. All three move the size.
Where the added stores are and what shrank
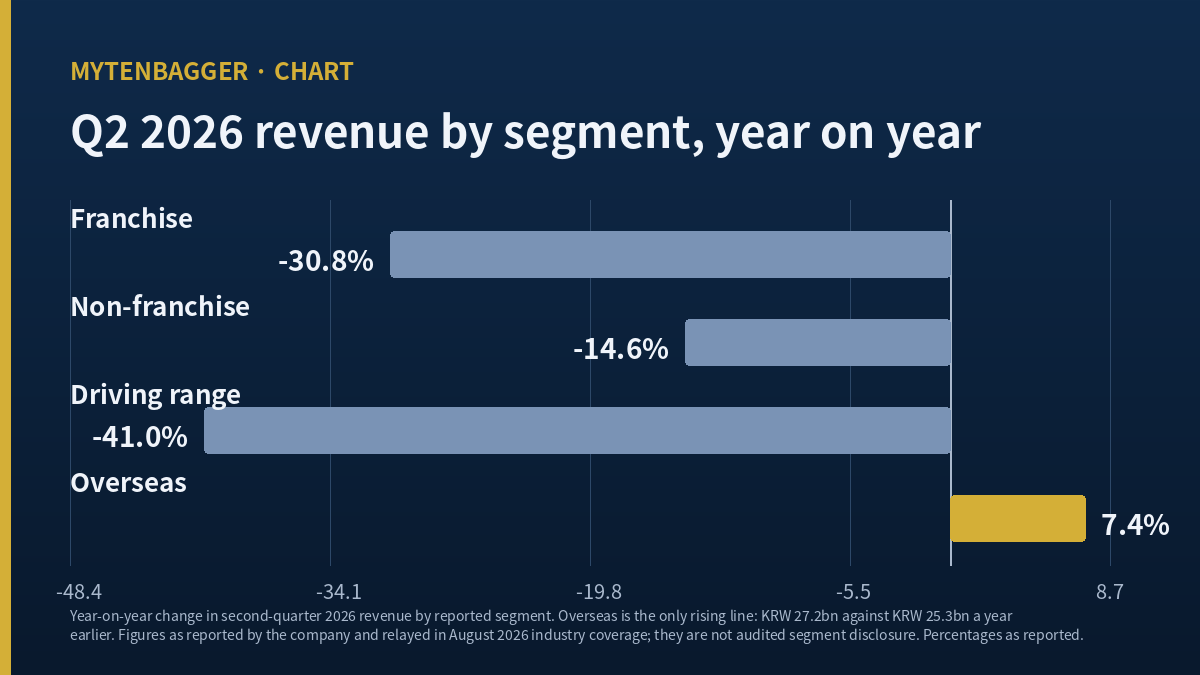
Segment direction splits. For the second quarter of 2026, as relayed in the August industry piece linked above, the company reported franchise revenue at minus 30.8 percent year on year, non franchise at minus 14.6 percent, driving range at minus 41.0 percent, and overseas at plus 7.4 percent, KRW 27.2bn against KRW 25.3bn. Dividing those two rounded figures myself gives 7.51 percent, and I read the 0.11 point gap as rounding. Overseas is the only line rising, and it is 26.88 percent of the KRW 101,208mn quarter by my calculation.
Franchise revenue down 30.8 percent and a store base up by 689 units belong to the same quarter. If most of the additions sit overseas, the two statements are consistent. What remains unexplained is why the blended per store figure keeps falling even though overseas venues and overseas revenue both grew.
Franchisees supply a different angle. A Korean outlet relaying operator complaints reported two of them: an equipment upgrade tends to arrive around the point where the previous machine has been paid off, and local catchment areas are crowded enough that nearby venues now compete with each other. I have watched per unit figures behave this way before, in a very different industry, when I looked at two Kangwon Land profit numbers pointing opposite ways.
One more figure that comes from dividing
There is a second ratio in the filings that behaves the same way, and it points at hardware. Inventory stood at KRW 66,457mn on June 30, 2026 against KRW 54,159mn a year earlier. Divided by the revenue of the quarter that just closed and scaled to ninety one days, that is 59.8 days of inventory against 40.7 days. Inventory grew 22.71 percent while quarterly revenue fell 16.40 percent, so the days figure stretched by roughly nineteen days in twelve months.
I am not going to call that a warning by itself. A company pushing 689 new installations into overseas markets has a reason to carry more finished equipment, and days of inventory is a crude measure that assumes an even sales pace. But it lines up with what the franchisees describe, which is an upgrade cycle arriving on the company’s schedule and not on theirs, and it is the only other volume adjacent number I could reach from the filings.
Three years of revenue behind Golfzon stock
This contraction did not start six months ago. Annual filed revenue was KRW 685,111mn in 2023, KRW 619,981mn in 2024 and KRW 483,261mn in 2025. That is KRW 201,850mn gone across two years, 29.46 percent. Operating profit over the same three years ran KRW 114,549mn, KRW 95,827mn and KRW 68,070mn, a decline of KRW 46,479mn. Operating margin walked down from 16.72 percent to 15.46 percent to 14.09 percent, slower than the top line fell.
Margin structure, in other words, did not break first. Volume fell and margin followed it down. That is precisely why I went looking for a volume line to divide by, and why the shortage of published volume lines at this company matters. Store count is the only one on offer.
A quarter that no filing prints on its own
Korean periodic filings give Q1, the half year, the nine month cumulative and the full year. The fourth quarter standing alone appears in no table. It has to be built by subtracting the nine month cumulative from the annual figure. Built that way, four fourth quarters look like this.
Net profit was KRW 1,827mn in Q4 2022, KRW 6,101mn in Q4 2023, minus KRW 12,141mn in Q4 2024 and minus KRW 29,670mn in Q4 2025. Operating profit in those same four quarters was KRW 7,442mn, KRW 14,712mn, KRW 11,092mn and KRW 6,244mn, positive throughout.
Full year 2025 net profit of KRW 12,862mn is therefore what survived after KRW 42,532mn earned through September and KRW 29,670mn lost in the final quarter. I could not confirm what caused that loss. Korea’s Supreme Court sent a copyright case against the company back to the Seoul High Court in February 2026, and the Korean outlet linked earlier puts the claim at roughly KRW 30.7bn, but I found no document tying that case to this quarter. I am leaving the fact standing and inventing no explanation for it.
Golfzon stock against two golf peers I can check
I looked for listed companies whose revenue depends on people playing golf, and whose figures I could reproduce. Two were reachable.
| Company | Period | Revenue | Operating margin | Reporting currency |
|---|---|---|---|---|
| Golfzon (KOSDAQ: 215000) | FY2025 | 483,261mn | 14.09 percent | KRW |
| Golfzon (KOSDAQ: 215000) | H1 2026 | 213,040mn | 9.71 percent | KRW |
| Acushnet Holdings (NYSE: GOLF) | TTM, screen of Sep 4, 2026 | 2.71bn | 12.12 percent | USD |
| Callaway Golf (NYSE: CALY) | TTM, screen of Sep 7, 2026 | 2.13bn | 9.40 percent | USD |
What this table is not doing
No currency conversion happens in that table and I make no claim about which company is larger. The periods differ as well, and I printed each one so nobody reads a single common window into it. The Golfzon rows are annual and half year filed figures; the two American rows are trailing twelve month screens taken on different days, which I also printed.
The Acushnet page reproduces cleanly: USD 86.88 times 58.41mn shares gives USD 5.07bn against a printed market value of USD 5.07bn, and 86.88 divided by EPS of 3.66 gives 23.74 against a printed ratio of 23.75. The Callaway page does not: it prints a positive earnings ratio of 36.46 alongside EPS of minus 1.45, which cannot both be right. I use only its revenue and operating margin and I leave its earnings ratio out.
What I take from the row is modest. Golfzon’s operating margin is the highest of the three. Whatever is wrong at this company is not that it converts sales into operating profit badly. It is that there are fewer sales every quarter.
Related reading: the Hotel Shilla gap that was mostly not the stock
The case against my reading of Golfzon stock
Six places where my division does not settle the question.
One. Overseas really is growing. Second quarter overseas revenue of KRW 27.2bn beat the prior year’s KRW 25.3bn, with the company crediting the United States and Vietnam. A falling per store figure does not mean new stores lose money.
Two. New venues take time to reach a normal run rate. If 689 opened within a year, many have not finished a first full year, and every one of them counts as a whole unit in my division.
Three. Operating margin is still close to double digits. First half 2026 at 9.71 percent is half of the prior year’s 18.55 percent, but revenue fell 15.09 percent without pushing the company into an operating loss.
Four. There is a dividend. The FY2025 payment of KRW 4,000 a share against the September 7 close of KRW 36,350 works out to 11.00 percent, my own division. Nothing guarantees the next one matches.
Five. Two named Korean brokers rate this a buy. Park Jong sun of Eugene Investment held a KRW 70,000 valuation in an August 7, 2026 note, projecting third quarter revenue of KRW 113.0bn and operating profit of KRW 10.2bn, and citing 6.8 times 2026 estimated earnings. Baek Jun ki of NH Investment carried KRW 72,000 in a January 16, 2026 note, cut 21.7 percent from his prior figure. Both of them cite the same store count I used as my division line.
Six. The NH note also estimated domestic screen golf rounds at about 92 million for the year, down about 5 percent, and new system sales at roughly 900 units. Those are the volume lines I wanted and could not get from filings. They are broker estimates, not company disclosure, and I cannot check either one.
What I would divide by next
Not owned, no order, watching. Not because the company looks bad to me, but because everything above rests on one unaudited volume line, and if the company changes how it counts venues my arithmetic changes with it.
So instead of a summary I will name the three figures I want underneath revenue next. The first is a domestic only store count, which would let me split the per store number into two lanes; a Korean franchise disclosure filing or the annual report’s franchise section could carry it. The second is rounds played, the roughly 92 million the NH note estimated, which would let me divide by usage instead of by venues. The third is new system unit sales, roughly 900 in that same note; if that holds, a large share of the 30.8 percent franchise decline came from hardware instead of from play, and my per store reading would have to be rewritten as an equipment cycle story.
I should also name what would move me the other way, because a watch list entry with only one exit is not a real position. If the third quarter shows revenue per store flat against the second quarter at roughly KRW 23mn while the store count keeps climbing, the fall has found a floor and the added venues are starting to carry themselves. If overseas revenue clears 30 percent of the consolidated quarter, up from 26.88 percent, the mix shift is fast enough to matter to the blended figure within a year. Either of those would make me stop treating store growth as dilution, and I would rather write that down now than decide it after the fact.
The statutory deadline for the third quarter report is November 15, 2026, which falls on a Sunday, so the filing lands on November 16, 2026 or after. Until then I am not buying this name. I am only counting how many more stores there are.