Dongsung Finetec Stock: Eighteen Quarters From 1.2% to 16.0%
I keep a file on Dongsung Finetec stock because of one column I built by hand. It has eighteen rows, one for each discrete quarter this company has reported since the start of 2022, and each row holds a single figure: operating profit divided by revenue for that quarter alone. The first row reads 1.21 percent. The last row reads 16.01 percent. Between those two rows the shares went up, and then they came most of the way back down. I wanted to see whether the two series had anything to say to each other.
Operating margin = operating profit divided by revenue, one quarter at a time.
Q1 2022: 1,304 divided by 107,884 = 1.21%
Q3 2025: 23,510 divided by 201,106 = 11.69%
Q2 2026: 35,940 divided by 224,534 = 16.01%
All figures in millions of Korean won, from DART filings. Every percentage on this page is one I divided myself.
Contents
What Dongsung Finetec stock looks like as eighteen rows
Dongsung Finetec makes cryogenic insulation for liquefied natural gas containment: the panel systems that line the tanks of LNG carriers and onshore storage. It trades on KOSDAQ, the smaller of Korea’s two main boards, which sits alongside the large-cap KOSPI and carries most of the country’s mid-size industrial suppliers. Ticker 033500.
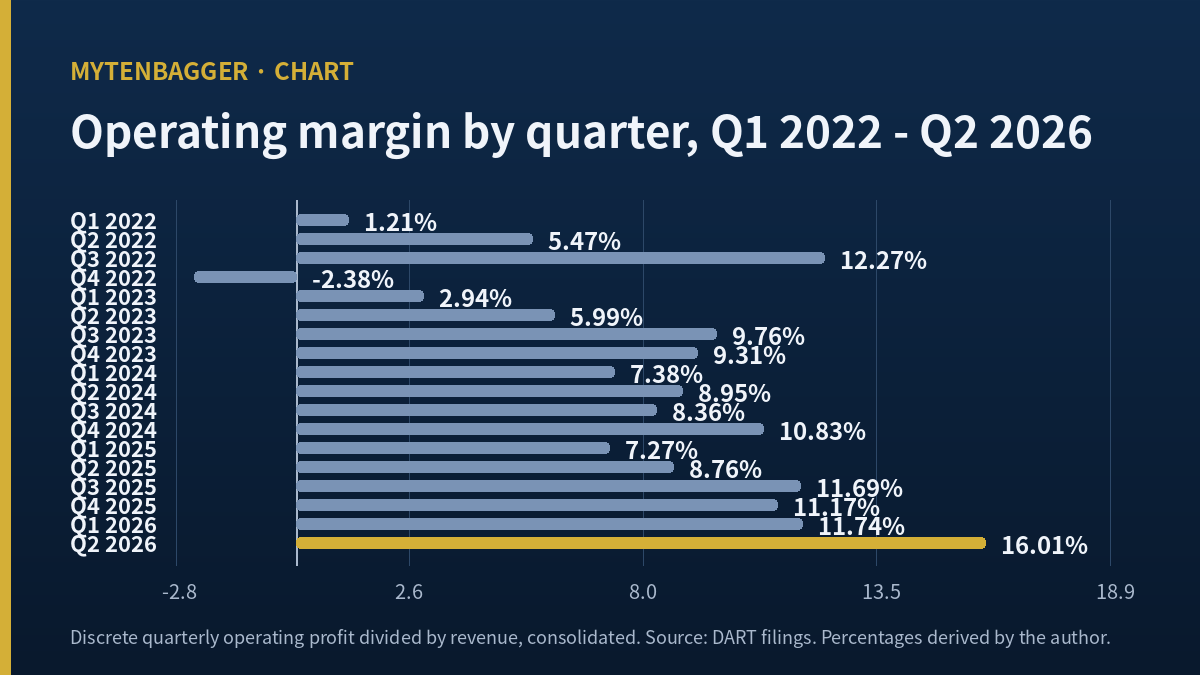
Here is the column. Quarterly figures are discrete, meaning I am using single-quarter values and never the year-to-date cumulative numbers that Korean filings report by default.
| Quarter | Revenue | Operating profit | Margin |
|---|---|---|---|
| Q1 2022 | 107,884 | 1,304 | 1.21% |
| Q2 2022 | 106,560 | 5,833 | 5.47% |
| Q3 2022 | 91,260 | 11,194 | 12.27% |
| Q4 2022 | 128,447 | -3,054 | -2.38% |
| Q1 2023 | 124,083 | 3,653 | 2.94% |
| Q2 2023 | 144,000 | 8,620 | 5.99% |
| Q3 2023 | 124,305 | 12,127 | 9.76% |
| Q4 2023 | 139,020 | 12,939 | 9.31% |
| Q1 2024 | 137,270 | 10,126 | 7.38% |
| Q2 2024 | 137,846 | 12,332 | 8.95% |
| Q3 2024 | 136,546 | 11,419 | 8.36% |
| Q4 2024 | 185,747 | 20,111 | 10.83% |
| Q1 2025 | 172,366 | 12,532 | 7.27% |
| Q2 2025 | 193,322 | 16,933 | 8.76% |
| Q3 2025 | 201,106 | 23,510 | 11.69% |
| Q4 2025 | 175,392 | 19,583 | 11.17% |
| Q1 2026 | 169,129 | 19,854 | 11.74% |
| Q2 2026 | 224,534 | 35,940 | 16.01% |
The highest cell is 13.24 times the lowest one. That multiple is arithmetic, and it flatters the story, because the lowest cell sits in a quarter when this company was barely profitable at all. The honest version of the sentence is that a business which once converted roughly one won in every hundred into operating profit now converts sixteen.
Two cells break the climb, and I want them visible, so I am putting them here. Q4 2022 is negative. Q1 2025 falls to 7.27 percent from 10.83 percent the quarter before. Both of those are the fourth-quarter and first-quarter pattern this company shows repeatedly, and I do not have a filed explanation for either, so I am not going to invent one.
Where the annual figures behind Dongsung Finetec stock sit
Annual consolidated results tell the same story more slowly, which is why I built the quarterly column in the first place. Four fiscal years, all consolidated, all from DART:
| Fiscal year | Revenue | Operating profit | Margin |
|---|---|---|---|
| 2022 | 434,151 | 15,277 | 3.52% |
| 2023 | 531,408 | 37,339 | 7.03% |
| 2024 | 597,409 | 53,988 | 9.04% |
| 2025 | 742,186 | 72,558 | 9.78% |
Annual revenue grew 70.95 percent across those four years and annual operating profit grew 374.95 percent, both by my calculation. The annual margin column never reaches 10 percent, though, which is the point of running the quarterly view alongside it. Full-year figures average away the quarter that matters.
Q2 2026 produced 224,534 million won of revenue and 35,940 million won of operating profit. Set that against Q2 2025, which produced 193,322 and 16,933. Revenue grew 16.15 percent and operating profit grew 112.25 percent, both derived by me from the two filings. That is the whole file compressed into one comparison: modest volume growth, large profit growth.
One more comparison sits underneath that. Q2 2026 revenue was 32.76 percent higher than Q1 2026 revenue, and Q2 2026 operating profit was 81.02 percent higher than Q1 2026 operating profit, both derived by me from the two filings. Sequential quarters inside one fiscal year remove the year-over-year base effect entirely, and the same asymmetry survives: the profit line moves about two and a half times as fast as the revenue line in either framing.
Korean sell-side work I read through secondary coverage credits pricing on orders won from 2023 onward, together with raw material costs settling down. I could not open either source document, so I am carrying that explanation as a claim by named Korean brokerages, unverified by me.
The same climb, measured against equity
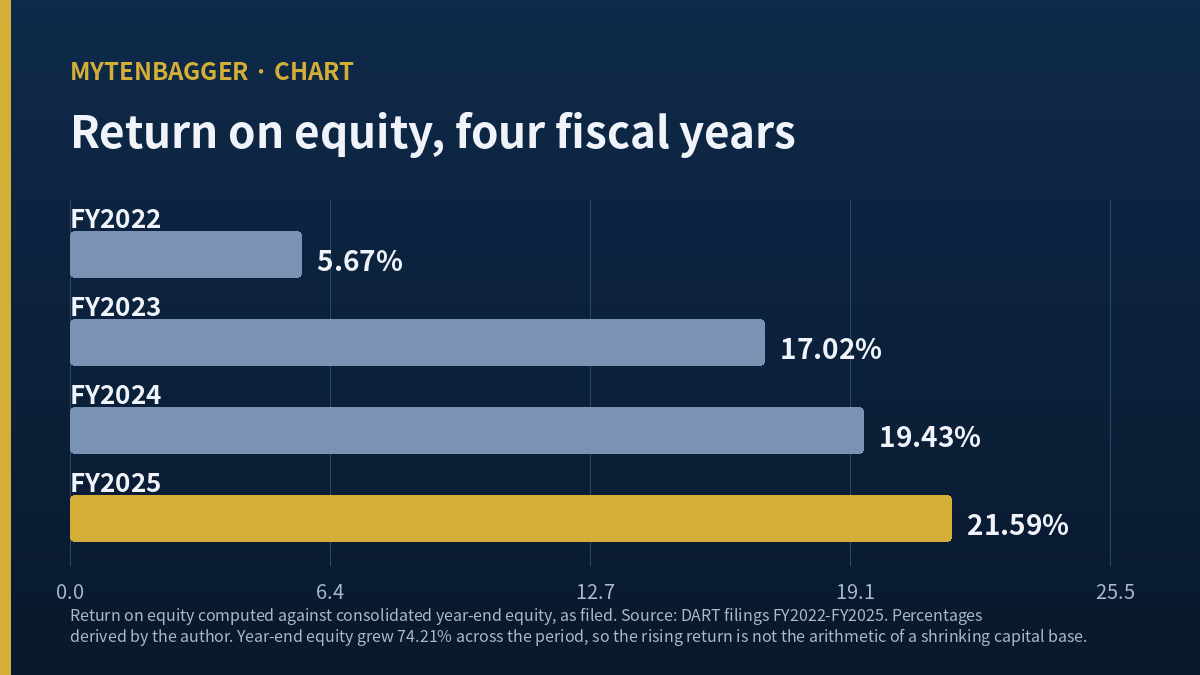
A margin series can rise because a company shrank its revenue base, so I ran the check that would catch that. Return on equity, taken from the same filing series and computed against equity at each year end, moves in the same direction as the margin column and moves further.
| Fiscal year | Equity at year end | Return on equity |
|---|---|---|
| 2022 | 148,615 | 5.67% |
| 2023 | 168,856 | 17.02% |
| 2024 | 202,436 | 19.43% |
| 2025 | 258,895 | 21.59% |
Equity grew 74.21 percent across those four years by my calculation, so the rising return is not the arithmetic of a shrinking capital base. The company earned more on a larger capital base each year. The vendor screen I use displays a different return figure, 24.2 percent, computed on a trailing basis, which is a different convention from the fiscal-year one, and I am using the filed annual series here so that every row in this table shares one measurement convention with every other.
What this does not tell me is durability. A return that climbs for four consecutive years is a description of four years. The reason I keep coming back to the quarterly column is that it is the only view fine enough to show me the turn, if there is one, before an annual figure would.
Peers for Dongsung Finetec stock, on one matched period
I built this table by giving up something. Every row is fiscal 2025, twelve months ending 31 December 2025, so the periods line up exactly. What that costs is recency: none of these rows is the most recent thing each company has published.
| Company | Revenue | Operating profit | Margin | Currency |
|---|---|---|---|---|
| Dongsung Finetec (KOSDAQ: 033500) | 742,186 | 72,558 | 9.78% | KRW million |
| Chart Industries (NYSE: GTLS) | 4,264 | 647.2 | 15.18% | USD million |
| Gaztransport & Technigaz (EPA: GTT) | 803.3 | 472.6 | 58.83% | EUR million |
| Nikkiso (TYO: 6376) | 215,642 | 15,183 | 7.04% | JPY million |
Why I would not put the latest quarter in this table
Chart Industries and Nikkiso both last reported a three-month period ending 31 March 2026. GTT reports twice a year, so its most recent published period is the six months ending 30 June 2026, which is twice as long and three months later. Putting those side by side under a heading that says “latest quarter” would have produced a table where one row silently means something different from the others. Fiscal 2025 is the last period where all four rows mean the same thing.
Why the 58.83 percent row is not a comparison
GTT licenses containment technology and collects royalties. Chart Industries and Nikkiso build equipment. A margin near 60 percent is what a licensing model produces, and setting it beside a manufacturer’s margin says nothing about how well either one is run. I left the row in because GTT is unavoidable in this supply chain, and I am flagging it so nobody reads the gap as a quality ranking. One further caveat: the Chart Industries page I used states the company was delisted on 16 July 2026 following its acquisition by Baker Hughes, so fiscal 2025 is close to the last full year it will report as an independent issuer.
Running the same four companies one year earlier changes the ordering, which is the main reason a single-year peer read cannot carry much weight here. On fiscal 2024 my divisions give 9.04 percent for this company, 15.56 percent for Chart Industries, 61.41 percent for GTT and 3.11 percent for Nikkiso. Nikkiso therefore moved from 3.11 percent to 7.04 percent in one year while this company moved from 9.04 to 9.78, so the gap between those two rows narrowed sharply even though the ranking held. A reader who saw only the fiscal 2025 table would take a stable ordering as a stable relationship, and one year of history is enough to show it is not.
The only cross-row statement I am willing to make is that this company’s fiscal 2025 margin sits above Nikkiso’s and below Chart Industries’, on matched periods and without any currency conversion. Because every row is in its own currency, this table cannot rank the four companies by size, and I did not try.
What Dongsung Finetec stock did while the column climbed
The closing high of the last 250 trading sessions is 34,050 won, set on 8 September 2025. The close on 7 September 2026 was 17,120 won, which is 49.72 percent below that high by my calculation. Over roughly the same span, the quarterly margin column went from 11.69 percent to 16.01 percent.
Price to book on that close is 1.98, against book value per share of 8,649 won as reported on the vendor screen I use. That is worth pausing on. A stock down by half still carries almost twice its book value, which tells me the market has not repriced this business as a failing one. It has repriced how much of the current profitability it expects to persist.
The reason it might not persist is the delivery pipeline this company sells into. Korean trade coverage from 2025, citing Korea Eximbank material, described a global LNG carrier fleet on course to grow by close to two-fifths within three years, with a heavy delivery schedule running through 2027. The same article put charter rates for the smaller 145,000 cubic meter class at 3,462 dollars a day and called that a loss-making level. That reporting is well over a year older than the close I am working from, so I treat it as evidence of when the concern started, with no bearing on the present. I did not verify what happened to rates or deliveries afterward. Similar timing questions run through the whole Korean yard complex, which is why I keep files like the one on HD Hyundai Heavy Industries and the Qatar LNG selloff next to this one.
Related reading: Hankuk Carbon
Figures I checked and did not use
Three-year revenue compound growth
The vendor screen offers 19.57 percent for three-year revenue growth. My four annual rows start in a year when this company earned a 3.52 percent margin, and compounding from a depressed base produces a figure that reads as momentum when it is partly recovery. I left it out.
The dividend payout fields
Two payout ratio figures appear on the same screen, 21.5 and 61.9, and I could not establish what each divides by. Where a vendor gives me two values for one concept without saying what separates them, I use neither.
Forward multiples
Forward earnings, forward price to earnings and peer multiple fields are all empty for this company, which is normal for KOSDAQ names of this size and is the reason the peer table above is built from filed history instead. One thing I did check and it held: the four discrete quarters of 2025 sum to the filed annual revenue and operating profit exactly, so the quarterly column I built is internally consistent with the annual one.
My stance on Dongsung Finetec stock and what would break it
I do not own this and I have no order in. It sits outside the size band where I take positions, and I did not make an exception. What I am doing is keeping the column and adding one row per filing.
The stance underneath that is narrow. I think a margin series is only usable as evidence once I know how far ahead of it the price is looking, and on this company I do not know that yet. So I am treating 16.01 percent as a fact about the past and refusing to treat it as a fact about the future.
Two things would end the file as written. First, if quarterly operating margin prints below 12 percent for two consecutive quarters, the climb I built this piece around has turned over and the eighteen-row column becomes a description of a cycle peak. Second, if it prints above 18 percent instead, my caution was the error, and I want that written down where I cannot quietly forget it. The next filing that settles either question is the third-quarter report, statutorily due 15 November 2026, which falls on a Sunday, so in practice 16 November 2026 or later.
Where I could be wrong
- The eighteen-row column is my construction. Nobody files it in this form, and building it required me to convert cumulative figures into discrete ones.
- Two of those rows, both fourth quarters, are computed as the annual figure minus the nine-month cumulative. Year-end adjustments land in those cells.
- I have no filed explanation for why Q4 2022 was negative, and I did not go looking in the footnotes.
- The pricing explanation for margin expansion comes from Korean brokerage commentary I read in secondary coverage. I did not open a primary report.
- Raw material costs settling down was also cited as a driver, and I could not separate its contribution from pricing.
- I did not obtain an order backlog figure. Writing about a supplier’s forward profitability without one is a real hole.
- The LNG carrier oversupply material is from 2025 and I did not update it.
- That material came through a Korean outlet quoting Korea Eximbank. I did not read the Eximbank source.
- Book value per share as displayed does not reconcile to my own division of filed equity by shares outstanding, and I could not resolve which figure the screen uses.
- Two vendor screens disagree about shares outstanding by a small number of shares, and I could not determine which is correct.
- The peer set is three companies I chose. A different three would move the position of this company’s row inside it.
- Chart Industries has been delisted, so one peer row describes a company that no longer files independently.
- GTT’s business model differs enough that its inclusion arguably weakens the table more than it strengthens it.
- I did not examine competitive pressure from Chinese suppliers, which several Korean industry pieces treat as the main medium-term risk to panel pricing.
- Cash generation is absent from this piece by design, and first-half operating cash flow was negative, so a reader who cares about cash conversion is getting an incomplete file here.
- The weakest join is this: I claimed the market has repriced expected persistence of profitability. I have no evidence for what the market was thinking. A price to book of 1.98 is consistent with that story and with several others I did not test.
What I am keeping from Dongsung Finetec stock
The column, and one working rule. Eighteen rows took an hour to build and they answered a question that four annual figures could not: the annual margin never crosses 10 percent, and the most recent quarter is at 16.01 percent. If I had stopped at the annual table I would have concluded this was a company earning single-digit margins, and I would have been describing an average that no recent quarter resembles.
The second thing the column changed is what I now consider a complete reading of this company. Four annual rows and eighteen quarterly rows describe the same filings, and they disagree about what kind of business this is. An investor who reads only the annual table sees a supplier earning between 3.52 and 9.78 percent. An investor who reads only the last quarterly row sees one earning 16.01 percent. Neither reading is wrong about its own arithmetic, and neither is sufficient on its own, which is the case for keeping both tables on the same page, with neither one standing in for the other.
Row nineteen arrives with the third-quarter filing. I have written the two thresholds above precisely so that whoever opens this file later, including a version of me who has forgotten writing it, can settle the question with one number from one document.
Prices and multiples reflect the 7 September 2026 close as checked at the time of writing. Financial figures are consolidated, from Korea’s DART filing system, including the half-year report received 14 August 2026. Korean won is the reference currency throughout; the single dollar figure on this page uses roughly 1,340.5 won per dollar, the Seoul market rate carried from my most recent confirmed reading on 7 September 2026, and is approximate.
Sources: Kyungje Times on the June 2026 supply contract disclosure · Edaily Marketin on DS Investment & Securities coverage · Sisa Journal e on LNG carrier deliveries and charter rates · Chart Industries financials · GTT financials · Nikkiso financials · Buffett Lab on NH Investment & Securities coverage