Daedong Stock Added Inventory While the US Industry Cut Its Own
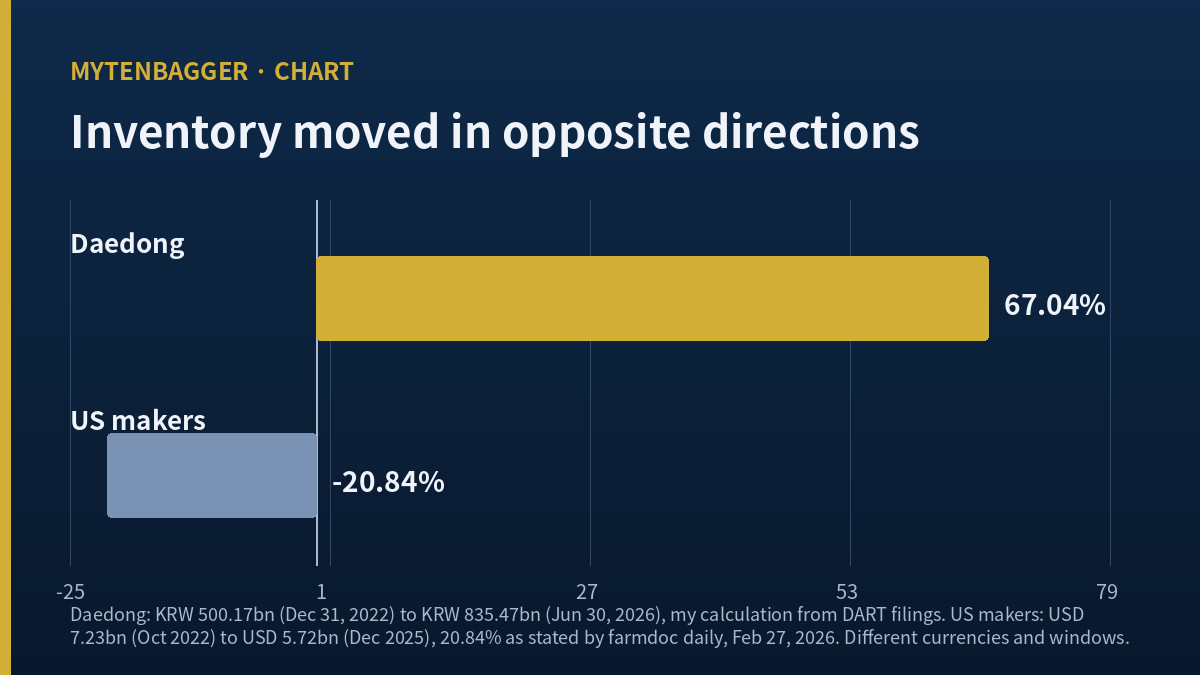
What I counted. Daedong stock is a KOSPI listing, and I opened it because of one line on the balance sheet rather than the income statement. Inventory stood at KRW 835.47 billion on June 30, 2026, against KRW 500.17 billion on December 31, 2022. That is growth of 67.04% (my calculation). Over the same stretch, US farm machinery manufacturers took their own inventories down from a peak of USD 7.23 billion in October 2022 to USD 5.72 billion in December 2025, a drop of 20.84%. One of these two lines is moving against its industry.
What it changes for me. Daedong’s annual revenue in 2025 was KRW 1,484.72 billion, which is 1.43% above its 2022 figure of KRW 1,463.74 billion (my calculation). So the extra KRW 335.30 billion of goods is not sitting behind a bigger sales line. I do not own the shares and I have not placed an order. What changed is the question I would ask management first: not how many tractors were sold, but how many are still on a floor somewhere.
KOSPI is the senior board of the Korea Exchange in Seoul, the tier that holds Samsung Electronics and Hyundai Motor; the junior board is KOSDAQ. Daedong trades on the senior board under the code 000490, and it is small even by KOSPI standards. On September 3, 2026 the shares closed at KRW 8,250, and against 28,824,242 shares outstanding that puts the market value at KRW 237.80 billion, or roughly USD 175 million. Deere’s market value on the same date was about 1,058 times that (my calculation, from the figures in the peer table below).
Contents
The line I opened first when I priced Daedong stock
I have a habit of reading manufacturers from revenue downward. With this one I went to the inventory line first, because the company had just posted a record quarter and I wanted to know what the record had left behind. Here is what the filings show. All figures come from Daedong’s audited annual reports and its half-year report filed with Korea’s DART electronic disclosure system, with the receipt number 20260814001489 for the most recent one.
| Balance sheet date | Inventory (KRW bn) | That year’s revenue (KRW bn) | Days of inventory |
|---|---|---|---|
| December 31, 2022 | 500.17 | 1,463.74 | 139.2 |
| December 31, 2023 | 638.72 | 1,433.39 | 226.6 |
| December 31, 2024 | 728.38 | 1,415.58 | 212.2 |
| December 31, 2025 | 749.19 | 1,484.72 | 207.1 |
| June 30, 2026 | 835.47 | not a full year | 162.8 |
Source: DART filings, consolidated basis, as of each balance sheet date. The days-of-inventory column divides closing inventory by that period’s single-quarter revenue and multiplies by 91, so the last row is measured against a strong quarter and the 2023 row against a weak one. That is exactly why I do not read the days column as a trend on its own.
Two things in that table pull in opposite directions, and I want both on the page. The inventory balance has risen in every one of the four annual observations, with no year of reduction. The days measure, though, has come down from 226.6 to 162.8 since 2023, because quarterly revenue grew faster than the balance did in the most recent period. A reader who wants the bullish reading can find it in the second column. A reader who wants my reading will look at the first.
Reading the same rows as year over year changes sharpens the point. Inventory rose 27.70% in 2023, 14.04% in 2024 and 2.86% in 2025, then 11.52% again in the six months to June 2026 (all four are my calculations from the balances above). Revenue over the matching annual periods went down 2.07%, down 1.24%, then up 4.88%. The largest build in the series, that 27.70% in 2023, landed in the year revenue fell fastest. The smallest build, 2.86% in 2025, landed in the year revenue grew. If a company were stocking to meet demand I would expect those two sequences to line up. They do the opposite where it counts: the two years revenue fell are the two years inventory grew fastest, and the year revenue grew fastest, 2025, is the year inventory grew least.
What I got wrong before I built that table
My first assumption was that a rising inventory balance at a Korean exporter is a working capital story: goods in transit, a shipping quarter that closed on the wrong side of a date. I dropped that assumption when I put the four December balances next to each other. Goods in transit swing a balance in both directions across years. These four moved one way, every year, through a period when the company’s own annual revenue barely moved. Whatever this is, it is not a timing artifact, and I would sooner show that reasoning than present the table as if I had known.
The US industry spent the same years going the other way
The comparison that made me keep the piece is not with Daedong’s own history. It is with the market it has been pushing into. Research published by the University of Illinois farmdoc group in February 2026 puts US farm machinery manufacturer inventories at a peak of USD 7.23 billion in October 2022, falling to USD 5.72 billion by December 2025 (farmdoc daily, February 27, 2026). The article states that decline as 20.84%. Working it back from the two rounded endpoints I get 20.89%, and I am flagging the 0.05 point gap so nobody thinks one of us mistyped: the source’s figure comes from unrounded data and mine does not.
The demand question sitting under all of this is not confined to machinery. Another Korean agriculture name covered on this site sells into the same farm economy from the other end of the field: NH Nongwoo Bio sells the seed that goes into the ground, and its own competitive worry is a rival claiming AI has halved the head start. Machinery and seed answer to the same planting decision.
The same research counts US combine sales falling from 7,349 units in 2023 to 3,579 in 2025, a decline of 51.30% (my calculation from the two published unit counts). It also reports that used tractor inventory fell for an eighth consecutive month, down 15.5% year over year in December 2025.
The producers say the same thing in their own words. CNH Industrial’s chief financial officer James Nickolas told analysts the company would “still be underproducing to the retail demand in order to reach our dealer inventory targets” (Manufacturing Dive, February 24, 2026). Underproducing on purpose is the opposite instruction to the one Daedong’s balance sheet has been following.
The scale of the retreat is worth stating in the producers’ own guidance. AGCO put 2026 total sales at USD 10.4 to 10.7 billion. CNH said roughly 40% of its 2024 net sales came from North America, which is why its production decision matters to the regional stock picture at all. And Deere’s manager of investor communications, Christopher Seibert, framed the year as a floor and not a further slide: “The developments over the past three months have strengthened our belief that 2026 marks the bottom of the current cycle.” All three statements are in the same February 2026 report. A company that agrees with Seibert would be right to carry stock into the turn. A company that does not would be carrying it into another year of the same.
I want to be careful about what this does and does not prove. Daedong’s inventory sits on Daedong’s balance sheet; the US figures cover American manufacturers, and a Korean maker building stock to supply a growing dealer network is doing something a US incumbent working off a glut would not do. Both can be rational. What I take from it is that the two positions carry different risk if the North American cycle stays where it is, and that difference is not visible anywhere in the revenue line.
Where Daedong stock sits against the makers it is chasing
I built this group from listed farm and construction equipment makers with North American exposure, and I am using two axes only: market value per unit of trailing revenue, and net margin. I am not converting currencies inside the table, because each row is priced in the currency of its own listing and forcing them into one unit adds an error I cannot check. Korean won is the reference currency for Daedong throughout this piece.
| Company | Market value | Revenue (TTM) | Value per unit of revenue | Net margin |
|---|---|---|---|---|
| Daedong (KOSPI 000490) | KRW 237.80bn | KRW 1,528.18bn | 0.156 | -2.00% |
| Deere & Co (DE) | USD 185.11bn | USD 47.93bn | 3.862 | 10.16% |
| Kubota (KUBTY) | USD 20.95bn | USD 20.02bn | 1.046 | 8.24% |
| CNH Industrial (CNH) | USD 16.95bn | USD 18.19bn | 0.932 | 1.71% |
| AGCO (AGCO) | USD 8.67bn | USD 10.35bn | 0.838 | 5.15% |
Peer figures from stockanalysis.com for Deere, AGCO, CNH Industrial and Kubota, all read on September 3, 2026, except the Kubota quote, which the page timestamped to the September 2 close. Both ratio columns are mine, calculated from the market value and revenue in each row. Daedong’s trailing revenue and trailing loss are my own sums of its four most recent reported quarters from DART, which is why the revenue figure differs slightly from vendor screens that use a different trailing window.
Three of the four peers sit between 0.8 and 1.1 times revenue. Daedong sits at 0.156, roughly a fifth of the cheapest of them on that measure, and it is the only row with a negative margin. The loose parts of this comparison, which I am listing instead of burying: the peers report in different fiscal calendars; Kubota’s quote is a day older than the rest; Daedong’s captive finance and parts businesses are not separated out the way Deere’s are; consolidated revenue at Daedong includes subsidiaries in which outside holders own a fifth of the equity; and none of these companies has an identical product mix to any other. The table is a size and margin comparison, not a valuation conclusion.
Put it the other way around. AGCO, the cheapest of the four peers on this measure at 0.838, is still priced at 5.37 times what Daedong is per unit of revenue (my calculation). A gap that wide usually means the market is paying for something other than sales volume, and the negative margin in the first row is the obvious candidate for what is missing.
One number from the group is worth pulling out because it dates the cycle. Deere’s fiscal 2025 revenue came in at USD 45.63 billion, down 11.46%, with earnings of USD 5.03 billion, down 29.20%. The largest company in this industry shrank by a ninth on the top line in its last completed year.
What Daedong stock actually did in August
The company reported second quarter results on August 10, 2026. Revenue for the quarter was a record, and Korean coverage noted it came in about 2.1% above the previous record set in the second quarter of 2022 (Herald Business, August 10, 2026, in Korean). Korean press also reported second quarter operating profit up 64.3% from a year earlier and first half revenue of KRW 844.81 billion with first half operating profit of KRW 47.25 billion (Etoday, August 10, 2026, in Korean). The market took it well. The September 3 close is 22.59% above the August 7 close, the last session before the report (my calculation).
That reaction is worth sitting with, because another Korean manufacturer covered on this site in late August posted an almost identical headline and got the opposite reception. Kyungdong Navien reported second quarter operating profit up 64.60% and the shares fell 11.30% in that session. Two Korean manufacturers, two beats of almost the same size in the same August week, two opposite prints. I do not have a theory that covers both, and I am not going to invent one. What I noted for myself is that a beat is an input to price, not a synonym for it.
Momentum, for the record and as of the September 3, 2026 close: up 24.62% over one month, up 1.85% over three months, down 21.50% over six months, down 20.60% over twelve. The twenty day moving average was KRW 7,812 and the sixty day was KRW 7,296. A stock that is up a quarter in a month and down a fifth in a year is telling you the August move was a level change, not a trend.
How a US reader would reach Daedong stock, and what I checked
There is no US-listed depositary line for this company that I could find, so the shares are reachable only through a broker that offers direct Korea Exchange access, and settlement, tax withholding and the investor registration requirements of the Korean market all apply. I did not verify whether the company appears in the broad Korea country funds, and I am saying so instead of guessing.
What I did check is who already holds it. Foreign ownership stood at 2.76% on September 3, 2026, against 3.16% of shares outstanding financed on margin. A foreign holding under 3% tells a foreign buyer two things at once: there is little foreign positioning to be squeezed out, and there is also almost nobody abroad who has done this work before you. I found one data oddity while checking: the free float count on my screen, 28,827,000, is slightly larger than the shares outstanding count of 28,824,242 on the same screen. Free float cannot exceed shares outstanding, so at least one of those two numbers is rounded or stale, and I used the shares outstanding figure everywhere in this piece.
The case against what I have written
Split by when each item can be settled. The first group is already true today; the second group turns on Daedong’s third quarter report, whose statutory filing deadline is November 16, 2026; the third group will not resolve inside this year.
Already true
- Inventory rose in every annual observation from 2022 through 2025 and again in the first half of 2026, with no year of reduction (DART filings).
- The days-of-inventory measure has improved from 226.6 to 162.8 since 2023, which is the strongest single argument against my framing, and it comes from the same table I built.
- Consolidated leverage was 237.61% of equity at June 30, 2026. A company holding this much stock with this much debt has less room to wait out a slow selling season than one holding the same stock with no debt.
- Trailing net margin is negative at 2.00%, on my own sum of the four most recent reported quarters.
- No sell-side estimate exists that I could locate. The WiseReport consensus screen displays no forecast, and the analyst section of the Investing.com page returned “currently not supported” when I read it on September 3, 2026. This piece therefore contains no broker forecast, and that is an absence in the data rather than an omission in my research.
- That same Investing.com page was showing a stale quote when I read it, three weeks behind the market. I did not take any per share figure from it.
Settled by the third quarter report
- Whether the inventory balance falls for the first time in this series. A fall would be the cleanest evidence that I have read a build as a problem when it was a plan.
- Whether the record second quarter margin holds into a seasonally different quarter.
- Whether the split between goods held in Korea and goods held with overseas distributors is disclosed. Without it, I cannot tell whether the build sits in factories or in dealer yards, and those are different risks.
Not settled this year
- North American demand. If the cycle turns, a maker that kept building has product ready and the destockers do not, which reverses the whole reading above.
- The company’s own long range plan, presented at a group investor day on May 20, 2026, targets 2030 revenue of KRW 3,590 billion at a 10.55% operating margin. I record it as the company’s target and use it as evidence of nothing.
What would make me wrong about Daedong stock
I hold no position. Both conditions below are settled by statutory filings, not by anything the company chooses to put in a press release, which is the point of writing them this way.
Condition one, and it is a soft one. If the inventory balance in the third quarter 2026 report is below the KRW 835.47 billion recorded at June 30, 2026, my framing loses its main support. I call it soft because a single quarterly decline in one working capital line is not proof of a policy change, and I would want the following quarter before treating it as one. If it fires, I stop asking about the balance sheet and go back to the segment revenue disclosure.
Condition two, and it is a hard one. If the 2026 annual report shows full year revenue above KRW 1,600 billion, that is 7.76% above the 2025 figure of KRW 1,484.72 billion (my calculation), and it breaks the flat revenue half of my argument outright. Half year revenue of KRW 844.81 billion means the second half would need KRW 755.19 billion, which is 89.39% of the first half (my calculation). If it fires, I rebuild the peer table on growth rather than on size, and the inventory build reads as capacity for demand that arrived.
Both conditions expire with the 2026 annual report, due in March 2027. If either cannot be judged at that point because the disclosure is not granular enough, I will record it as undetermined and say so, and I will keep that outcome separate from a condition that simply failed to fire.
Related reading: in an earlier piece
Prices and multiples reflect the September 3, 2026 close as read at the time of writing. Korean won is the reference currency; the one USD figure given for Daedong’s market value is approximate, converted at roughly KRW 1,359 per dollar, the Seoul close on that same date. Peer figures are shown in each company’s own listing currency and are not converted. Every ratio described as my calculation is a derived value I computed from the reported figures cited beside it.