Hanwha Corp Stock And The Equity That Is Not Its Own
Hanwha Corp stock closed at $101.77 on September 15, 2026, and the balance sheet that price is measured against is much smaller than the one the consolidated statements print. Start from the total and take things away. Consolidated equity at the end of 2025 was KRW 48.4 trillion, roughly $35.96 billion. Subtract the KRW 36.6 trillion, about $27.17 billion, that belongs to minority holders of the subsidiaries and KRW 11.8 trillion is what was left for the owners of the parent.
That subtraction removes three quarters of the number. I have looked at plenty of holding companies where the minority line takes a slice; I had not seen one where it takes 75.56 percent. The second half of this piece is the part I found harder to accept: by the middle of 2026 that residual share had fallen again, and not because the group shrank.
Hanwha Corp trades on the Korea Exchange under code 000880. KOSPI is the senior of Korea’s two boards, the one that carries Samsung Electronics and Hyundai Motor, and this company sits inside it as the top holding entity of a group whose listed pieces are better known than the parent. I do not own the shares and I have no order working. What follows is how I arrived at that position.
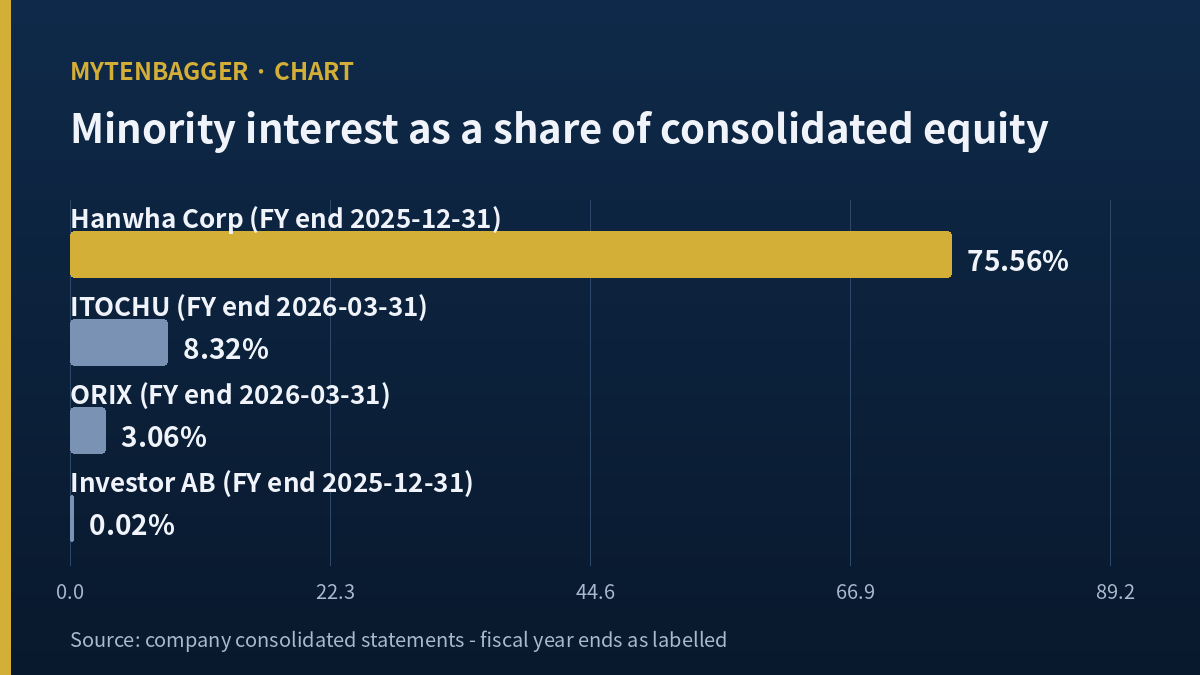
Minority interest as a share of consolidated equity
Hanwha Corp 75.56%
ITOCHU 8.32%
ORIX 3.06%
Investor AB 0.02%
Contents
What Hanwha Corp Stock Is Measured Against
The starting figures come from a Samsung Securities note dated May 18, 2026, which prints a balance sheet summary for the group. Total equity for 2025 is KRW 48,435 billion. Non-controlling interests are KRW 36,595 billion. The difference, KRW 11,840 billion, is equity attributable to the owners of the parent, and I obtained it by subtraction. It is not printed anywhere I could reach. That distinction matters enough that I have put it in the list of things that could be wrong.
The arithmetic of the ratio is simple: 36,595 divided by 48,435 is 75.555 percent, which I round to 75.56. The complement, 24.44 percent, is the fraction of consolidated book equity that a Hanwha Corp shareholder has any claim on.
Why so extreme? Because the group’s largest pieces are themselves listed, and the parent owns less than half of each. The same Samsung Securities note lists 32.2 percent of Hanwha Aerospace, 36.3 percent of Hanwha Solutions and 43.2 percent of Hanwha Life. Consolidation pulls one hundred percent of each subsidiary’s balance sheet onto the parent’s statements and then books everything above the ownership stake as somebody else’s. When every major stake sits below one half, the minority line swells until it dwarfs the parent’s own.
The Line That Splits A KRW 48.4 Trillion Balance Sheet
I wanted to check the 2025 split against a more recent date, so I went to the June 2026 balance sheet. Total assets were KRW 306.5 trillion and total liabilities KRW 251.6 trillion, which leaves KRW 54.9 trillion of total equity by subtraction. The screen I used did not render the equity section at all, so the split between parent and minority is not directly available for that date.
A cross check that the subtraction survived
Before leaning any weight on a subtracted figure I tested it against an independent source. Taking liabilities over my subtracted equity gives a debt to equity ratio of 531.77 percent for 2023, 534.11 percent for 2024 and 497.35 percent for 2025. A Korea Economic Daily financial summary page prints exactly those three values to two decimal places. Two sites that do not share a data feed agreeing to the second decimal is about as much confirmation as a subtraction can get. The June 2026 figure of 458.35 percent has no such partner, so it stays labeled as mine.
Hanwha Corp Stock And A Book That Shrank Faster Than The Share Count
Book value per share on the Korean market data screen is KRW 133,067. Against the September 15, 2026 close that gives a price to book of 1.03 by my division. Multiply that book value per share by the shares outstanding and the equity attributable to parent shareholders comes to roughly KRW 7.10 trillion, about $5.27 billion. The same result arrives from the other direction: market capitalization of about $5.43 billion divided by 1.03 lands within a rounding step of the same number.
Now compare. At the end of 2025 the attributable figure was KRW 11.8 trillion. By the middle of 2026 it implies KRW 7.10 trillion. That is a fall of 40.1 percent. Over the same stretch, total consolidated equity went the other way, from KRW 48.4 trillion to KRW 54.9 trillion.
The cause is a corporate split executed on August 1, 2026, which moved a set of businesses into a newly created holding entity that relisted on August 25, 2026. The share count of the surviving company fell by 24.4 percent in that transaction. So the parent’s book fell by roughly forty percent while its share count fell by roughly a quarter, and book value per share had to drop as a result.
Run the ownership ratio again on the later date and it is worse than the 2025 figure. KRW 7.10 trillion out of KRW 54.9 trillion is 12.93 percent. I want to be careful here, because that 12.93 percent stacks one derived number on another: book value per share whose reporting date the screen does not state, multiplied by a share count, divided by an equity figure I obtained by subtracting liabilities from assets. It is the weakest calculation in this piece and I am flagging it as such instead of burying it.
One Column, Four Holding Companies
To know whether 75.56 percent is unusual I needed companies built the same way: entities whose reason for existing is to hold other businesses. I picked three and pulled one line from each, the minority interest figure on the most recent audited balance sheet, and divided it by that company’s total equity. One column, nothing else, with each company’s fiscal year end printed next to it so the dates cannot quietly drift.
| Company | Balance sheet date | Minority interest / total equity |
|---|---|---|
| Hanwha Corp (KOSPI 000880) | December 31, 2025 | 75.56% |
| ITOCHU (TYO 8001) | March 31, 2026 | 8.32% |
| ORIX (TYO 8591) | March 31, 2026 | 3.06% |
| Investor AB (STO INVE.B) | December 31, 2025 | 0.02% |
ITOCHU is the closest of the three and it is still nine times smaller: 75.56 divided by 8.32 is 9.08. Investor AB sits at the far end, and the reason is structural, since it either owns its listed holdings outright through its own account or carries them as investments instead of consolidating them line by line. That is a different way of being a holding company, and it produces a balance sheet where almost everything on the equity side belongs to the shareholders reading it.
I am not claiming ITOCHU or ORIX are comparable businesses. A Japanese trading house and a Japanese financial services group do not sell what this company sells. The column is not about business overlap. It is about how much of a consolidated equity base a holding company’s own shareholders end up owning, and on that one question the four companies are directly comparable while their reporting dates differ by one quarter.
Why price to book is missing from that table
My first version of the table had a second column with each peer’s price to book, and I deleted it. Here is what happened when I checked the figures.
Investor AB’s statistics page shows a price to book of 1.06, a market capitalization of SEK 886.97 billion and equity of SEK 840.30 billion, but its own quote page shows a share price of SEK 402.55 and a market capitalization of SEK 1.23 trillion. Those two pages cannot both be current. Dividing the quoted price by the balance sheet book value per share of SEK 311.33 gives about 1.29, which is neither figure. ORIX shows a price to book of 1.38 while its quoted price over its stated book value per share gives 1.43. ITOCHU shows 2.20 while the same division gives 2.42.
In every case the published ratio and the inputs printed beside it are from different moments. I can use those ratios as rough indications of where the market prices each company, and I cannot put them in a table next to a figure of 1.03 that I calculated myself from a specific closing price on a specific day. Mixing a number I built from a known date with three numbers whose date I cannot pin down would make the table look more precise than it is. So the table has one column, and this section is the record of the column that did not survive.
Hanwha Corp Stock From A US Brokerage Account
There is no American depositary receipt for this company, so a US investor reaching it directly needs a broker with Korea Exchange access and a won cash balance, and the fill will come during Seoul trading hours. The indirect routes are Korea country funds, where a holding company of this size shows up as a small weight well behind the group’s own listed subsidiaries. That is the arrangement worth pausing on: the same US fund that holds a sliver of the parent will hold larger positions in the aerospace and insurance arms whose balance sheets make up the minority line discussed above. The exposure arrives twice, in different proportions, through the same wrapper.
I looked at how the group’s other pieces have priced this year while writing this. In the Hanwha Solutions piece the question was what the company actually sells once a tax credit is removed from the income statement, which is a question about one operating business. Here the operating businesses are somebody else’s on the equity line, and the question is what remains after the ownership split.
Korean holding companies are usually valued by stacking up the market value of the listed stakes and comparing that total with the parent’s market capitalization. I have used that method myself on Samsung C&T, where the stakes came to roughly twice the market capitalization. This piece deliberately does not use it. Market value of stakes and attributable book equity answer different questions and can point opposite ways on the same company, and I am not adjudicating between them here.
The nearest structural parallel in what I have written is Hanjin KAL, where I asked what the holding entity itself had earned from operations over four years. That was an income question. This is a balance sheet question, and the two can disagree: an entity can consolidate enormous operating profit while owning a small share of the capital that produced it.
Numbers I Did Not Use
The net asset value discount
Brokerage notes on this company all compute a discount to net asset value, and the published figures disagree widely depending on the house and the date the note carries. The spread comes from different asset lists and different treatments of net debt, and the market did not move that much in between. A gap that wide, built on stake percentages that themselves disagree across sources, is not something I can stand on, so no discount figure carries any weight in this piece.
The subsidiary ownership table
I wanted to list every listed subsidiary with the parent’s stake beside it. The sources would not line up. Hanwha Solutions appears at 36.2, 36.3 and 36.7 percent across three documents. The company’s own ownership diagram reads as 47.2 percent for Hanwha Systems while press reporting describes Hanwha Aerospace as that company’s largest shareholder with 59.54 percent, which means the diagram is mixing direct and indirect holdings without saying which is which. Three stakes from one dated brokerage note made it into the text above; the full table did not get built.
One thing I checked that did hold
The two share count reductions of 2026 reconcile exactly. Starting from the count before the April cancellation, subtracting the canceled shares and then subtracting the shares removed in the August split lands on the current count with nothing left over. I did that subtraction before using any per share figure, and it is the reason I am willing to use book value per share at all. The detail belongs to the Korean piece, which is built on the per share side.

Where I Stand On Hanwha Corp Stock
No position, no order, watching. The reason is narrow and I will state it as one sentence: I cannot say what a price to book of 1.03 describes when the equity figure underneath that ratio is 12.93 percent of the balance sheet on one calculation and 24.44 percent on another, six months apart, with a corporate reorganization sitting between them.
The condition that would change that is specific. If the minority share of consolidated equity falls below half, then a price to book computed on this company starts describing most of the balance sheet instead of a corner of it, and the ratio becomes something I can argue about. That would require the parent to move above fifty percent on its major listed stakes, or for those stakes to stop being consolidated, and neither is a small event. A secondary condition: if the June 2026 equity section becomes readable with the parent and minority lines separated, the 12.93 percent stops being my stacked estimate and becomes a reported figure, and I would revise this piece on that alone.
The argument against me is real and I want it stated plainly. Reporting after the August relisting noted that the discount to net asset value widened instead of narrowing, which is the opposite of what a structural simplification is supposed to do. A Korean broker quoted in September raised the possibility that the outcome of the split ends up serving control of the group more than it serves outside holders. If that reading is right, then the ownership ratio I am waiting on may improve without the price responding at all, and my condition would be satisfied while my thesis still failed.
Twenty One Ways I Could Be Wrong About Hanwha Corp Stock
- The number this piece rests on, equity attributable to the parent, was never read off a statement. I subtracted minority interest from total equity. If the note’s two figures use different scopes, everything downstream moves.
- Both 2025 equity figures come from a brokerage summary table and not from the audited filing itself. I did not open the annual report.
- The 12.93 percent for mid 2026 is a derived figure standing on two other derived figures, and I would not defend it to the second decimal.
- Book value per share of KRW 133,067 carries no reporting date on the screen that publishes it. I assumed the June 2026 balance sheet and did not confirm it.
- Total equity for June 2026 came from subtracting liabilities from assets because the equity section did not render. The debt to equity cross check validated the method on three earlier years and says nothing about this one.
- Price to book of 1.03 is my own division at one closing price. The vendor screen publishes a different figure computed on the previous session.
- Market capitalization in dollars is a conversion of a won figure at a single rate on a single day.
- The ownership stakes of 32.2, 36.3 and 43.2 percent are from a note dated before the August reorganization and may no longer hold.
- I treated minority interest as a single line. It aggregates outside holders across many subsidiaries with different economics, and some of those subsidiaries are financial companies whose equity behaves nothing like an industrial one.
- Insurance subsidiaries carry large balance sheets relative to their earnings power. A ratio built on consolidated equity will flatter or penalise a group depending on how much insurance is inside it, and I did not adjust for that.
- The three peers report under accounting frameworks that treat control and consolidation thresholds differently. IFRS applies to the Korean and Japanese names here, which narrows but does not close the gap.
- Two peer balance sheets end in March and two end in December. A quarter of drift sits inside the comparison.
- Investor AB’s low figure partly reflects a different holding structure, so reading it as the opposite end of one spectrum overstates how comparable the two companies are.
- The peer minority interest figures come from a single data aggregator. I did not open any of the three companies’ own filings.
- I dropped price to book from the peer table because the published ratios did not reproduce from the inputs beside them. It is possible the ratios are correct and the inputs on those pages are the stale part.
- The 40.1 percent fall in attributable book compares a year end figure with a mid year estimate, and ordinary earnings and distributions happened in between. Not all of that fall is the reorganization.
- The 24.4 percent share count reduction is reported by press coverage of the relisting, and I did not take it from the filing.
- I did not confirm how much treasury stock the company holds, which affects any per share figure I used.
- Reporting on the reorganization indicates that the entire borrowing base stayed with the surviving entity while the new entity started with almost none. I kept those figures out of the argument, which does not mean they do not bear on it.
- A governance body published a detailed objection to the split ratio and to the board’s independence in January 2026. I have no material that answers those objections.
- Choosing the ownership line as the axis of this piece was a choice, and it was available to me mainly because the numbers were obtainable. Building the same analysis on net asset value or on stake by stake market values would have produced a different conclusion, and I abandoned both of those paths for lack of verified inputs.
What A Consolidated Balance Sheet Taught Me This Week
A consolidated balance sheet is the first thing I open on any group, and until this week I read the totals as a description of size. Assets this large, equity that large, and I would form an impression of how big a thing I was looking at before going anywhere near the price. That was a misreading of what the totals mean, and the misreading is specifically about ownership, and scale has nothing to do with it.
Consolidation is a statement about control, not about ownership. It says the parent directs these businesses, so their assets and liabilities appear in full. It says nothing about how much of the resulting equity the parent’s own shareholders hold, and the line that answers that question sits several rows lower, formatted like a footnote. On this company the footnote is three times the size of the number above it.
So I changed a step. Before I write down any equity figure for a group, I now write down what fraction of it is attributable to the parent, on the same line, in the same note. If I cannot find that fraction I write that I could not find it. It costs one line and it stops me from carrying an impression of size into a judgment about value, which is exactly what I did here for the first half hour.
Prices and ratios reflect the September 15, 2026 close as checked at the time of writing. Dollar figures are approximate conversions at KRW 1,347.10 per dollar, the rate for September 14, 2026, and the Korean won is the reference currency throughout. Balance sheet data is drawn from the sources linked here, including ITOCHU, ORIX and Investor AB balance sheets, Investor AB’s own reporting, the Korea Economic Daily market pages, Digital Times coverage of the relisting, Bloter on the post split borrowing base, and The Economy on the discount after relisting. Korean language sources are cited as reported by the Korean press; quoted figures are translated summaries and not direct English quotations.