GS Holdings Stock Sits on Four Book Values That Do Not Agree
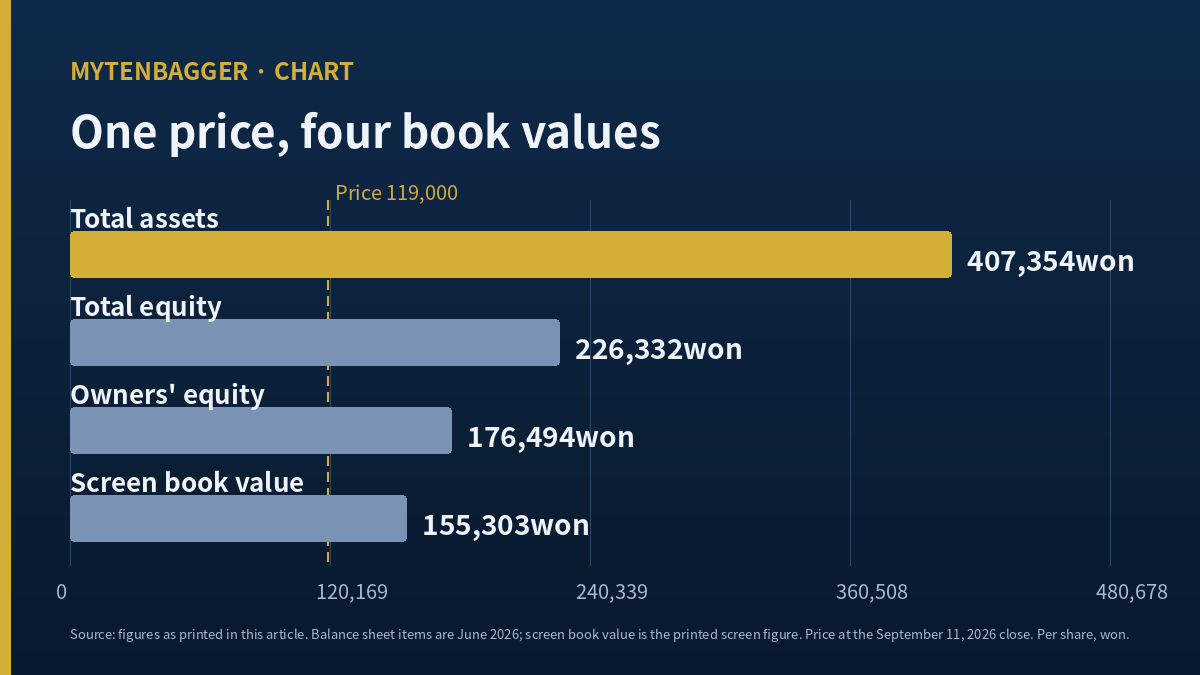
Four numbers came out of the same division. I took one closing price for GS Holdings stock and divided it, in turn, by four different measures of what a share of this company owns. The answers were 0.2921, 0.5258, 0.6742 and 0.7662. Every one of the four is defensible. Only one of them is printed anywhere, and it happens to be the most generous of the set.
The price is 119,000 won at the September 11, 2026 close on the Korean exchange, roughly 89 US dollars. I hold no position in this company and I have no order working. What follows is arithmetic on published figures, done because a single printed ratio stopped looking like a fact to me halfway through the afternoon.

Contents
Six lines of GS Holdings stock before anything else
*  Total assets per share ........ 407,354 won   price / this = 0.2921
*  Total equity per share ........ 226,332 won   price / this = 0.5258
*  Owners' equity per share ...... 176,494 won   price / this = 0.6742
*  Screen book value per share ... 155,303 won   price / this = 0.7662
*  Implied by that screen figure . 14,427.0 bn won of equity, matching no published line
*  Non-controlling interests ..... 4,629.76 bn won, which is 22.02 percent of total equity
The first four lines all divide the same 119,000 won. The spread between the narrowest and the widest reading is a factor of 2.62 by my calculation. That is not a rounding disagreement. It is four different answers to the question of what a shareholder actually stands behind.
GS Holdings stock has four book values
Start with the balance sheet as published for the period ended June 2026. Total assets are 37,841.35 billion won. Total liabilities are 16,816.13 billion won. Subtracting gives total equity of 21,025.22 billion won, and of that, 16,395.46 billion won belongs to the owners of the parent. The remainder, 4,629.76 billion won by my subtraction, belongs to outside shareholders of the consolidated subsidiaries.
The share count is 92,895,495. That number is worth pausing on, because it closes exactly. The company was capitalized at 92,915,378 shares when it listed in August 2004, and the only movement since then is a single profit cancellation of 19,883 shares dated May 29, 2026. Subtract one from the other and you land on the current count with nothing left over. Twenty two years of corporate life and the share register moved by 0.0214 percent, by my calculation. I check for share count events on every name I write about, and this is the smallest one I have found.
| What is being divided | Per share (won) | Price divided by it | Who it belongs to |
|---|---|---|---|
| Total assets | 407,354 | 0.2921 | Owners and lenders together |
| Total equity | 226,332 | 0.5258 | Parent owners and outside holders |
| Owners’ equity | 176,494 | 0.6742 | Parent owners only |
| Screen book value | 155,303 | 0.7662 | Undetermined |
Every figure in the middle column except the last is my own division, and the fourth column is where the interest lies. The first three rows describe progressively narrower claims and produce progressively higher ratios, which is exactly what you would expect. The fourth row breaks the pattern by being the highest of all while I cannot say what it measures.
Multiply the printed 155,303 won by the share count and you get 14,427.0 billion won of implied equity. I went looking for that line and did not find it.
What 155,303 won would need to be true
Owners’ equity at the December 2025 balance sheet date was 14,703.32 billion won. A year earlier it was 14,076.81 billion won. The implied 14,427.0 billion won sits between those two and equals neither, and it is well below the June 2026 figure of 16,395.46 billion won. Running the arithmetic the other way is no better: dividing December 2025 owners’ equity by 155,303 won implies about 94.67 million shares, and dividing the December 2024 figure by the same number implies about 90.64 million. Neither is the share register.
I can think of three explanations and cannot confirm any of them. The vendor may be carrying a parent-only balance sheet instead of the consolidated one, which for a holding company would plausibly land lower. It may be netting treasury shares I cannot see. Or the figure may simply be stale. What I will not do is quote a price to book of 0.77 as though I know what sits underneath it. That ratio appears in this piece as an object of study; I am not using it as a measurement.
Where GS Holdings stock keeps the other 22 percent
The gap between the second and third rows of my table is the whole story of what a Korean holding company is. Total equity of 21,025.22 billion won includes 4,629.76 billion won that belongs to people who own shares in the subsidiaries themselves. That is 22.02 percent of the consolidated capital base by my calculation, and a shareholder in the listed parent has no claim on it.
This company consolidates a convenience store operator, two power generators and a trading arm, holding somewhere between half and nine tenths of each. Every won of those subsidiaries’ assets appears in the 37,841.35 billion won total, and roughly a fifth of the equity underneath those assets belongs to somebody else. Anyone who divides the asset total by the share count, as I did in the first row, is measuring a claim that does not exist in law.
I have run into the same arrangement in Korean utilities before. When I looked at the state gas utility, the number that mattered was an unpaid receivable that dwarfed the market value of the equity, and the lesson there was the same one as here: the consolidated total and the shareholder’s claim are two separate quantities that happen to be printed on the same page. That piece is Korea Gas Stock Carries a Receivable Four Times Its Value, and the receivable arithmetic there is the closest cousin to this one I have written.
Four and a half years on one side of the sheet
I pulled the balance sheet back to December 2022 to see how the equity got where it is.
| Period | Assets (bn won) | Liabilities | Total equity | Owners’ equity | Debt ratio |
|---|---|---|---|---|---|
| Dec 2022 | 33,922.24 | 17,434.43 | 16,487.81 | 12,438.58 | 105.74% |
| Dec 2023 | 34,448.42 | 16,823.23 | 17,625.19 | 13,450.00 | 95.45% |
| Dec 2024 | 35,063.39 | 16,593.04 | 18,470.35 | 14,076.81 | 89.84% |
| Dec 2025 | 35,707.91 | 16,513.79 | 19,194.12 | 14,703.32 | 86.04% |
| Jun 2026 | 37,841.35 | 16,816.13 | 21,025.22 | 16,395.46 | 79.98% |
The total equity and debt ratio columns are mine, derived by subtraction and division from the published asset and liability lines. The first thing I noticed is a coincidence, and I do not read any mechanism into it: assets grew by 3,919.11 billion won over the four and a half years, and owners’ equity grew by 3,956.88 billion won. Those two increases are 37.77 billion won apart, a difference of 0.96 percent. For practical purposes, everything the balance sheet gained went to the parent’s shareholders.
The liabilities did almost none of the falling
The debt ratio dropped 25.76 percentage points across that span, from 105.74 percent to 79.98 percent. That reads like deleveraging, so I split the movement into its two causes.
Hold liabilities at the December 2022 level and let only the capital base grow, and the ratio lands at 82.92 percent, a fall of 22.82 points. Hold the capital base still and let only liabilities move, and the ratio lands at 101.99 percent, a fall of 3.75 points. The capital side did 88.58 percent of the work, by my calculation. Liabilities themselves shrank by 3.55 percent over four and a half years while the capital base grew 27.52 percent.
Nothing here is misconduct. Retaining earnings is how a balance sheet is supposed to improve. But a screener that ranks Korean names on falling debt ratios will surface this company for a reason that has almost nothing to do with debt, and I would rather know which of the two moved before I use the ratio as evidence of anything.
A printed ratio I never treated as arithmetic
A printed ratio is the thing I want to record about my own process here. For years I have copied price to book off vendor screens the way I copy a closing price. I treated it as a reading and never once as a calculation. I check earnings per share against net income. I check market value against shares times price. I had never once multiplied a book value per share by a share count to see whether the product appears on a balance sheet.
I did it this time only because the equity line had jumped 1,692.14 billion won in six months, up 11.51 percent, and I wanted to see the ratio move with it. It did not move the way I expected, and that is what sent me to the multiplication. The practice I am changing is narrow and specific: from now on, any book value per share I intend to quote gets multiplied by the share count first, and if the product does not appear as an equity line I say so in the piece instead of quoting the ratio bare.
Chevron owns the other half of the refiner
Most of this holding company’s profit arrives from a refiner it holds exactly half of. The other half belongs to Chevron. That makes the American company an unusually clean comparison: two listed parents standing over the same physical assets, reporting under different regimes, priced by different markets.
Chevron closed at 214.06 US dollars on September 11, 2026, the same date as my Korean price. Its balance sheet for the twelve months to June 2026 shows total assets of 330,135 million dollars, total liabilities of 134,577 million, and shareholders’ equity of 195,558 million. Shares outstanding are 1,962 million and the screen book value per share is 96.80 dollars. Those figures come from the Chevron balance sheet summary at StockAnalysis.
Four questions, two answers each
Q. Does the price clear total assets per share?
   Korean parent  no, 0.2921        Chevron  yes, 1.2722

Q. Does the price clear equity divided by shares?
   Korean parent  no, 0.5258        Chevron  yes, 2.1476

Q. Does the price clear the screen book value?
   Korean parent  no, 0.7662        Chevron  yes, 2.2114

Q. Do the screen book value and equity over shares agree?
   Korean parent  no, no match      Chevron  no, 2.97 percent apart
The first three rows split cleanly. Every reading on the Korean side sits below one and every reading on the American side sits above it. The most generous Korean figure, 0.7662, is 60.23 percent of the least generous Chevron figure, 1.2722, by my calculation.
The fourth row is the one I did not expect. Chevron’s equity divided by its share count is 99.67 dollars, and its printed book value per share is 96.80. Those are 2.97 percent apart. The defect I found on the Korean screen is present, in smaller size, on the American one. Whatever convention the vendors are applying, they are applying it on both sides of the Pacific, and it means the fourth row of my table is the weakest of the four on both companies.
What GS Holdings stock costs against Chevron’s book
Converted at 1,341.59 won per dollar, the September 11, 2026 rate, total assets of 37,841.35 billion won come to about 28.2 billion dollars and owners’ equity comes to about 12.2 billion dollars. Chevron’s asset base is about 11.7 times the Korean parent’s, by my calculation.
Total assets per share of 407,354 won convert to roughly 304 dollars against a share price of roughly 89. On the Chevron side the same pair reads 168.26 dollars of assets per share against a price of 214.06. The Korean shareholder is standing behind more balance sheet per unit of price and receiving, in exchange, a claim diluted by outside holders of the subsidiaries and a profit stream that arrives through a stake the parent does not consolidate.
I would not call that mispricing. I would call it a different security wearing the same label. A Korean refiner I looked at earlier this year had the cleaner version of the problem, where a single quarter’s operating profit was roughly half inventory revaluation and the underlying business was much smaller than the headline: I wrote that up as South Korean Refiner S-Oil Put 9.26 Trillion Into a Losing Unit. The comparison worth holding is that the refiner shows you its own balance sheet, while a holding company shows you a consolidation that omits its largest profit source.
Related reading: SK Innovation Stock Rose 37% in a Month
Numbers I left out of GS Holdings stock
The shareholder register shows the founding family and 55 related parties holding 47,788,107 shares, or 51.44 percent, with the national pension fund at 6,872,930 shares and 7.40 percent, and free float at 43,542,388 shares and 46.87 percent. Those percentages add up in a way that tells me the screen is treating treasury holdings as zero after the May cancellation, but I could not confirm a treasury line independently, so I have kept the register out of the argument and reported it here only as context.
I also left out every earnings figure. This piece divides a balance sheet; the profit side of this company has its own arithmetic and its own problem, and mixing the two would have let me reach for whichever measure flattered the conclusion. A separate Korean-language piece I published the same day handles the income statement.
Three ways this reading fails
- Everything rests on one date and one screen. All four ratios use the June 2026 balance sheet, and the fourth uses a vendor figure whose implied equity of 14,427.0 billion won matches no published line. If that vendor is running a parent-only balance sheet, then three of my four figures stand and the fourth is measuring a different entity, which would make my table a comparison of three things and a stranger.
- The comparison has the same weakness on both sides. Chevron’s screen book value and its equity over shares are 2.97 percent apart. I used that gap as a finding, but a reader could just as fairly say it shows my method is picking up a vendor convention and saying nothing about either company.
- No new fact appears here. Every input is a published line or a rate anyone can look up. The four answers are four divisions I performed. If the arithmetic is the contribution, then the contribution is small, and I would rather say so than let the length of the piece imply otherwise.
Which sentence dies first
I am not holding this and I have no order working. I am also not going to build a position on a ratio I cannot reconstruct. So instead of listing what would prove me wrong, I have written down which sentence in this piece stops being usable when a specific fact arrives.
- If the half-year filing states owners’ equity alongside the share count the vendor is using, the paragraph about not being able to rebuild 155,303 won dies immediately. Not corrected, deleted. The interesting thing about that figure is precisely that I cannot source it, and a source removes the interest along with the doubt.
- If the outside shareholders’ stake moves materially, through a subsidiary buyback or a stake purchase, the 22.02 percent line and the gap between my second and third rows both need recalculating, and the sentence claiming a fifth of the capital base sits outside the parent’s claim becomes a statement about a date instead of a statement about the company.
What survives either event is the first row, the 0.2921. That one needs only an asset total and a share count, both of which are audited and both of which will still be printed next quarter. I have hung the durable part of this piece on the crudest of the four numbers on purpose.
Prices and balance sheet figures reflect the September 11, 2026 close, checked at the time of writing on the morning of September 14, 2026 Korea time, when the most recent trading day was Friday the eleventh. Korean won is the reference currency throughout and dollar conversions are approximate, at roughly 1,341.59 won per dollar on that same date. Annual figures for 2025 and earlier appear in Insight’s Korean-language results coverage and dividend history in Consumer News; both are Korean press and I am paraphrasing throughout. Anything labeled as my calculation is a division I performed on published lines.