What DN Automotive Stock Owes: The 2022 Machine Tool Bill
DN Automotive stock gives its holder full ownership of a business that has no price anywhere. That business is DN Solutions, a machine tool maker in Changwon, and by one Korean trade account it produces about sixty percent of the group revenue. It has never listed. It tried, and it stopped. So when I open a screen and see a single number for this company, I am looking at a quote for two things at once, only one of which the market has ever been asked to price separately. I decided the honest way into that was to count what the parent borrowed to buy the unpriced half, and what is left of it.
- OWNS a machine tool maker that ranked third worldwide by 2023 sales and carries no quote of its own.
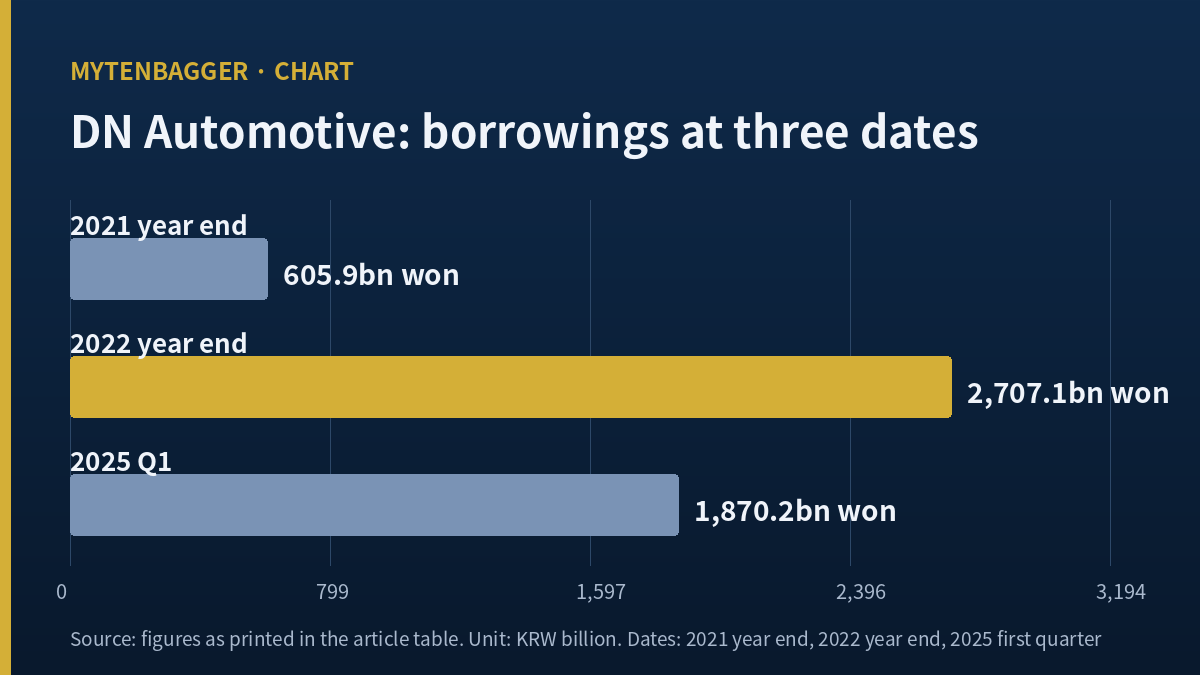
- OWES borrowings that ran from KRW 605.9 billion at the 2021 year end to KRW 2,707.1 billion twelve months later.
- PAYS interest on what is left. I hold none of DN Automotive stock and I am watching from outside.
Contents
What DN Automotive Stock Bought in January 2022
In January 2022 the company then known as DTR Automotive bought Doosan Machine Tools and renamed it DN Solutions. The price, per a Korean trade outlet writing on 22 July 2025, was about KRW 2,095 billion, which at the exchange rate I use below comes to roughly USD 1,520.8 million. The buyer was an anti vibration parts maker with a lead acid battery arm. It was buying a capital goods business several times its own weight.
It is worth saying what the buyer was before it became a capital goods holding company. The parent began in Busan in 1971 as a tire manufacturer, moved into dustproof components in 1992 and into automotive batteries in 1999, and commercialized the first active mount in 2005, an electronically controlled part that cancels engine vibration. It had already bought across borders twice, taking Avon Automotive in Britain in 2009 and CF Goma in Italy in 2014. By 2023 it employed 1,142 people and ranked as the largest supplier of anti vibration components to General Motors and Stellantis, third largest in the world in that category, with Tesla, Rivian and Nio also on its customer list.
I read that history as the thing that makes the 2022 purchase legible. A company that had digested two foreign acquisitions in thirteen years reached for a third that was several times larger than either, and it did so with borrowed money. Whether that was nerve or overreach is exactly what the next three numbers decide.
I want to be exact about what kind of source that is. It is a Korean financial trade outlet. It is not a filing. I could not open the acquisition disclosure itself. Everything in the next section rests on that one account, and if it is wrong, the section is wrong with it.
Cash, Hybrid Notes, and Borrowings
The same account splits the funding three ways. Own cash of KRW 450 billion, roughly USD 326.7 million. Perpetual notes of KRW 220 billion, roughly USD 159.7 million. Borrowings of KRW 1,510 billion, roughly USD 1,096.2 million.
Add those and you get KRW 2,180 billion. The price in the same paragraph is KRW 2,095 billion. The pieces overshoot the total by KRW 85 billion, about USD 61.7 million, or 4.0573 percent of the stated price by my calculation. I do not know which figure is the loose one. It could be transaction costs folded into one line and out of the other, or a rounded price against unrounded funding, or an error. What I will not do is quietly pick whichever pair closes and present that as the deal. I am printing all four numbers and the gap between them.
How the Borrowings Moved After 2022
From 605.9 Billion Won to 2,707.1 Billion
Here is the sequence the same outlet gives, and it is the part I find most useful because it gives three dated points where most sources give one.
| As of | Borrowings (KRW) | USD equivalent | Debt to equity |
|---|---|---|---|
| 2021 year end | 605.9bn | 439.8m | 107.99% |
| 2022 year end | 2,707.1bn | 1,965.2m | 305.79% |
| 2025 first quarter | 1,870.2bn | 1,357.6m | 123.21% |
Source: Korean financial trade outlet, 22 July 2025 | USD equivalents computed by me at the rate in the closing note | Net debt at the same first quarter date was put at about KRW 1,660 billion, roughly USD 1,205.0 million
Borrowings multiplied by 4.4679 times across those twelve months and then came down 30.9150 percent from the 2022 peak to the first quarter of 2025, both computed by me from the two figures beside each. Debt to equity went from just under 108 percent to just over 305 percent and back to just over 123 percent. Read end to end, that is a company that bought something large with borrowed money and then spent three years paying it down without ever getting back to where it started.
DN Automotive Stock and Two Debt to Equity Ratios
Two screens I use carry two different debt to equity figures for this company right now. One shows 115.364 percent and labels it the most recent full year. The other shows 146.66 percent and labels it June 2026. That is a spread of 31.296 percentage points between two screens I was treating as interchangeable.
I have followed this kind of trade before. A Korean thermal management supplier gave up per share profit in exchange for a lighter balance sheet, and the thing I took from that piece was that the two sides of such a trade land on different lines and at different speeds. Here the trade ran the other way, which is why the leverage figures below are the ones I want dated properly. The leverage came first and the earnings were supposed to follow.
A third screen adds a separate warning: a current ratio of 82 percent, with current assets of about KRW 2.1 trillion sitting under current liabilities of about KRW 2.5 trillion. I am taking that one at face value because it is stated as a flag and not as a computed multiple, and because nothing else I opened contradicts it.
There is a third company I read recently whose liabilities grew while its equity sat almost still, which is the opposite pattern to this one. Here the liabilities came down hard and the equity had to grow to make the ratio move as far as it did.
A Ratio I Dated Wrong
A ratio was the thing that caught me out, and the error was mine. I put 115.364 percent and 146.66 percent side by side and spent a while trying to work out what had happened to the equity base between them. Nothing had. One is a full year figure and the other is a half year figure, and I had read two vintages as one moment. Leverage ratios carry a date the way prices do, and screens print the date in small type or not at all.
What I am changing is narrow. Before I set two ratios beside each other, I write down the period each one covers, and if a screen will not tell me, I do not use it for the comparison. I did the same sort of thing once with two coverage figures that came four times apart out of one audited year, which makes this the second time I have walked into the same wall. There the split was in what got divided. Here it is in when.
What DN Automotive Stock Owns That Has No Quoted Price
About Sixty Percent, With No Price
DN Solutions makes metal cutting machines in Changwon. As of 2023 it ranked third worldwide in machine tool sales and employed 1,285 people. It tried to list in the first half of 2025, at a valuation Korean press put in the trillions of won, and pulled the offering on 30 April 2025. By December 2025 it had not appointed lead managers for a second attempt. On 28 January 2026 it completed the purchase of the German maker Heller, which is now its wholly owned subsidiary.
One Korean broker argued in June 2026 that a second listing attempt has become less likely, on two grounds: tighter regulatory treatment of parent and subsidiary double listings, and an improved financial position at the subsidiary that reduces its need to raise. The same note put first quarter 2026 new orders at KRW 653.1 billion, roughly USD 474.1 million, up 14 percent year on year, with the Americas up 42 percent and China up 18 percent, and said aerospace and defense had grown from the high teens as a share in 2023 to the mid twenties now. In August 2026 that broker raised its number for the parent, and a second Korean broker said the quarter set records for both new orders and the order balance, adding that machine tools typically take six months to a year from order to revenue.
Both of those are sell side notes reported at second hand. I did not open either original. I am carrying them as dated opinions with names on them, which is the highest grade I can give something I have not read directly.
Two Machine Tool Makers I Did Not Convert
I picked the two peers by a single rule, and it is a rule that looks at the subsidiary and ignores the parent: two companies whose names appear on the same world machine tool ranking that DN Solutions appears on. That means I am comparing something the market prices against something it does not, which is the whole difficulty and also the point.
DMG Mori Co closed at JPY 3,655.00 on a screen dated 7 August 2026, with a market value of JPY 515.70 billion, trailing revenue of JPY 573.54 billion and trailing net income of JPY 24.31 billion, a fifty two week range of JPY 2,307.50 to JPY 3,980.00 and a dividend yield of 2.87 percent. Okuma Corp closed at JPY 4,735.00 on a screen dated 31 August 2026, with a market value of JPY 282.11 billion, trailing revenue of JPY 243.15 billion and trailing net income of JPY 16.13 billion, a fifty two week range of JPY 3,265.00 to JPY 5,710.00 and a dividend yield of 2.42 percent.
Why I Left the Yen Where It Was
I did not turn any of those yen figures into won or dollars. This journal runs one exchange rate per piece and that rate is a won to dollar rate. Bringing a second currency through it would give me numbers that look comparable and are not, because they would be crossing two rates taken on two different days. So the peers stay in yen, and the consequence is that I cannot put them in a size table with the Korean company. That is a real limit and I would rather show it than hide it behind a conversion.
What does survive the currency wall is margin, because a margin is a figure divided by another figure in the same currency. DMG Mori earned 4.2386 percent net on trailing revenue and Okuma earned 6.6338 percent, both computed by me from the two figures I printed above. The Korean group earned 10.6332 percent net on trailing revenue of KRW 4,154.3 billion, roughly USD 3.016 billion, again my own calculation. That is the one comparison I am willing to make, and even it mixes a group that is part battery and part vibration parts against two pure machine tool makers. The share prices of the two Japanese names are stale on my screens by 41 and 17 days respectively, so I put them into no ratio that uses price.
I should say what that margin gap does not establish. A group that sells batteries and rubber parts alongside machine tools has a different cost structure from a pure machine tool maker, and a higher net margin in one year can come from mix, with operating quality holding steady. It can also come from a lower effective tax charge, from financial income, or from a single quarter that happened to fall inside the trailing window. The gap is 4 to 6 percentage points wide, which is large enough to be interesting and not large enough to be conclusive on its own. I am recording it as a question for the next report. It is not yet a finding.
What I Left Out of This Piece on DN Automotive Stock
The Rows I Could Not Date
I left out both current debt to equity figures as load bearing numbers. I printed them to show the spread and then built nothing on either. I left out every price based multiple for the two Japanese peers, for the staleness reason above. I left out the valuation Korean press attached to the withdrawn subsidiary offering, because I could not trace it to anything with a name on it. I left out the perpetual notes as a leverage question, because whether they sit in equity or in liabilities changes every ratio on this page and I could not establish where the screens I used had put them.
That last omission is the one that bothers me. KRW 220 billion of the purchase price came in as perpetual notes, which is 10.0917 percent of the KRW 2,180 billion of funding pieces by my calculation. An amount that size, classified one way or the other, moves a debt to equity ratio enough to matter at the precision I have been quoting.
Where DN Automotive Stock Could Prove Me Wrong
- The entire funding breakdown comes from one trade article and I opened no filing behind it.
- The 85 billion won overshoot may be an artifact of that article and may correspond to nothing in the accounts.
- If the price figure is the rounded one, the pieces are right and my gap is noise.
- The three borrowing dates are also from that one article and I cross checked none of them.
- A first quarter 2025 figure is not current and the company has reported five quarters since.
- Net debt of about 1,660 billion won at that date says nothing about maturities.
- I have no maturity profile at all, so I cannot say what falls due in which year.
- Interest expense does not appear anywhere in this piece because I could not open it.
- Without interest expense I cannot say whether the remaining borrowings are comfortable or tight.
- The current ratio of 82 percent came from a screen flag. I did not read the statement behind it.
- Current assets of about 2.1 trillion and current liabilities of about 2.5 trillion are rounded on that screen.
- The two debt to equity figures differ by 31.296 percentage points and I resolved neither.
- My explanation for that spread is dating, and dating is a guess until I open both statements.
- The perpetual notes classification is unresolved and moves every leverage figure here.
- The subsidiary share of revenue, about sixty percent, is a press figure and not a segment disclosure.
- A segment disclosure could split that revenue differently and change the whole framing.
- The world ranking of third by 2023 sales is three years old and rankings move.
- Heller closed on 28 January 2026 and I have no figures for what it added.
- An acquisition that recent can change both revenue mix and leverage before the next report.
- The withdrawn offering of April 2025 could be revived and the broker view against it is one opinion.
- Tighter treatment of double listings is a regulatory reading. I did not quote a rule.
- Both sell side notes reached me through secondary coverage and I read neither original.
- The order figures I quote are the subsidiary’s, and orders are not revenue until they convert.
- Six months to a year from order to revenue is the broker’s estimate. The company did not state it.
- The two Japanese peers are pure machine tool makers and the Korean group is not.
- Comparing a three business group against two single business peers on one margin line is a weak test, and I am doing it anyway because it is the only test the currency wall left standing.
What Changes If I Am Right About DN Automotive Stock
Suppose the reading above holds. What actually moves? First, if the third quarter 2026 report shows borrowings continuing down from the 1,870.2 billion won level, the three point sequence becomes a four point sequence and the pay down stops being a story about one deal and becomes a policy. Second, if that report classifies the perpetual notes plainly, both debt to equity figures on my screens become checkable and I stop having to print two. Third, if a maturity profile appears, the question of comfort or tightness gets an answer instead of an omission. Fourth, if the subsidiary files anything on a renewed offering, the unpriced sixty percent acquires a price and this entire piece becomes about something else. Fifth, and this is the part worth saying plainly, none of those four outcomes changes anything I hold, because I hold none of it. This is a record of why I am standing outside, written so that the standing outside is itself checkable.
Three Paths Out of the 2022 Purchase
I can see three paths from here and I do not weight them equally. The first, and to me the most likely, is that borrowings keep grinding down while the subsidiary stays private, which leaves the group cheap on earnings and opaque on assets for another year or two. The second is that a renewed offering succeeds, in which case the unpriced sixty percent gets a market value and the parent becomes a holding company trading at whatever discount the market applies to such things, which in Korea has historically been wide. The third, and the one I would find hardest to read, is that borrowings rise again for another purchase before the 2022 one is fully worked off. Heller closed in January 2026, so the third path is not hypothetical.
What separates those three is not sentiment. It is two disclosures: the borrowings note and the classification of the perpetual notes. Both should appear in the third quarter 2026 report, and neither requires me to guess about demand, orders or margins to read it.
My thesis breaks in a specific way. If the third quarter 2026 report shows borrowings rising again while the current ratio stays under 100 percent, then the pay down I described was a pause dressed as a direction, and the sentence in this piece about three years of reduction has to come out. The judging document is the borrowings and short term liabilities note in that report. If instead the subsidiary refiles for a listing before that report lands, the judging document changes to the offering prospectus and my leverage framing becomes the smaller half of the question.
Prices and ratios reflect the 17 September 2026 close, at which DN Automotive traded at about USD 34.92 a share, for a market value of about USD 2.043 billion. USD conversions are approximate, computed by me at KRW 1,377.54 per dollar, the 16 September 2026 close on the currency screen I use, and rounded. Figures marked as my own calculation are divisions of two numbers printed beside them. The acquisition funding, borrowing sequence and leverage history come from a Korean trade report dated 22 July 2025; the subsidiary’s ranking, Heller purchase and history from its public encyclopedia entry and the parent’s; the withdrawn offering from Korean coverage of the second attempt; the broker views from June 2026 reporting and August 2026 reporting; peer figures from DMG Mori and Okuma screens.