SK REIT Stock at 0.85 Times Owners’ Equity, One Group Pays Rent
Before deciding whether 0.85 times net assets is cheap, I wanted to know who pays the rent on them. That question took longer to answer than the ratio did, and the answer turned out to be short enough to fit in one line.
SK REIT stock closed at KRW 5,460 on September 2, 2026 (Wed), which puts the whole company at KRW 1,643.56 billion, or roughly USD 1.20 billion. Against the equity attributable to owners on the fiscal 2025 balance sheet, that price is 0.8474 times, by my calculation. The four listed landlords I lined it up against sit between 0.68 and 1.85 on the data provider’s version of that ratio, whose equity basis I could not confirm. So the number is low, but low against what turns out to be the point of this entry.
Contents
Six Things I Wrote Down About SK REIT Stock
1. Equity attributable to owners at the end of fiscal 2025 was KRW 1,939.593 billion, about USD 1.42 billion. Divided by 301,017,620 shares that is KRW 6,443.45 per share, by my calculation, and the September 2 close is 0.8474 times that figure.
2. Total assets were KRW 5,433.91 billion and total liabilities KRW 3,413.13 billion at the same date. The market values the whole company at 30.25 percent of the asset side, by my calculation.
3. Equity attributable to owners rose 63.87 percent during fiscal 2025, from KRW 1,183.63 billion to KRW 1,939.59 billion, an increase of KRW 755.96 billion, by my calculation.
4. That increase reconciles. Assets grew KRW 1,000.37 billion and liabilities grew KRW 244.40 billion, and the difference is KRW 755.97 billion. The gap against the equity move is KRW 0.01 billion, which comes from the fiscal 2024 total equity cell rounding to 1,264.82 where its own two columns give 1,264.81.
5. Non-controlling interests barely moved across the three year-ends where the filings show them: KRW 81.29 billion, KRW 81.19 billion, KRW 81.19 billion. The fiscal 2022 cell is blank. The whole equity move belongs to the owners.
6. Korean outlet Digital Post, relaying an NH Investment and Securities comment on August 28, 2026 (Fri), put group-affiliated tenancy at 96 percent of the portfolio. The source states it as a share of the portfolio and not as a share of rent, and I could not find the calculation behind it. That single figure is what the rest of this entry is about.
The Equity Line, Four Years of It
What the filings show
I could not reach Korea’s electronic disclosure system directly, so the balance sheet figures below come from an indicator server that loads those filings. The fiscal 2025 row carries a receipt number dated March 11, 2026 (Wed). All amounts are in billions of Korean won.
| Fiscal year end | Total assets | Total liabilities | Total equity | Equity to owners | Non-controlling |
|---|---|---|---|---|---|
| 2022 | 3,127.37 | 2,158.65 | 968.72 | 968.72 | not shown |
| 2023 | 4,295.63 | 2,974.23 | 1,321.40 | 1,240.11 | 81.29 |
| 2024 | 4,433.54 | 3,168.73 | 1,264.82 | 1,183.63 | 81.19 |
| 2025 | 5,433.91 | 3,413.13 | 2,020.78 | 1,939.59 | 81.19 |
Two notes on that table. Total equity at the end of fiscal 2025 was KRW 2,020.78 billion, of which KRW 1,939.59 billion is attributable to owners and KRW 81.19 billion to non-controlling interests, and the two add back exactly, by my calculation. Every per-share figure in this entry uses the owners’ portion. Also, the fiscal 2024 row does not foot to the decimal: assets less liabilities give 1,264.81 where the total equity cell shows 1,264.82. That one hundredth of a billion won is the source of the small residual in point four above.
Why I insist on the owners’ line
Vendor pages report price to net assets for this company at 0.83, 0.84, 0.85 and 0.88, and I found all four without looking hard. Working backward from each of those ratios gives four different net asset figures per share, from KRW 6,204.55 to KRW 6,578.31, a spread of 6.02 percent, by my calculation. Using the owners’ equity straight from the filing removes the ambiguity: KRW 1,939.593 billion divided by 301,017,620 shares is KRW 6,443.45, and KRW 5,460 divided by that is 0.8474, by my calculation.
Using total equity instead, including the non-controlling slice, the same price works out to 0.8133, by my calculation. I am naming both because the difference is not trivial and because none of the vendor pages says which one it used.
SK REIT Stock Against the Assets It Sits On
Thirty percent of the asset side
KRW 1,643.56 billion of market value against KRW 5,433.91 billion of assets is 30.25 percent, by my calculation. The asset side itself is funded by KRW 3,413.13 billion of liabilities and KRW 2,020.78 billion of total equity, which add back to the asset total exactly. Market value is not one of those funding lines, and it sits below the equity that funds the assets by KRW 377.22 billion, by my calculation. For a landlord this is ordinary arithmetic, and I mention it only so the 0.85 ratio does not get read as a claim about the buildings. It is a claim about what is left after the lenders.
Two asset numbers that are not the same thing
Here is a place where I let myself go wrong for most of an hour. The filings put total assets at KRW 5,433.91 billion. Korean coverage and a securities house note both describe assets under management of about KRW 5.3 trillion. I read the two as the same figure with rounding, and moved on.
They are not the same figure. The first is a carrying amount on a balance sheet. The second is an appraisal-based measure that Korean REIT coverage uses to describe portfolio size, and it moves when appraisers revalue, even in a year when nothing is bought or sold. I went back and separated them, and I now treat the appraisal figure as commentary and the balance sheet figure as the one that anchors the ratio. The lesson I am keeping is that two numbers landing within a few percent of each other is not evidence that they measure the same thing.
Where the Equity Jumped, and Whether It Closes
A 63.87 percent move in one year
Equity attributable to owners went from KRW 1,183.63 billion at the end of fiscal 2024 to KRW 1,939.59 billion a year later. That is a gain of KRW 755.96 billion, or 63.87 percent, by my calculation. It is a large move for a landlord and my first instinct was that I would not be able to explain it.
Before writing that I could not explain it, I used the rest of the rows. Assets rose KRW 1,000.37 billion over the same year and liabilities rose KRW 244.40 billion. The difference is KRW 755.97 billion, which lands on the equity move within KRW 0.03 billion of rounding. Non-controlling interests moved by KRW 0.00 billion at two decimal places. So the arithmetic is complete, and what remains open is not the calculation but the cause.
What the cause probably is, and why I am hedging it
Korean-language coverage by Bloter and by Edaily, the latter relaying an NH Investment and Securities note by analyst Lee Eun-sang on February 26, 2026 (Thu), attributes a portfolio addition in November 2025: a Pangyo office taken in through a sale and leaseback with an affiliate of the sponsor named as the responsible tenant. I did not verify the ownership chain of that affiliate. An addition of that size would move both the asset and liability lines, and a Samsung Securities alternative investment note dated April 1, 2026 (Wed) describes the loan-to-value ratio after that addition as 58.9 percent.
Before calling the whole KRW 755.96 billion unexplained I subtracted what this entry already documents elsewhere: a third-party share placement of about KRW 48.5 billion in June 2025 and KRW 65.2 billion of convertibles converting in September 2025, both inside fiscal 2025 and both equity-increasing. That leaves roughly KRW 642.26 billion I cannot account for, by my calculation. What I did not find is the transaction price of the November addition, its funding split between debt and existing cash, or a filing note explaining the residual. Samsung Securities reported that the addition itself was completed without a share issue, which is about the November transaction specifically and says nothing about the two June and September events above. I am leaving the residual as an open item. It is not a finding.
SK REIT Stock and the One Name on the Rent Roll
Ninety-six percent
Korean outlet Digital Post on August 28, 2026 (Fri), relaying an NH Investment and Securities comment, put group-affiliated tenancy at 96 percent of the portfolio, alongside assets under management of about KRW 5.3 trillion and a domestic credit rating of AA minus. The figure is stated as a share of the portfolio. It is not stated as a share of rental income, and since I could find no tenant-level income disclosure I cannot convert one into the other. I am carrying it as a reported figure. I did not verify it myself.
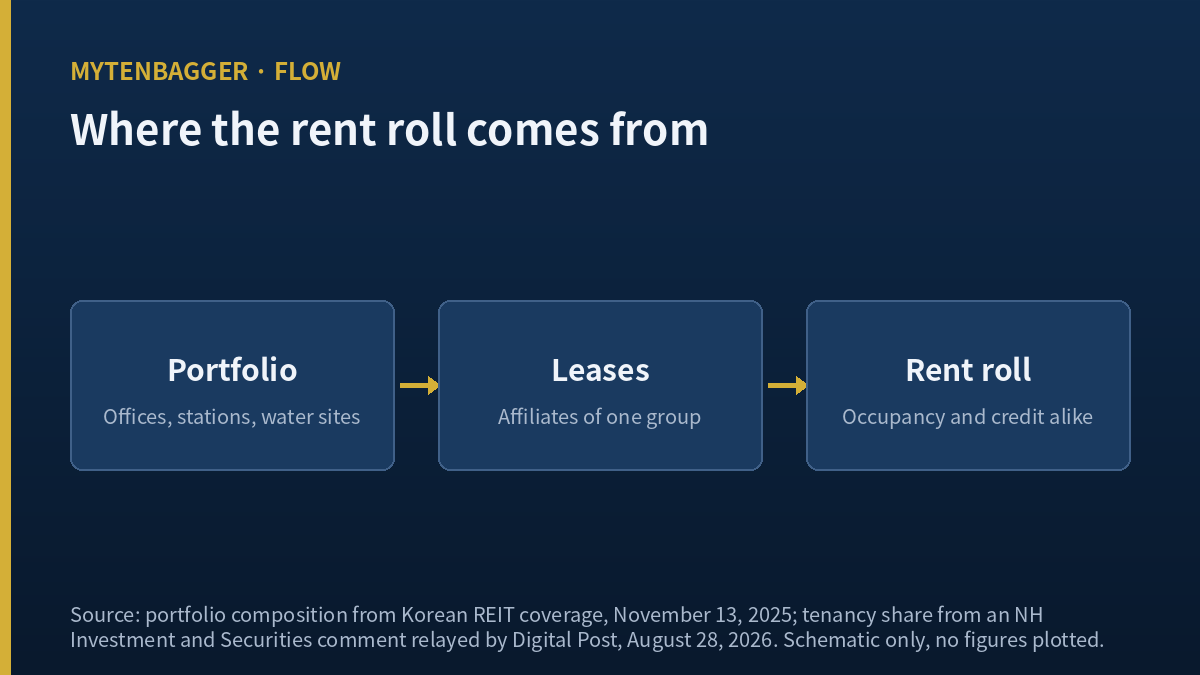
The structure behind that number is a set of master leases with affiliates of the sponsor group. Korean REIT coverage describes the terms as triple net, meaning the tenant carries taxes, insurance and maintenance, and I did not see a lease document to check that description. The same coverage, published on November 13, 2025 by Seoul Economic Daily’s REIT desk, reported portfolio vacancy at zero percent as of September 2025.
Both ways to read the same fact
This cuts two ways and I do not think either way cancels the other. On one side, a landlord that has not had to find a tenant carries little leasing risk, which is what the September 2025 vacancy figure describes. On the other side, the portfolio and the credit standing of one Korean group move as close to the same variable as makes no practical difference. If that group’s credit moves, the lease income and the refinancing terms move together, with no offset between them.
I did not find a disclosure that breaks rental income down by individual tenant, so I cannot say how the remaining four percent is composed or how much of the 96 percent sits with any single affiliate.
One lease extension, and what it does not cover
The same August 28 report says the sponsor extended its lease on the central business district office by a further five years during July 2026. Only the month is given, and I did not find the day. That extension fixes the income on one building. The gas station portfolio and the water treatment facilities have their own lease terms, and I did not obtain an end date for any of them.
What Sits Inside the Portfolio
Offices, gas stations, water treatment
Korean REIT coverage published on November 13, 2025 described the portfolio as four offices, 106 gas stations and five water treatment buildings. A Daishin Securities initiation by analyst Lee Hye-jin dated July 3, 2025 counted 111 gas stations against the same four offices and five buildings, and Bloter on May 11, 2026 (Mon) counted 116. Disposals have been running, which probably explains the drift, but I could not reconcile the three counts to specific dates.
For readers outside Korea, the exchange context matters here. KOSPI is the main board of the Korea Exchange, the larger of the country’s two listing venues, and this company trades there as a real estate investment trust, which is a different listing category from an operating company. The Korean REIT association listing table, read in September 2026, places it first among the twenty-three listed Korean REITs by total assets.
The sector around it
Korean REITs held KRW 127.3 trillion of total assets across 470 vehicles as of the end of July 2026, according to Newspim on August 18, 2026 (Tue). The same report put the listed segment at about KRW 8.44 trillion across twenty-three names, and that figure is combined market value instead of assets. The distinction matters here: this company alone carries KRW 5,433.91 billion of assets, which would be 64 percent of the listed segment if the 8.44 trillion measured assets, and it plainly does not. A separate Korean report on May 5, 2026 (Tue) counted twenty-five listed REITs and about KRW 10 trillion on what appears to be the same market value basis. I am carrying both counts because I could not determine which cut-off each used.
SK REIT Stock Next to Four Listed Landlords
The basis I picked
My rule for this table was narrow on purpose: listed landlords only, one measure only, price against net assets. Everything else is left out, and the next section says why.
| Company | Price to net assets | Period end behind the figure | Market value and equity as shown |
|---|---|---|---|
| SK REIT (KOSPI: 395400) | 0.8474 | Equity at December 31, 2025; price September 2, 2026 (Wed) | KRW 1,643.56bn against KRW 1,939.59bn |
| W. P. Carey (NYSE: WPC) | 1.85 | June 30, 2026 | USD 16.06bn against USD 8.69bn |
| Realty Income (NYSE: O) | 1.47 published / 1.387 recomputed | June 30, 2026 | USD 58.17bn against USD 41.93bn |
| Japan Real Estate Investment (TYO: 8952) | 1.59 | March 31, 2026 | JPY 865.29bn against JPY 543.57bn |
| Link REIT (HKG: 0823) | 0.68 | March 31, 2026 | HKD 101.85bn against HKD 149.71bn |
Peer figures were taken from a single data provider in September 2026. No currency conversion has been applied to any row, because each ratio divides a value by an equity figure in the same currency.
One peer row does not reconcile
I recomputed each published ratio from the market value and equity in the last column. Three of the four land where the provider puts them: W. P. Carey at 1.848, Japan Real Estate at 1.592, Link REIT at 0.680, all by my calculation. Realty Income does not. Its own two figures give 1.387, and the page shows 1.47.
I did not resolve the difference. The most likely explanation is a different equity date or an adjusted equity measure behind the published ratio, but I could not confirm either, so I am flagging the row instead of using it quietly.
Seven places this comparison is loose
First, the period ends do not line up. Two peers are measured to June 30, 2026 and two to March 31, 2026, while my own row pairs a December 31, 2025 equity figure with a September 2, 2026 price. Second, my row was computed by me and the peer rows were computed by the provider. Third, I could not determine whether the peer equity figures are owners’ equity or total equity, which is exactly the distinction I insisted on for my own row. Fourth, these four are net lease and retail landlords in three different markets, and I did not examine their tenant disclosures, so I cannot say how concentrated any of their rent rolls are.
Three more that I added after checking my own row against the rest of this entry. Fifth, my market value rests on a share count that two sources disagree about, as the next section sets out. Sixth, I quoted my own ratio to four decimal places against peers quoted to two, which implies a precision the inputs do not carry. Seventh, a convertible conversion window closed in February 2026, between my equity date and my price date, so the share count behind the December 2025 balance sheet may not be the count behind the September 2026 market value.
Why Margin and Yield Are Not in That Table
Both were available and I left both out.
Operating margin came out at 91.72 percent for this company on the fiscal 2025 income statement, against 46 to 68 percent for the four peers on the provider’s pages. That spread is far too wide to be an operating difference between landlords, which tells me the revenue line is defined differently on at least one side. Putting the two next to each other would have produced a comparison that looks precise and means nothing.
Dividend yield has the same problem in a different place. This company settles four times a year, and several data pages divide one quarterly amount by the price and label the result an annual yield. Until the amounts on both sides of a yield comparison cover the same span, the comparison is not a comparison.
The seven-metric checklist I normally run also returned nothing here. The indicator server marks it as not applicable for real estate investment trusts and points to rental cash flow, dividend yield and loan-to-value instead. The score field is empty, and empty is not the same as zero. A reader who takes a blank score for a failing one has the company backwards.
What I Left Out of the SK REIT Stock Case
The share count disagreement
Two share counts are in circulation. Two Korean vendor pages both give 301,017,620. The indicator server gives 301,025,641, a difference of 8,021 shares. The vendor figure is the one that reconciles: the three largest holdings of 87,554,915, 21,227,341 and 16,710,807 shares divide into it at 29.09, 7.05 and 5.55 percent, matching the published percentages in all three cases, by my calculation. The par value check also holds at KRW 500 per share.
The server figure has a visible origin. A rounded market capitalization of KRW 1,643.6 billion divided by KRW 5,460 gives 301,025,641.03. Truncated, that is the server’s number exactly. I used the vendor count throughout.
Share count history I could not close
This company has issued shares repeatedly when adding assets: a rights issue in June 2022, another during 2023, and a third-party placement of 10.43 million shares at KRW 4,650 in June 2025 with the new shares listed in July 2025. Financial News reported that a convertible bond issued in December 2022 saw KRW 65.2 billion convert during September 2025 alone, and the NH note relayed by Edaily on February 26, 2026 (Thu) says a conversion window on KRW 132.1 billion of convertibles closed on February 15, 2026 (Sun). February 15 falling on a Sunday suggests a period-end convention and not a business date, though I did not confirm which. These are two different quantities and I nearly filed them as one. KRW 109.0 billion is the December 2022 issue size as reported by Financial News. KRW 132.1 billion is the volume whose conversion window expired, as reported through the NH note. I could not trace what happened to the unconverted remainder of either figure.
Every per-share figure in this entry rests on the 301,017,620 count, so this is an open item. A footnote would understate it.
The income statement, deliberately left in the other edition
I kept them out of this one because the ratio here is a balance sheet ratio and does not depend on how the revenue line is defined. Readers who want that thread should know it exists and that it ends in an open question. I have made that same move before, in an entry where the payout ran past what the company earned, where the question was again which line the payout should be measured against.
Thirteen Places My Read on SK REIT Stock Could Break
- I could not reach the electronic disclosure system directly. Every balance sheet figure here comes through an indicator server that loads those filings.
- I could not determine whether the peer equity figures behind the four published ratios are owners’ equity or total equity, which is the distinction the whole table turns on.
- One peer ratio does not reconcile from its own published inputs, and I did not find out why.
- The period ends across the table span March 2026 to September 2026, which is wide enough to matter when property values are moving.
- The 96 percent tenancy figure is a reported number relayed through Korean press. I did not find the calculation behind it.
- If the 96 percent is spread across many affiliates with separate credit standing, my single-credit reading is too strong. I found no disclosure breaking rental income down by tenant, so I could not test it.
- The cause of the KRW 755.96 billion equity increase is inferred from coverage of a November 2025 portfolio addition, and I did not confirm it from a filing note.
- The convertible bond issue size is reported as two different amounts and the unconverted remainder is untraced. The share count that every per-share figure uses is exposed to this.
- Gas station counts differ across three sources at 106, 111 and 116, and I could not tie the counts to dates.
- If the leases run long and fixed, near-term risk is lower than my reading implies and I am overstating it. I obtained no lease end date for any individual asset, and the five-year extension I cite covers one building.
- The loan-to-value ratio of 58.9 percent comes from a securities house note dated April 1, 2026 (Wed) and rests on appraisal values whose method I did not examine.
- Zero vacancy, a AA minus domestic rating and a five-year lease extension all point the other way from a discount, and a securities house note dated July 3, 2025 puts a higher valuation on the shares than the current price.
- My reading treats the 0.85 ratio as a description of tenant concentration. If the concentration is priced correctly by the market and the discount comes from something else entirely, such as the sector-wide derating that followed a Korean REIT insolvency filing in April 2026, then the connection I am drawing does not hold.
My Stance on SK REIT Stock and What Would End It
Where I stand
I own none of this and I have placed no order. The first reason is size. A KRW 1,643.56 billion market value sits below the range where I take a position at all, and that filter applies before anything else in this entry. What follows assumes the size question is set aside.
On that assumption, my read is this. The 0.85 ratio is not a measure of how well the buildings are valued. It is a measure of what the market pays for equity whose portfolio is 96 percent leased inside one group. I do not think that discount is a mistake, and I do not think it is an opportunity either. I think it is a description, and until I can see rental income split by tenant I have no way to test whether the description is priced about right or too harshly.
The reading I set aside
I deliberately left out the argument that the assets themselves are worth more than the price implies. That argument needs appraisal values I did not examine, and it runs through a loan-to-value ratio whose method I could not verify. Anyone making that case has to start with the appraisals, and I did not.
The first condition, which tests the base and not the reading
If equity attributable to owners in the fiscal 2026 annual filing lands outside KRW 1,842.61 billion to KRW 2,036.57 billion, which is five percent either side of the fiscal 2025 figure, then the base my ratio stands on has moved and the ratio has to be rebuilt before anything else in this entry means much. I made this one two-sided after looking at the table again. Equity rose 63.87 percent last year, so a downward-only trigger would have pointed away from the direction this company actually moves.
I checked how much room there is before it fires on ordinary events, and the answer is less than I first assumed. Four settlement periods at the 2026 pattern of 68, 68, 66 and 68 come to KRW 270 per share, or KRW 81.27 billion, which is 83.81 percent of the KRW 96.98 billion cushion on the downside, by my calculation. Earnings attributable to owners were KRW 32.36 billion in fiscal 2025, so a repeat year would leave equity near KRW 1,890.68 billion, about KRW 48.09 billion clear of the lower bound. Distributions alone do not fire it. The margin is roughly half the cushion, which is a good deal tighter than the comfortable gap my first draft implied.
The table also shows this has nearly happened before. Owners equity fell from KRW 1,240.11 billion at the end of fiscal 2023 to KRW 1,183.63 billion a year later, a decline of 4.55 percent, by my calculation. That is 0.45 percentage points short of the trip-wire I just set, two years ago, in a year with no unusual event I could identify.
One more note on the inputs. The 2026 settlement amounts are two declared figures of 68 for the March and June periods, one scheduled estimate of 66 shown on the dividend record page for September, and my own assumption of 68 for December. Only the first two are declared.
The second thing, and the measurement I may not get
If group-affiliated tenancy falls below 90 percent, my reading that this equity answers to a single credit weakens materially. The current reported figure is 96 percent, so the trigger is not already satisfied and nothing fires without an actual change in the portfolio.
The problem is that this measurement may not exist when I go looking for it. The 96 percent figure surfaced once, inside a securities house comment relayed by a Korean outlet, and it is not a line item in any filing I located. So I am naming the fallback now so that I do not improvise later.
- First choice: a securities house note or company investor material that restates group-affiliated tenancy as a percentage.
- If that is unavailable: the tenant list disclosed against individual assets in the annual report, counted by asset, which is not the same as counting by rent and is a weaker measure and I will label it as such when I use it.
- If both are unavailable: I record the condition as unmeasurable. I will not mark it passed, and I will not treat silence as confirmation of my own reading.
Both conditions expire with the fiscal 2026 annual filing in March 2027, at which point every figure in this entry needs rebuilding. There is one earlier date worth noting: the quarterly record date of September 29, 2026 (Tue), after which the settlement figures I used move on.

Related reading: a Korean operator with one dominant property, a Korean trust company that earned a half-year profit while its fourteen-company sector lo
Price and market value reflect the September 2, 2026 (Wed) close. The share count is the December 2025 vendor figure, which two sources disagree about and which may be stale after the February 2026 conversion window. Balance sheet figures are as of December 31, 2025, read through an indicator server that loads the annual filing, and not from the filing itself. Peer figures were taken in September 2026 and carry the period ends shown in the table.
Prices and ratios reflect the September 2, 2026 close as checked at the time of writing. Korean won is the reference currency throughout, and dollar amounts are approximate conversions at roughly KRW 1,368.7 per dollar on that same date, taken from Seoul foreign exchange market closing quotes reported by Korean financial press. Peer figures are shown in their own currencies with no conversion applied. Anything marked as calculated by me was derived from the figures named beside it and was not taken from a source.
Sources consulted for this entry include Korean financial press reporting on the borrowing structure and tenancy and credit rating, a securities house note on the convertible conversion window, Korean REIT coverage of the portfolio, sector asset totals, reporting on a Korean REIT insolvency filing, the Korean REIT association listing table, the settlement and payment record, and peer statistics pages for W. P. Carey, Realty Income, Japan Real Estate Investment and Link REIT.