Innocean Stock: Eight Firms Point Above the 52-Week High
The average valuation eight firms carry on Innocean stock is 25,125 won. The highest price the shares reached in the past year is 22,650 won. The average sits 10.93 percent above a level the market has never actually printed in twelve months, which I calculated myself and then checked twice because it is an unusual thing to find. This is a KOSPI-listed advertising agency inside Hyundai Motor Group, and it is also, by the numbers I am about to lay out, one of the quietest securities I have opened this year.
   Close, September 11, 2026            18,470 won
   52 week high                         22,650 won
   52 week low                          16,730 won
   Eight firm average valuation         25,125 won
   Four firm figures I verified         23,000 to 25,000 won
   Implied average of the other four    26,000 won
   Beta                                       0.05
   Trailing earnings multiple                 8.05
   Forward earnings multiple                  6.21
Contents
Innocean stock closed at 18,470 won on Friday, September 11, 2026
I want to establish the price before anything else, because two of the information screens I opened disagreed about it. One showed a close of 18,570 won and stamped itself September 9. Another showed 18,470 won with a timestamp down to the second, 15:30:27 on September 11, but its market capitalization cell worked out to a different day again. I settled the question by multiplication: market capitalization divided by the 40 million shares outstanding gives a price, and that price tells you which session the cell was built from. The close I use throughout is 18,470 won.
Multiplying that close by the share count gives a market capitalization of 738.8 billion won, or about US$550.7 million at 1,341.59 won per dollar. That is small. It is roughly the size at which broad Korea funds stop caring, and it is well outside the top hundred names on the exchange.

Eight firms, a level the market has not printed in a year, and a beta of 0.05
The consensus screen reports eight contributing firms, an average rating of 4.00, a forward earnings estimate of 2,972 won per share, and an average valuation of 25,125 won. Against the 18,470 won close that average implies 36.03 percent of upside (my calculation). Against the 52-week high of 22,650 won it implies 10.93 percent above anything the market has been willing to pay since September 2025.
I could verify four of the eight figures through Korean press summaries of brokerage notes. KB Securities analyst Choi Yong-hyun marked the company at 23,000 won on July 22, 2026 (Wed), unchanged from the same figure on January 14, 2026 (Wed). Samsung Securities analyst Choi Min-ha marked it at 25,000 won on May 11, 2026 (Mon) when initiating with a buy rating. NH Investment analyst Lee Hwa-jung marked it at 25,000 won on February 4, 2026 (Wed), a cut from 26,000 won that the coverage called 4 percent and that I calculate at 3.85 percent. A DB Securities note carrying 24,000 won appeared on August 6, 2026 (Thu), and I could only see the headline for that one.
The four I could not see have to average 26,000 won
Here is the part I did not expect. Eight figures averaging 25,125 won sum to 201,000 won. The four I verified sum to 97,000 won. The remaining four therefore sum to 104,000 won and average 26,000 won each (all my calculation). Every one of the four figures I could actually read is at or below the consensus average, which means the four I could not read sit above it, and by a meaningful distance.
I am not treating that as a finding about the company. It is a finding about what I can and cannot see. The four visible notes are the ones Korean media chose to summarize, and there is no reason media selection would be neutral with respect to how bullish a note is. But the arithmetic constraint is real: if the average is right and my four readings are right, four firms are carrying figures above 25,000 won on a stock that has not traded above 22,650 won in a year.
A band 1.35 times wide, and a beta of 0.05
The 52-week range runs from 16,730 won to 22,650 won. High divided by low is 1.3539 (my calculation). For comparison, the US company I use later in this note has a one-year band of 2.2261 on the same measure. The current price sits 18.45 percent below its own high and 10.40 percent above its own low (both my calculation), which is close to the middle of a range that is already narrow.
Beta is reported at 0.05. I have opened a lot of Korean securities this year and I do not remember seeing one that low. It means the price barely responds to the index. Combined with the narrow band, the picture is of a security that mostly sits still. Eight firms are modeling a 36 percent move in something that has spent a year refusing to move much at all. I do not read that as a contradiction the firms failed to notice. I read it as the reason the gap exists: a price that will not move on its own needs a specific event to move it, and nobody I could read named the event.
Innocean stock measured against five years of revenue and margin
Annual figures below are in billions of won, from the Korea Economic Daily financial summary. The margin column is mine, recomputed from the two figures beside it.
| Year | Revenue | Operating profit | Margin, my calculation | Published margin |
|---|---|---|---|---|
| 2021 | 1,502.03 | 135.73 | 9.04% | 9.04% |
| 2022 | 1,750.41 | 136.89 | 7.82% | 7.82% |
| 2023 | 2,092.89 | 150.02 | 7.17% | 7.17% |
| 2024 | 2,120.58 | 155.66 | 7.34% | 7.34% |
| 2025 | 2,146.04 | 162.80 | 7.59% | 7.59% |
All five recomputed margins match the published column, which is the check I run before I let a table carry an argument. Over the four years, revenue grew 42.88 percent and operating profit grew 19.94 percent (my calculation). The margin fell from 9.04 percent to 7.17 percent and then climbed back to 7.59 percent. Growth arrived, and roughly half of it was given back at the profit line.
What the top line might actually be counting
One caution about the revenue line specifically. In agency accounting the top line can swing on whether media buying is recorded gross or net, and I did not confirm which treatment applies here or whether it changed across these five years. That makes the revenue growth figure less solid than the profit figure, and I have kept my language about it deliberately loose.
The quarter that fell on one line and rose on the other two
Quarterly figures come from an aggregator screen that reports them to the won, and the second quarter was confirmed in the Korean coverage of the August 5, 2026 (Wed) release. First quarter 2026 revenue was 523.79 billion won with operating profit of 39.79 billion won. Second quarter revenue was 499.05 billion won with operating profit of 44.59 billion won.
Revenue fell 24.74 billion won quarter on quarter, a decline of 4.72 percent, while operating profit rose 4.80 billion won, a gain of 12.06 percent (all my calculation). The margin went from 7.60 percent to 8.93 percent. Against the same quarter a year earlier, the company reported revenue down 3.9 percent, operating profit up 22.4 percent, and net profit up 53.1 percent. Three lines, three different directions or speeds.
The half year sits above every full year in the table
The half year therefore sits at 1,022.84 billion won of revenue and 84.38 billion won of operating profit, an 8.25 percent margin (my calculation). That is above every full year in the table above. Company commentary ties the gain to sports marketing around the 2026 World Cup, a Genesis campaign tied to Le Mans, and expansion in digital and brand-space work, with Europe cited at 115.3 percent operating profit growth and the Americas at 5.1 percent. I could not verify the segment percentages against a filing, so I report them as company statements.
Innocean stock and two forward multiples computed two days apart
The corporate data screen prints a forward earnings multiple of 6.25 and a trailing multiple of 8.09. Neither reconciles with the close I am using. Dividing 18,570 by the forward estimate of 2,972 won gives 6.2483, and dividing the same 18,570 by trailing earnings per share of 2,294 won gives 8.0950. So both printed multiples were built on the September 9 session and not on September 11.
On the September 11 close of 18,470 won the same two divisions give 6.2147 and 8.0514 (my calculation). Two sessions of price movement is the entire difference. The earnings estimate did not change; the screen simply had not caught up.
A third forward multiple, from a different estimate
The KB note from July carried a forward multiple of 6.7 times. That is neither of the two above, and the reason is that KB divided by its own earnings estimate instead of the eight-firm average. I did not obtain KB’s earnings number, so I cannot place it precisely. I note the existence of a third figure because anyone comparing multiples across sources on this name will meet all three, and the spread between them comes from earnings assumptions and has nothing to do with price.
The peer I picked, and what I found after picking it
I picked Stagwell Inc (NASDAQ: STGW) for two reasons, and I want both on the record because the first one is not analytical. The obvious American comparison for a Korean agency is the largest holding company in the sector, and I have already written that comparison elsewhere, so I went looking for a different one. The analytical reason is better: Stagwell is a US-listed agency group of broadly similar revenue scale whose client base is not concentrated in a single industrial parent, which is exactly the structural feature that distinguishes the Korean company. Its screen was stamped September 11, 2026, the same session as my Korean close, so the two sets of figures describe the same day.
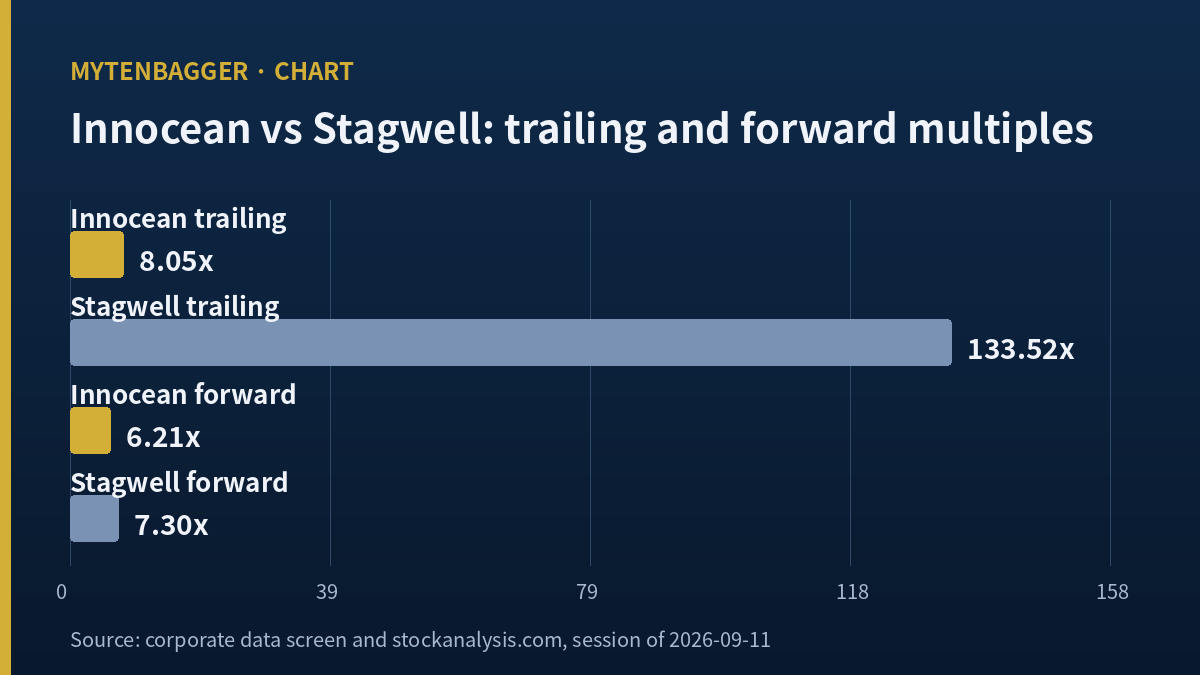
What I found after picking it changed what I thought the story was. Stagwell’s trailing twelve month revenue is US$3.04 billion against roughly US$1.600 billion for the Korean company at the exchange rate above, so 1.90 times the revenue (my calculation). Its market capitalization is US$2.10 billion against US$550.7 million, so 3.81 times the market value on 1.90 times the revenue. The trailing earnings multiples are 133.52 and 8.05, a gap of 125.47 points. The forward multiples are 7.30 and 6.21, a gap of 1.09 points. Beta is 1.22 against 0.05, and the one-year band is 2.2261 wide against 1.3539. Two companies in the same business, priced as though the market expects one of them to become something different and the other to stay exactly as it is.
What I left out, and why
The Korean note on this company, written in the same session, is built entirely on the consolidated equity accounts, and I have kept those figures out of this piece so the two are not the same work in two languages. What follows is what I dropped from both.
Three items I could not stand behind
First, the beta of 0.05, which carries a good deal of weight in this note. It appears on one corporate data screen, and the aggregator screen I used for the quarterly figures reports no beta at all. I have no second source for it. A number I lean on this hard should have two sources. I am flagging the gap instead of quietly leaning anyway.
Second, treasury shares. I could not find the holding on any screen I opened, which means I cannot say whether the share count above is the issued total or the total net of treasury. For a company this closely held that distinction can matter.
Third, a related-party revenue ratio that circulates in Korean press coverage. The absolute figure and the ratio in the same article do not reconcile against consolidated revenue, which tells me the ratio uses a different base that the article does not name. I left the ratio out of both pieces.
Twelve things that cut against this reading of Innocean stock
I have split these by where they came from, because I think the source matters. The first six were already said by the sell side or the Korean press. The last six are mine, which means nobody has checked them.
Six that were already on the record
- NH Investment cut its figure 4 percent in February and named higher than expected personnel costs as the reason. Costs that rose once can rise again.
- The same note described non-affiliate advertisers leaving in overseas markets, and specifically slower growth in North America after contracts expired.
- KB’s July note describes the advertising market itself as weak and credits the company’s resilience to captive volume. That is an argument for stability. It is not an argument for a 36 percent move.
- KB also cited the unwinding of a second shareholder overhang as a positive. If a large holder is still selling, the narrow trading band may be a seller at work, and calm is the wrong word for it.
- Korean coverage has noted the company was not added to a domestic value-up index while a sector rival was. Whatever one thinks of such indices, it is a documented negative signal I did not generate.
- Company commentary on the strong quarter credits event-driven work, the World Cup and a Le Mans campaign. Event-driven revenue does not repeat by default.
Six that are mine alone
- My 26,000 won figure for the four unverified notes assumes the consensus average is a simple mean of eight equally weighted figures. If the screen weights or trims, the arithmetic collapses.
- I have not confirmed when each of the eight firms last revised. An average built from notes spread over months is not a view held on one day.
- I treated the 52-week high as a level the market refused to go past. It may simply be the high of a quiet year, and quiet years end.
- A beta of 0.05 on a small, closely held security may be measuring illiquidity as much as independence from the index.
- I recomputed five annual margins and found five matches, and I let that give me confidence in the whole table. Matching margins only prove the two columns agree with each other. They do not prove that either one is right.
- Everything I used here is on public screens: the consensus, the four notes, the range, the beta. If the gap between the average and the high is visible to anyone who opens the same page, then what I did was arithmetic on published numbers, and the market has had a year to do the same arithmetic.

Where I stand on Innocean stock, and how soon I would know I was wrong
I do not own this and I have no order in. I am watching. The market value puts it outside the top hundred Korean listings, which is my default for watching instead of buying, and this time there is a second reason on top of the default. The single most interesting number in this note, the 26,000 won implied average of four figures I could not read, exists only because I could not read them. A position taken on the strength of an inference from missing data is a position taken on the missing data.
So I have written the exit conditions as a question about time. If this reading is wrong, how long before I find out?
- Within weeks. If any of the four unverified firms publishes a figure below 25,000 won, the implied 26,000 won average is wrong immediately and the whole observation in this note loses its edge. This is the fastest and most likely way for me to be wrong.
- Within one quarter. If third quarter operating margin falls back below the 7.59 percent full-year figure, the half-year improvement to 8.25 percent was event-driven and the forward estimate of 2,972 won per share has to come down. The consensus would then come down to the price instead of the price going up to meet it.
- Possibly never. Nobody publishes which firms make up a consensus screen or when each last revised. If that stays true, I will never learn whether the four figures I inferred were four real notes or an artifact of how the screen averages. A conclusion that cannot be checked is worse than one that turns out wrong.
Two related notes from this journal. A company where one quarter decides the entire year is examined in a Korean education name whose two published estimates went unrevised through a weak half, which is the same problem of stale sell-side figures approached from the opposite side. And the question of what a top line actually measures when volume and unit economics move apart appears in a drama producer whose episode count rose 88 percent while revenue per episode fell.
Prices and multiples reflect the September 11, 2026 close as I checked them at the time of writing. This note may publish on a later date, so the figures can differ from live quotes. Korean won is the reference currency; dollar figures here are approximate, at 1,341.59 won per dollar on the same session. Brokerage figures were read from Korean press summaries, including the KB note briefing and the Samsung Securities briefing, not from the original reports. Anything marked as my calculation was computed by me from the figures cited beside it.