RFHIC Stock Grew Its Profit 45% and Its Cash Went Negative
I expected the cash line to follow the profit line. When I opened the half-year filing for RFHIC stock I had already seen the headline figures, and I assumed the cash statement would say a louder version of the same thing. It said the opposite, and I spent the rest of that sitting working out why. The filings I worked from are the ones the company posts on its own investor page.
RFHIC (KOSDAQ: 218410) makes gallium nitride transistors and RF power amplifiers. KOSDAQ is the smaller of Korea’s two main equity markets, the venue where technology and component makers list when they are too small for the KOSPI main board. The company closed at ₩45,000 on Tuesday, September 1, 2026, for a market value of about ₩1,195.9bn, roughly $873m.
| What I compared | The two standalone quarters of 2026 so far, on four lines each |
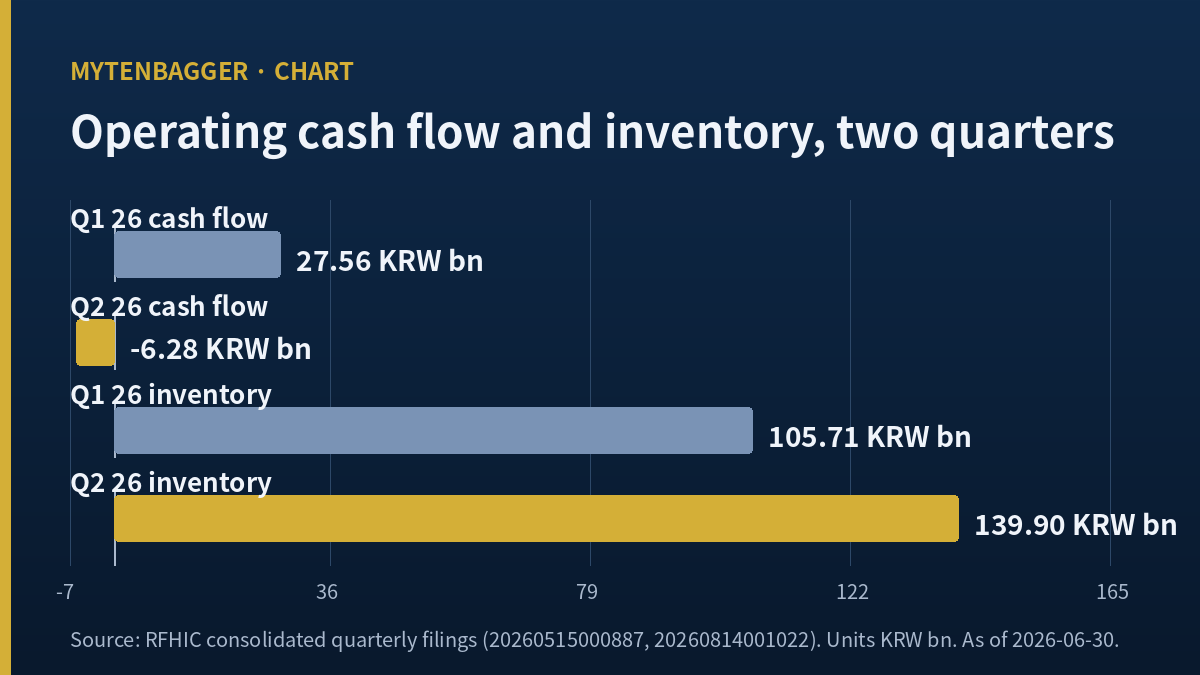
| What came out | Q2 revenue up 19.58% and operating profit up 44.59% over Q1, while operating cash flow moved from +₩27.56bn to −₩6.28bn |
| The arithmetic that closes it | Cash flow swung ₩33.83bn. Inventory rose ₩34.19bn in the same quarter. The residual is ₩0.36bn |
| Where I stand | No position, no order, watching. I am not treating one quarter of working capital as a verdict |
What RFHIC Stock Did to Its Cash Line in the June Quarter
The four lines, side by side
Everything below comes from the consolidated statements in the company’s own regulatory filings, converted from the reported won figures into billions for readability. The standalone quarterly figures are the ones the filing marks as discrete, so no cumulative arithmetic of mine is involved in the first four rows.
| Standalone quarter | Q1 2026 | Q2 2026 | Change |
|---|---|---|---|
| Revenue (₩bn) | 43.07 | 51.50 | +19.58% |
| Operating profit (₩bn) | 7.74 | 11.19 | +44.59% |
| Operating margin | 17.96% | 21.72% | +3.76pp |
| Operating cash flow (₩bn) | +27.56 | −6.28 | −33.83 |
| Inventory, period end (₩bn) | 105.71 | 139.90 | +34.19 |
Source: RFHIC consolidated quarterly filings, receipt numbers 20260515000887 (Q1) and 20260814001022 (H1). Won figures rounded to two decimals in billions. The percentage changes and the operating margins in this table are mine, computed from the reported won amounts. The Korean won is the reference currency here.
The number that made me stop
Before going further I should say what this quarter was not. Its operating profit of ₩11.19bn is the second largest of the sixteen quarters I can see in the filings, from September 2022 forward; the December 2025 quarter was larger at ₩11.49bn, and that quarter’s revenue was larger too. So this is a strong quarter that falls short of the peak, and the cash observation holds either way.
Cash flow moved ₩33.83bn between those two quarters, about $24.7m. Inventory rose ₩34.19bn over the same three months, about $24.9m. The difference between those two figures is ₩0.36bn, which is 1.06% of the inventory build.
I am not claiming a causal identity from one quarter of data. Working capital has receivables and payables in it too, and I did not decompose them. What I can say is that if I wanted a single line on the balance sheet to explain where the operating cash went, this one absorbs almost all of it before I have to reach for anything else.
Why the profit line and the cash line disagreed
A component maker that ships into defense programs builds to schedule, and the schedule belongs to the customer. If product is finished but not yet shipped, revenue has not been recognized on it and the cash has not arrived, but the cost of building it has already left the company. That is the shape I would expect behind these two rows.
I want to be careful here. That is a description of a mechanism, and I have not confirmed that this mechanism is what happened. I have a corroborating fact and I will get to it below, but the fact came from a brokerage note and not from the company.
The half-year picture on inventory
Stepping back one quarter further makes the build look less like a single event. Inventory closed 2025 at ₩88.71bn. It stood at ₩139.90bn on June 30, 2026, an increase of 57.71% in six months against a business that grew, but not by that much.
There is a second reference point worth putting next to it. In a note published on Tuesday, June 9, 2026, Hana Securities carried a 2026 year-end inventory estimate of ₩124.3bn. The actual June figure is already above that full-year estimate by 12.6%. Whether that is a modeling miss or an inventory position the model did not anticipate, I cannot tell from outside.
The same build expressed as days
Converting the balance into days of the quarter’s own revenue changes the shape of the question. On the December 2025 quarter the position was equivalent to 117.3 days. On the March 2026 quarter it was 223.4 days, and on the June 2026 quarter 247.2 days. Those are my own calculation, each quarter taken as 91 days and divided by that quarter’s standalone revenue. Using a running total as the denominator would make any inventory position look progressively lighter as the year goes on, which is why I avoided it.
One caution before reading anything into that. Most of the December-to-March move came from the denominator: standalone revenue fell 37.39% between those two quarters while inventory itself rose 19.17%. So the jump from 117.3 days to 223.4 days is largely a revenue effect and only partly an inventory effect.
Even allowing for that, the June quarter is the third reading in a rising sequence. It cuts against the cleanest version of the timing explanation, because one delayed shipment in June does not account for a position that already sat at 223.4 days in March. Something was accumulating before the shipment slipped, and I do not know from the filings whether that something was orders in hand or inventory built on expectation.
So I am holding both readings, with the weight on timing and the March figure keeping the other one open. The one thing they agree on is that the September quarter settles it. A position at 247.2 days either unwinds against a bigger revenue quarter or it does not, and that is visible in a single filing.
The corroborating fact, and its source
Shinhan Investment Securities published a note on Tuesday, July 28, 2026, that addressed the second-quarter miss against consensus directly. The quarter’s headline figures had reached Korean press as preliminary numbers the day before that note. Its explanation, as the Korean-language note framed it, was that a shipment of power amplifiers destined for Raytheon slipped from June into July.
If that is right, then some of what sat in inventory on June 30 left the building in the following weeks, and the cash follows it. That would make the second quarter a timing artifact and nothing more. This is the reading I lean toward, though the March days figure below keeps me from settling on it. I also notice that it is the reading most convenient to anyone already long the shares, which is why the alternative goes in the objections section with everything else that cuts against me.
The customer relationship behind that shipment
The Raytheon connection is not incidental to how I read this company. On Thursday, February 19, 2026, Korean press reported a ₩50.6bn power amplifier supply contract with Raytheon Canada, running from February 2026 through February 2027, roughly $36.9m at the reference rate used here. A week earlier, on Thursday, February 12, 2026, the company was reported to have won ₩18.7bn of high-output RF amplifier systems for a fourth-generation synchrotron radiation accelerator.
Shinhan’s July note put cumulative Raytheon-bound orders at ₩72.0bn. That is a meaningful fraction of a company whose full-year 2025 revenue was ₩185.8bn, and it is concentrated enough that one customer’s delivery calendar can move a quarter.
What the company will and will not tell you
The segment disclosure here works at the device level and stops there, without reaching the end market. The filings split revenue into GaN power amplifiers, GaN transistors, and, starting in the first half of 2026, GaN monolithic microwave integrated circuits. For the first half of 2026 those were ₩59.27bn, ₩31.98bn and ₩0.24bn. Those three lines add to ₩91.49bn against a half-year total of ₩94.57bn, so ₩3.08bn sits outside the product breakdown and the filing does not say what it is.
What is not disclosed is how much comes from defense versus telecom versus satellite. Every figure I have seen on that split is a brokerage estimate, and I have kept those out of my own arithmetic. Yujin Investment Securities, in a note dated Tuesday, January 27, 2026, put defense operating margins at 30% to 40% and telecom at 10% to 15%. I quote that as a direction, since it is not a figure I can check.
Capital spending has come down a long way
One thing that argues against reading the negative quarter as distress is where the money was going in earlier years. Capital expenditure ran at ₩42.54bn in 2023 and ₩23.48bn in 2022, both years in which free cash flow was negative. In the first half of 2026 capital expenditure was ₩4.97bn across both quarters combined.
So the cash that left in the June quarter did not leave through the plant. It went into working capital, which is a reversible place for it to be, unlike a building.
How I would know I was wrong about this
If the inventory build is delivery timing, the September quarter should show the mirror image. Cash comes back in, inventory comes down or at least stops climbing, and the two lines resume agreeing. If instead inventory holds above ₩139.90bn while quarterly revenue stays near ₩51bn, then what I have called timing is something slower.
What this company looked like from inside somebody else’s table
I have had this name in front of me before, in a different role. When I worked through a Korean base-station component maker whose interest bill stayed flat while its revenue halved, I built a comparison table and RFHIC sat in one row of it, as the one company on the same exchange in the same product category still posting a positive margin. One number was all I needed from it then.
Reading a company as a row and reading it as a subject are different jobs. As a row it was a margin. As a subject the first thing I found was that the margin is young, and the second was that the quarter carrying the best version of it is also the quarter the cash left.
Where RFHIC Stock Sits Against Companies in the Same Materials
The inventory line taught me something about my own reading order
The inventory line is one I habitually read last, as a hygiene check after the income statement has already told me what I think. Doing it in that order here would have produced a note about margin expansion and nothing else. I only found the offsetting figure because the cash statement contradicted what I had already decided, and I dislike how close I came to writing the version where it did not. I have made the same correction once before, on a company whose record quarter sent me to the inventory line before anything else, which makes this the second time the order I read in has cost me the first draft.
How I chose the comparison set, and the thing I found while choosing
I set out to list companies making RF gallium nitride devices, and the exercise broke on its first name. Wolfspeed is the company most often filed under GaN RF, and it has not been in that business since August 2023, when it sold the entire RF unit, including a 100mm GaN wafer fab in North Carolina, to MACOM for about $125m in cash and stock.
So the obvious peer had already handed the assets to another company on my list. I decided not to drop either of them. Both stay in the table, marked as seller and buyer, because the interesting question is which side of that transaction the current numbers belong to.
| Company | Basis, as of | Revenue growth | Operating margin |
|---|---|---|---|
| MACOM (buyer of the RF unit, 2023) | TTM to Jul 3, 2026 | +28.36% | +18.19% |
| Wolfspeed (seller of the RF unit, 2023) | TTM, FY end Jun 28, 2026 | −12.21% | −68.55% |
| NXP Semiconductors | TTM to Jun 28, 2026 | +8.77% | +32.94% |
| Infineon Technologies | TTM to Jun 30, 2026 | +6.50% | +12.15% |
| Sumitomo Electric | TTM to Jun 30, 2026 | +12.30% | +8.60% |
| Mitsubishi Electric | TTM to Jun 30, 2026 | +9.57% | +7.12% |
| Navitas Semiconductor | TTM to Jun 30, 2026 | −46.40% | −252.33% |
| RFHIC | FY2025, Dec 31, 2025 | +61.74% | +16.62% |
| RFHIC | Standalone quarter to Jun 30, 2026 | n/a | +21.72% |
Peer figures from stockanalysis.com company pages, each on the basis stated in its own row; the as-of dates differ and I have not adjusted for that. RFHIC’s own rows come from its regulatory filings. Ampleon belongs in this category on product grounds and is privately held with no published financials, so it has no row. None of these companies discloses gallium nitride as a reportable segment, which means no row here isolates the GaN business; each is the whole company. The Wolfspeed sale figure of about $125m comes from the company’s announcement of August 22, 2023.
Reading the table with that transaction in mind
MACOM’s trailing revenue growth of 28.36% and margin of 18.19% include assets it did not own three years ago. Wolfspeed’s −68.55% margin belongs to a silicon carbide power business, which is a different fight. Anyone using Wolfspeed as a GaN RF benchmark today is measuring against a company that left.
Against MACOM, the one on this list that actually bought into the category, RFHIC grew 2.18 times as fast in its last full year and carried an operating margin 1.57 percentage points lower. In the June 2026 standalone quarter the margin gap closes and reverses, though a single quarter against a trailing twelve months is not a fair comparison and I am flagging it as such.
The seven objections I would raise against my own reading
These are in the order that they bother me.
One. The residual of ₩0.36bn is arithmetic and falls short of proof. Two unrelated quantities can land close together, and I did not decompose receivables or payables to see what else moved. Two. One quarter of cash flow is one observation. This company has posted negative operating cash flow in individual quarters before, including in 2022 and 2023. Three. The shipment-slip explanation reached me through a brokerage note and the company has not said it in its own filings. Four. Inventory above ₩139.90bn could reflect building ahead of orders that do not arrive, and from outside I cannot separate that from building ahead of orders that do. Five. The 2026 margin figures rest on a business mix I cannot verify, because end-market revenue is not disclosed. Six. Two consolidated subsidiaries are themselves listed, so consolidated cash and inventory include amounts other shareholders have a claim on. Seven. The peer table mixes reporting periods and no row in it isolates the product line this company actually sells.
A separate question I have not answered
There is a larger open item on this company that has nothing to do with cash flow, and readers of the Korean-language edition of this journal will have seen me spend most of that piece on it. Across the four fiscal years to 2025, net income was well above operating profit in three of them. I could not identify the non-operating item responsible, and that gap sits under the earnings base that any multiple on this company rests on. I mention it here because it would be dishonest to present the cash question as the only thing I do not know.
The condition I am watching, and the date that condition expires
| When | What I check | What would end this reading |
|---|---|---|
| Q3 2026 filing, statutory deadline Sunday, November 15, 2026, so in practice from Monday, November 16, 2026 | Standalone Q3 operating cash flow and period-end inventory | Cash back above zero with inventory flat or lower makes the June quarter a timing artifact and closes this |
| Same filing | Whether inventory holds above ₩139.90bn on roughly flat revenue | That would make it something slower than timing, and I would stop calling it working capital |
| This test expires when the full-year 2026 results are published. After that, quarter-to-quarter inventory levels stop being the right instrument, because I will have four quarters of one year against four of the next. From that point I replace this test with inventory turnover measured on a full-year basis, which is the measure that survives the seasonality I currently cannot see. | ||
I am attaching an expiry to the test on purpose. A condition with no end date quietly becomes a condition I keep applying after it has stopped measuring anything, and I would rather write down now which instrument replaces it than decide that later when I already have a view.
Where I actually am
No position and no order. RFHIC stock is on my watch list and not in my account, and the reason is not the price. It is that I have two open questions on this company, one about where three years of net income came from and one about where a quarter of operating cash went, and the second has a filing date attached while the first does not.
Prices and market value reflect the Tuesday, September 1, 2026 close as I saw it while writing, so live quotes will have moved away from it. Dollar figures are approximate, converted at about ₩1,370.4 per dollar, the Seoul market close on the same date as reported by Korean financial press. Korean won is the reference currency throughout and every dollar amount here is a convenience conversion.