APR Corporation Q2 Results: Inventory Growth Versus Cash Flow
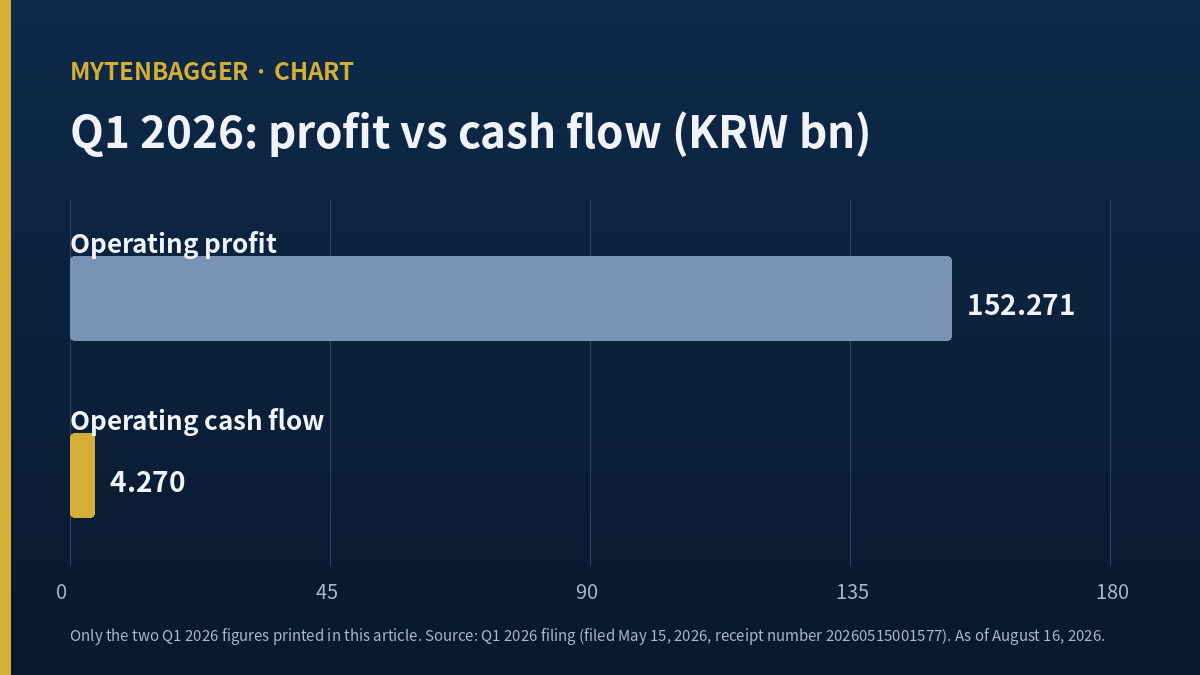
In May I opened the Q1 2026 filing for APR Corporation stock and drew a question mark beside one line of the cash flow statement. The quarter had produced KRW 152.271 billion of operating profit, roughly USD 107.36 million, and KRW 4.270 billion of operating cash flow, about USD 3.01 million. That is 2.80 percent. Inventory on the balance sheet had grown by KRW 82.844 billion, near USD 58.41 million, over the same three months. I did not settle what those two numbers meant. On August 5 the company reported the following quarter, and part of the answer arrived.
What I wrote in May, and what August settled
| May 2026, reading the Q1 filing | August 2026, after the Q2 release |
|---|---|
| Inventory up KRW 82.844 billion. Unsold goods or goods built ahead of demand, I could not tell | Q2 revenue KRW 767.5 billion, 29.35 percent above Q1. Built ahead of demand |
| Operating cash flow KRW 4.270 billion, 2.80 percent of operating profit | The Q2 cash flow statement requires the half-year filing. I have not seen it |
| Watch whether the 25.66 percent operating margin holds | It fell to 24.83 percent. Revenue rose 29.35 percent, operating profit rose 25.17 percent |
| Stance: watching, not owned | Still watching, unowned. The falsification test changed; the stance did not |
Price basis: KRW 390,500 at the August 14, 2026 close, the last Korean trading session before this was written, since August 15 is a national holiday. Currency basis: USD/KRW 1,418.3 at the August 14, 2026 onshore close.
Contents
The line I drew a question mark beside in May
The Q1 2026 report was filed on May 15, 2026 under receipt number 20260515001577. Read only the income statement and the quarter is spotless. Revenue KRW 593.355 billion (USD 418.36 million), operating profit KRW 152.271 billion (USD 107.36 million), operating margin 25.66 percent. All three are the highest this company has recorded.
The cash flow statement in the same document reads differently. Operating cash flow for the quarter was KRW 4.270 billion (USD 3.01 million). Subtract capital expenditure of KRW 5.072 billion (USD 3.58 million) and free cash flow is negative KRW 802 million, about negative USD 0.57 million. The immediately preceding quarter, Q4 2025, produced KRW 156.069 billion of operating cash flow. I once read the same negative sign at a Korean outdoor apparel manufacturer where four of the last five first halves ran an operating cash outflow, and there the repetition meant the sign said nothing about whether the year had been good or bad.
Dividing the two numbers
KRW 4.270 billion divided by KRW 152.271 billion is 2.80 percent. That is the share of one quarter’s operating profit that stayed behind as cash from operations. I recalculated it three times because I assumed I had misread an account line.
Then I looked at inventory on the same balance sheet. It moved from KRW 165.457 billion at the end of 2025 to KRW 248.301 billion at the end of March 2026, an increase of KRW 82.844 billion. That increase equals 54.41 percent of the quarter’s operating profit of KRW 152.271 billion. Expressed as turnover, the days it takes inventory to convert into revenue went from 27.5 to 38.1, a rise of 10.59 days. I derived those day counts myself by dividing each quarter’s ending inventory by that quarter’s standalone revenue and multiplying by 91.
That was everything I could establish in May. Cash did not follow profit, and something of comparable size had moved into inventory. The problem is that this picture supports two opposite readings. A company that has built goods it is about to sell and a company holding goods nobody bought look identical on a balance sheet. I left it open and waited for the next quarter.
APR Corporation stock at 390,500 won and the market value it builds
The August 14, 2026 close was KRW 390,500, roughly USD 275.33. August 15 is Liberation Day in South Korea and August 16 is a Sunday, so every price in this article is the August 14 figure. Multiplying by shares outstanding closes the market value to the last won.
KRW 390,500 times 37,438,156 shares is KRW 14,619,599,918,000, or KRW 14.62 trillion, about USD 10.31 billion. The vendor screen displays KRW 14,619.6 billion, and the two agree. The share count itself has two versions: Kiwoom data says 37,438,156 while the Korean company-data service WiseReport shows 37,438,155, a difference of one share. One share moves market value by KRW 390,500, which disappears in any rounding, so this article uses the Kiwoom figure and records that the two sources differ.
Five inputs behind the market value
| Input | Value | How I checked it |
|---|---|---|
| Share price, August 14, 2026 close | KRW 390,500 | Kiwoom data, matching the final daily bar |
| Shares outstanding | 37,438,156 | WiseReport shows one share fewer |
| Market value, derived | KRW 14.62 trillion | Price times share count, or USD 10.31 billion |
| Trailing price to earnings | 50.68x | 390,500 divided by KRW 7,705.21 of earnings per share |
| Price to book | 32.79x | 390,500 divided by KRW 11,910 of book value per share |
On the seven-metric screening checklist this name passes five of seven for a score of 71. The two it fails are price to earnings, which the screen wants below 15, and price to book, which the screen wants below 3 for cosmetics companies. Revenue scale, the 23.93 percent operating margin, positive earnings per share, return on equity and positive operating profit all pass. Two readings that call the shares expensive and five that call the business good sit on the same screen.
Two return-on-equity figures on one screen, and only one fits the multiples
This is where I caught something. The Kiwoom screen reports return on equity of 75.3 percent. Computing it from the 2025 annual report filed under receipt number 20260323001257 gives 64.97 percent, dividing net income of KRW 289.654 billion by closing total equity of KRW 445.799 billion. The two are more than ten points apart.
I let the multiples decide which one to keep
Price to book divided by price to earnings returns return on equity. Both multiples carry the same share price above the division line, so the price cancels and earnings per share over book value per share is what remains. So I divided.
32.79 divided by 50.68 is 64.70 percent. The filing-derived 64.97 percent sits 0.27 points away. The Kiwoom screen’s 75.3 percent sits 10.6 points away. Of three numbers printed side by side on one screen, only the return-on-equity field disagrees with the other two, so this article uses 64.97 percent and drops 75.3 percent.
The check told me one more thing. The 32.79x price to book on this name cannot be read as a verdict independent of the 50.68x price to earnings. Knowing either one plus return on equity produces the other by arithmetic. What actually needs judging here is whether 64.97 percent is still 64.97 percent next quarter. I once decomposed a Korean cosmetics manufacturer’s return on equity into leverage and the decomposition produced the answer. This time the arithmetic only decided which source file to trust.
What the second quarter did with the inventory behind APR Corporation stock
On August 5, 2026 the company released preliminary Q2 results: revenue KRW 767.5 billion (USD 541.14 million), operating profit KRW 190.6 billion (USD 134.39 million), operating margin 24.8 percent. First-half revenue came to KRW 1,360.9 billion, close to USD 959.53 million.
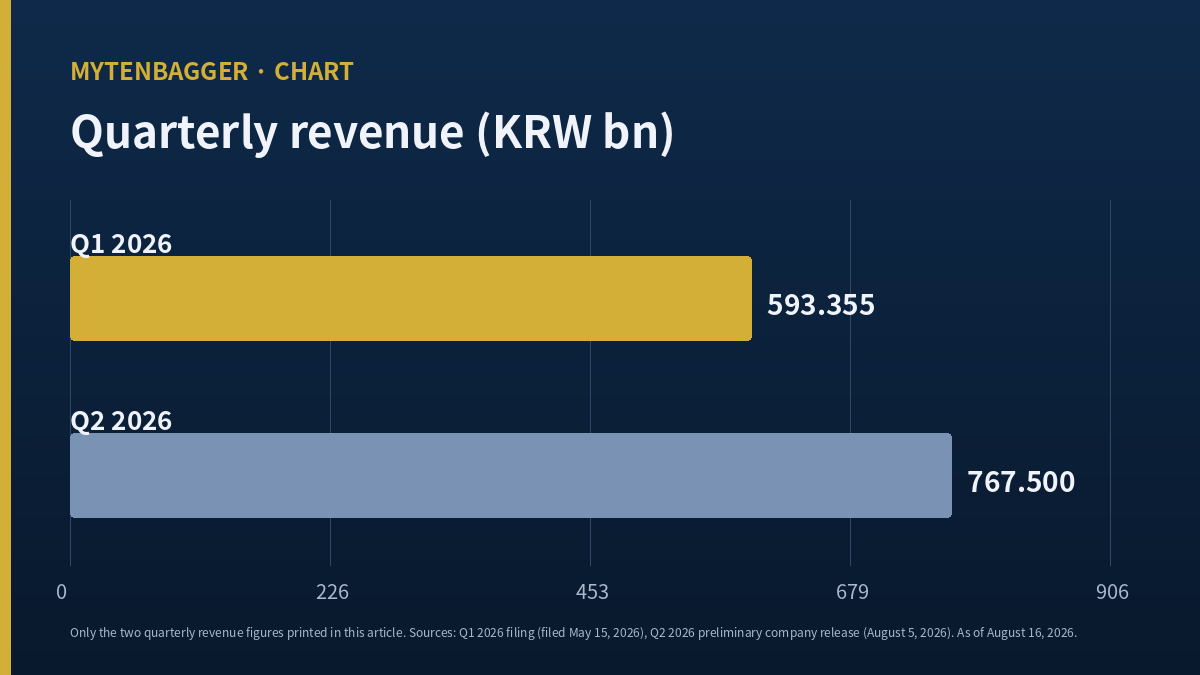
My first move was to test whether the filing series and the company release close on each other. Q1 revenue of KRW 593.355 billion plus Q2 revenue of KRW 767.5 billion is KRW 1,360.855 billion, and the company’s first-half figure of KRW 1,360.9 billion lands on it. The two series are describing the same six months of the same company.
Up 29.35 percent on the prior quarter
Q2 revenue of KRW 767.5 billion is 29.35 percent above Q1’s KRW 593.355 billion. Laying six quarters of sequential growth side by side gives 8.93, 23.19, 17.76 and 41.90 percent through 2025, then 8.35 percent in Q1 2026 and 29.35 percent in Q2. The 8.35 percent quarter was the weakest of the six, and that is the quarter inventory rose by KRW 82.844 billion.
Then revenue jumped 29.35 percent. That erased one of my May question marks. The Q1 inventory was goods heading out the door in Q2, and the reading where sales had stalled and stock piled up ends here. A stalled-demand quarter does not hand the next quarter a number like that.
I want to be exact about what kind of conclusion this is. I inferred it from an outcome. I did not read it off a statement. The Q2 balance sheet and cash flow statement need the half-year report, whose statutory deadline is August 15, 2026, a Saturday that is also a national holiday, which should push filing to Monday August 17. As I write this I have seen neither the Q2 closing inventory balance nor Q2 operating cash flow.
The 0.83 points APR Corporation stock gave back
The same release left the second question mark standing, and attached a price to it.
Q2 revenue rose 29.35 percent over the prior quarter while operating profit rose from KRW 152.271 billion to KRW 190.6 billion, an increase of 25.17 percent. Revenue growth exceeded profit growth by 4.18 points, and that difference lands in the margin. The operating margin went from 25.66 percent in Q1 to 24.83 percent in Q2, down 0.83 points. My 24.83 percent comes from dividing KRW 190.6 billion by KRW 767.5 billion and meets the company’s stated 24.8 percent below the decimal.
What the Q1 inventory sold for
Put the two sentences together and the shape is this. The KRW 82.844 billion that accumulated in Q1 went out as revenue in Q2, and on the way out it took 0.83 points of margin with it. The goods built ahead of demand did not leave at full price.
If 0.83 points sounds small, convert it. Had the Q1 operating margin of 25.6627 percent held into Q2, operating profit would have been KRW 196.961 billion, which I derived by applying that margin to KRW 767.5 billion of revenue. Against the reported KRW 190.6 billion the difference is KRW 6.361 billion, roughly USD 4.48 million, in a single quarter.
Why the margin slipped is not something this release settles. Selling prices may have come down, overseas logistics and tariff costs may have risen, or marketing spend behind the North American and European push may have grown. Splitting those three requires the selling and administrative expense breakdown in the half-year report. When I followed a flat margin through a quarter where revenue grew 39.8 percent at another Korean cosmetics maker, the answer came from the operating expense side, with cost of goods holding steady.
What the company actually spent to grow
When revenue more than doubles in two years I want to know what produced the growth, because growth bought with plant behaves differently in the following quarter than growth bought with product.
| Year | Revenue (KRW bn) | Capex (KRW bn) | Capex to revenue | Operating margin |
|---|---|---|---|---|
| 2022 | 397.698 | 5.699 | 1.433% | 9.86% |
| 2023 | 523.809 | 9.658 | 1.844% | 19.89% |
| 2024 | 722.753 | 45.033 | 6.231% | 16.98% |
| 2025 | 1,527.344 | 15.411 | 1.009% | 23.93% |
The heaviest investment year is not the biggest growth year
Capital expenditure peaked in 2024 at KRW 45.033 billion (USD 31.75 million). Revenue grew most in 2025, from KRW 722.753 billion to KRW 1,527.344 billion, an increase of 111.32 percent. Capex in that 2025 year was KRW 15.411 billion (USD 10.87 million), or 1.009 percent of revenue, roughly a third of what the company spent in 2024.
Compound revenue growth from 2022 to 2025 works out to 56.60 percent a year. The plant spending behind it totals KRW 75.801 billion (USD 53.44 million) across all four years, which is 4.96 percent of 2025 revenue alone. Whatever produced this growth, it was not a factory.
Which means the next quarter of this name turns on the two things above instead of on utilization: whether the goods already built sell, and whether they sell at the same margin. I recently looked at a Korean logistics company where capital spending ran above annual operating profit, and the contrast is the point. Two companies can both be growing while the money leaves through completely different doors, and the door decides which line you have to watch.
Seven things I put on the other side of APR Corporation stock
Everything above is the constructive case. The other side gets the same weight. There are seven items.
One, Asia is the only region not growing
The company’s Q2 regional disclosure reads: North America KRW 376.3 billion (USD 265.32 million), up 264.6 percent year on year; Europe KRW 145.1 billion (USD 102.31 million), up 380.3 percent; Asia KRW 121.1 billion (USD 85.38 million), up 14.5 percent; other regions KRW 61.7 billion (USD 43.50 million), up 325 percent. Asia’s 14.5 percent is an order of magnitude below the rest, and Asia is where this company started.
Two, two record quarters and a negative three-month return
The August 14, 2026 close of KRW 390,500 is 17.44 percent below the 250-session high of KRW 473,000. The three-month return is negative 8.12 percent. Over the same window the twelve-month return is positive 127.03 percent and the six-month is positive 52.24 percent, so the longer numbers are still large. A negative three-month price through a stretch containing two consecutive record quarters reads less like disbelief in the results and more like results already carried in the price.
Three, the profit growth rate differs by 9.08 points depending on the source
The company and the Korean press put Q2 operating profit growth at 134.5 percent year on year. Working it from the 2025 half-year report filed under receipt number 20250814001828 gives something else. Standalone Q2 2025 operating profit was KRW 84.552 billion, and KRW 190.6 billion against that base is 125.42 percent growth. The two differ by 9.08 points.
For 134.5 percent to hold, the prior-year base would have to be KRW 81.279 billion, which I obtained by dividing KRW 190.6 billion by 2.345. The likeliest explanation is that the company measured against its own preliminary release from a year earlier instead of the audited half-year figure that superseded it. I have not confirmed which is correct, so this article prints both and uses the filing series of 125.42 percent in its own sentences. Quietly picking one would be worse than showing the gap.
Four, Q1 free cash flow was negative
As above, free cash flow in Q1 2026 was negative KRW 802 million. The debt-to-equity ratio in the same quarter was 88.12 percent, the highest since 105.53 percent in Q3 2022. Against 59.59 percent in Q2 2025 that is a rise of 28.53 points over three quarters.
Five, the entry-barrier criticism is old but unanswered
The Korean outlet The Fact reported on January 23, 2025 that the technical barrier to entry in beauty devices is not high and that growth could stall as competing products multiply. The same piece said the apparel brand Nerdy had stalled around fifty stores against an original target of a hundred, held back by weakness in China. That is a year and seven months old and the situation may have moved, so I take only the direction of the criticism from it.
Six, competitors are inside the same category
The Korean outlet 1conomy News reported on January 19, 2026, grouping the home beauty-device lines Make-on, LG Pragel and Classys’s premium range as competitive entries into the same market. All three are home-use devices and overlap what this company sells. Reports differ on which parent company each brand belongs to, so I carry only the brand names. This too is a seven-month-old view.
Seven, 32.79 times book is not low on any measure
These are the two checklist items the name fails. The multiple is explicable while return on equity holds at 64.97 percent, but if that return halves the multiple keeps only half its support. I do not yet hold enough material to judge the durability of that return.
How APR Corporation stock compares with e.l.f. Beauty
For a global reference I wanted a company that sells beauty products directly to consumers, carries a growth multiple, and reports in a market where I can verify the figures independently. I chose e.l.f. Beauty (NYSE: ELF), and my selection rule this time was narrow: a company growing at roughly a third of my subject’s rate while carrying nearly twice the earnings multiple, so that the size of the discount applied to a Korean name becomes measurable.
| Measure | APR Corporation | e.l.f. Beauty |
|---|---|---|
| Market value | USD 10.31bn | USD 5.40bn |
| Trailing price to earnings | 50.68x | 91.91x |
| Forward price to earnings | 25.05x | 29.54x |
| Revenue growth | 111.32% (FY2025) | 31.2% (trailing twelve months) |
Where the comparison holds and where it stops
I limited the table to four lines on purpose. The two businesses differ in mix, since one of them sells devices alongside skincare while the other is a color cosmetics and skincare house, so a full ratio-by-ratio comparison would carry more noise than signal.
The e.l.f. Beauty figures come from the August 14, 2026 close of USD 91.44, the same session as my Korean price basis. I reproduced two of them before using them: USD 91.44 times 59.01 million shares gives USD 5.396 billion against the displayed USD 5.40 billion, and USD 91.44 divided by the 91.91 trailing multiple gives USD 0.9949 against the displayed USD 0.99 of trailing earnings per share. Both close, so I kept the rest.
What the table shows is that on earnings the Korean name is the cheaper of the two. It trades at 50.68 times trailing profit against 91.91 for e.l.f. Beauty, so the American company carries 1.81 times the earnings multiple while growing at 28.03 percent of the Korean company’s revenue rate. On forward earnings the gap narrows to 25.05 against 29.54. Where the Korean name is dearer is on assets, at 32.79 times book, and that follows from the payout policy described further down. It does not stand as a separate verdict.
What APR Corporation stock leaves unsettled, and where I stand
These are values I could not obtain or could not reproduce, and therefore did not use. A blank is better than a plausible wrong number.
- Q2 2026 balance sheet and cash flow statement: the half-year report is not filed. Neither the Q2 closing inventory nor Q2 operating cash flow is confirmed. Every Q2 number here comes from the company’s August 5 preliminary release.
- Q2 pre-tax and net income: absent from the company release, which is why this article follows Q2 only as far as the operating line.
- Vendor EBITDA field: it carries 152,271, identical to Q1 2026 operating profit expressed in millions of won. Neither the account nor the unit holds, so I excluded it.
- Vendor total equity field: it shows KRW 260.5 billion, which reproduces against neither the filed Q1 2026 figure of KRW 506.580 billion nor the 2025 year-end figure of KRW 445.799 billion. The debt ratio on the same screen matches the filed Q1 figure exactly, so I kept the derived ratio and discarded the total.
- Vendor cash flow fields: displayed as 4,270 and negative 802 in units of one hundred million won, when the underlying values are in millions. I used the filing figures instead.
- 250-session low: Kiwoom shows KRW 185,200 while WiseReport’s 52-week low is KRW 204,000. The window definitions may differ, so I quote the drawdown from the high only and use no gain-from-low figure.
- Q3 2026 results date: no source found. I do not print a date.
- Brand-level revenue: Q2 figures for Medicube, AGE-R, Nerdy and Forment individually are not in the release. Only the combined cosmetics and beauty segment of KRW 648.3 billion, up 185.5 percent year on year, is public.
Stance and falsification test
Watching, not owned. At KRW 14.62 trillion this is not small enough to fall into an automatic watch-only bucket by size, so I judged the metrics individually and arrived here.
Two things together would move this out of observation. First, the half-year report showing operating cash flow above half of operating profit. If Q1’s 2.80 percent was an inventory effect, the quarter that sold the inventory should show the cash returning. Second, a Q3 operating margin that does not fall below 24.83 percent. Whether the 0.83 points lost between Q1 and Q2 is a one-off or a direction takes one more quarter to separate. SOOP posted a sharper version of the same split in the June 2026 quarter: a 12.16 percent operating margin sitting beside operating cash flow of minus KRW 13.25 billion.
The condition that would tell me my own reading was wrong sits outside the company’s control of the narrative. If the half-year report shows closing inventory above KRW 248.301 billion, I have to rewrite this entire subtraction. It would mean the company produced KRW 767.5 billion of revenue and still finished with more stock than it started with, and the question mark I erased was erased in error. One line of the filing settles it after August 17.
Sources used in this article
- Korean regulatory filings via the Financial Supervisory Service disclosure system. APR Corporation 2025 annual report (receipt 20260323001257), Q1 2026 report (20260515001577) and 2025 half-year report (20250814001828). All annual and quarterly revenue, operating profit, net income, total equity, inventory, capital expenditure and operating cash flow figures come from this series. Standalone quarterly figures are my own derivation, subtracting the prior cumulative filing. dart.fss.or.kr
- Financial News, August 5, 2026, Korean-language report of the Q2 2026 preliminary results with regional and segment revenue. Original article
- Newspim, June 9, 2026, Korean-language report on Hana Securities analyst Park Jong-dae opening coverage. Original article
- Newspim, July 16, 2026, Korean-language report on the interim dividend resolution. Original article
- Global Economic, August 10, 2026, Korean-language summary of five brokerages raising their published valuations and a count of sixteen buy ratings. Original article
- WiseReport company screen for share count, book value per share, earnings per share and the 2026 and 2027 consensus estimates with the contributing institution count. Company screen
- Newsis, August 14, 2026, Korean-language market report giving the USD/KRW onshore close of 1,418.3 used throughout this article. Original article
- The Fact, January 23, 2025, Korean-language piece on beauty-device entry barriers and the Nerdy store rollout. Original article
- 1conomy News, January 19, 2026, Korean-language piece grouping competing home beauty-device lines. Original article
- Stock Analysis for the e.l.f. Beauty figures at the August 14, 2026 close. ELF company page
- Share price, market value, multiples, returns and the checklist score are Kiwoom data on the August 14, 2026 close. Fields I could not reproduce are listed above with the reason I excluded them.
One of the question marks I drew in May is gone. The KRW 82.844 billion that piled up in Q1 sold in Q2, and with it I dropped the reading that demand had stalled. But I did not erase the other one that day, and I have now drawn a third. The one still standing is whether Q1’s 2.80 percent cash conversion was really an inventory effect. The new one sits beside an operating margin that came back at 24.83 percent. Both get settled by the same document, filed sometime after August 17, and I would rather wait for it than guess at it twice.