Hanil Cement Dividend: A 99% Payout as Profit Halved
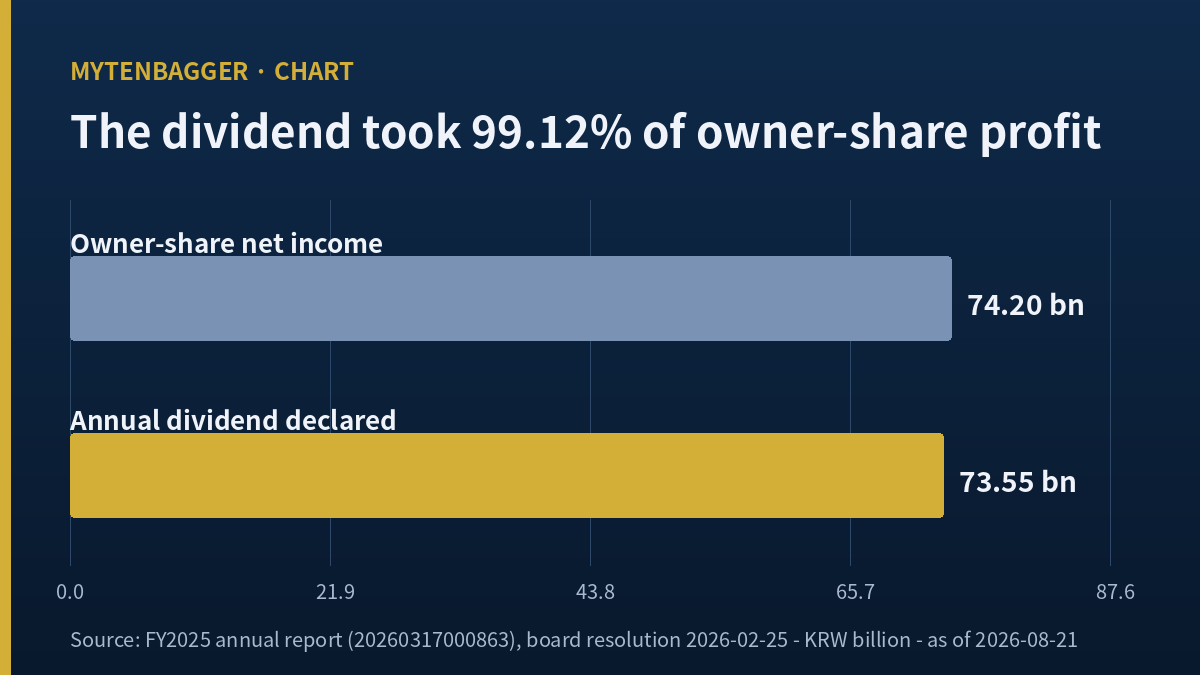
The first question I asked myself about Hanil Cement stock was not about multiples. It was one division. In fiscal 2025 the company reported owner-share net income of KRW 74.20 billion. In the same year, it declared cash dividends totaling KRW 73.55 billion. Divide the second by the first and you get 99.12 percent. Ninety-nine cents of every won the company earned for its shareholders left the company as a dividend.
What I found, in three lines
1) FY2025 owner-share net income of KRW 74.20 billion vs annual dividends of KRW 73.55 billion. Coverage was 99.12 percent on the owner-share base, 90.64 percent on the consolidated total.
2) That same year’s operating profit came in at KRW 132.74 billion, down 51.09 percent from FY2024’s KRW 271.39 billion. The per-share dividend held flat at KRW 1,000.
3) The 6.59 percent trailing dividend yield at today’s price of KRW 15,170 assumes the arithmetic above repeats. I shook that assumption at the third decimal place.
Contents
The Hanil Cement stock price that four years brought back
The stock closed at KRW 15,170 on Thursday, August 20, 2026. I was reading that print before the Friday open in Seoul, about ten hours after the tape. Multiplying by 73,545,209 shares outstanding puts market capitalization at KRW 1.1157 trillion, or roughly USD 0.79 billion at a reference rate of KRW 1,413 per dollar. I did not run a fresh FX print for this piece; I carried the rate my last two pieces used, and the point of this piece does not depend on the third digit of the exchange rate.
The trailing return picture is: negative 28.78 percent over twelve months, negative 16.65 percent over six, negative 3.01 percent over three, and positive 10.65 percent over the last month. The 250-day high is KRW 21,150 and the low is KRW 12,710. From the high, the current level is off 28.27 percent. From the low, it is up 19.35 percent. In August 2022 the stock traded around KRW 15,000. So the company spent two years (2023 and 2024) lifting cement selling prices, pushing its operating margin to 15.58 percent in FY2024, and its shares now trade where they did four years ago. That is the fact I could not walk past.
Hanil Cement stock and a 99.12 percent dividend coverage
The FY2025 final dividend of KRW 1,000 per share was declared by the board on Wednesday, February 25, 2026. Multiplied by 73,545,209 shares outstanding the outlay is KRW 73.55 billion. The consolidated total net income filed with DART (receipt 20260317000863) was KRW 81.14 billion, of which KRW 74.20 billion belongs to the owners of the parent and KRW 6.94 billion sits in non-controlling interest, meaning the subsidiary minority.
Since dividends flow out of the owner-share equity pool, I read the coverage against the owner-share number instead of the consolidated total. That gives 73.55 divided by 74.20, or 99.12 percent. Using the consolidated total instead brings it down to 90.64 percent. Either way, the ratio lands in the high nineties.
Two vendor payout-ratio fields do exist on the screen I used: 94.3 percent and a raw of 28.7 percent. I could not confirm from the vendor documentation which net-income base each uses, so I left both off the record and worked from my own arithmetic instead. When the payout ratio has to be reconstructed by hand it is worth doing the hand work.
Profit halved. The KRW 1,000 dividend did not.
What struck me was less the coverage itself and more how it got there. FY2024 owner-share net income was KRW 184.05 billion. FY2025 came in at KRW 74.20 billion. A drop of 59.7 percent. Across those same two years the per-share dividend was KRW 1,000 in FY2024, KRW 1,000 in FY2025. It held. The absolute amount of the payout kept its size while the earnings under it lost more than half of theirs.
There is a friendly reading of that. A company that keeps its cash return steady through a cyclical trough is signalling something about how it wants to be held by shareholders. Korean coverage of the dividend decision (for example, Seoul Economic Daily’s June 2026 write-up) reads company commentary this way.
There is also an unfriendly reading. If FY2026 owner-share income lands anywhere close to FY2025, coverage crosses one hundred and the dividend is being paid, in effect, out of retained earnings and not out of the year’s profit. That is the reading I put in the counter-argument section below (item 1).
The company does not pay an interim dividend on this stock. The 6.59 percent yield you see printed against KRW 15,170 assumes that the KRW 1,000 once-a-year payment repeats.
Q1 margin of 5.81 percent and Q2 margin of 16.60 percent on the same books
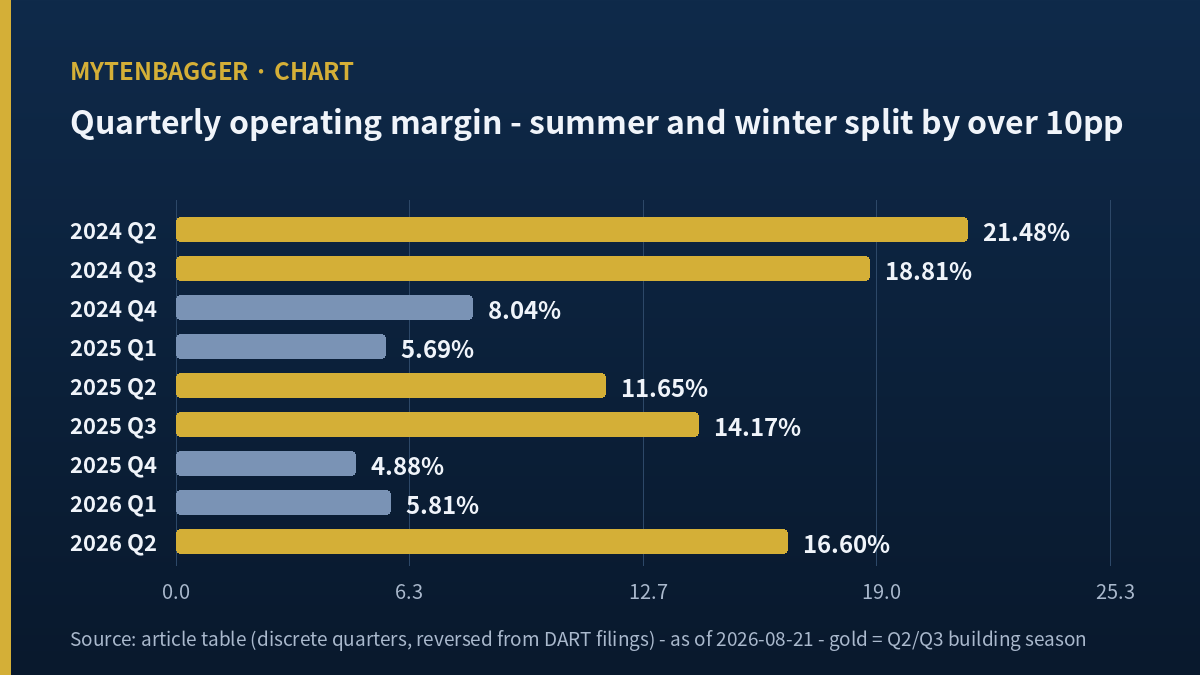
Quarterly operating margins swing hard on this name. Below is a discrete series I rebuilt from the DART filings in KRW billions.
| Quarter | Revenue | Operating profit | Margin |
|---|---|---|---|
| 2024 Q2 | 498.13 | 107.00 | 21.48% |
| 2024 Q3 | 389.40 | 73.26 | 18.81% |
| 2024 Q4 | 442.49 | 35.56 | 8.04% |
| 2025 Q1 | 298.18 | 16.96 | 5.69% |
| 2025 Q2 | 407.65 | 47.50 | 11.65% |
| 2025 Q3 | 357.79 | 50.69 | 14.17% |
| 2025 Q4 | 360.24 | 17.59 | 4.88% |
| 2026 Q1 | 293.03 | 17.03 | 5.81% |
| 2026 Q2 | 370.95 | 61.56 | 16.60% |
Revenue and operating profit in KRW billion. Sums restated in whole won round to the vendor’s headline figures within two won.
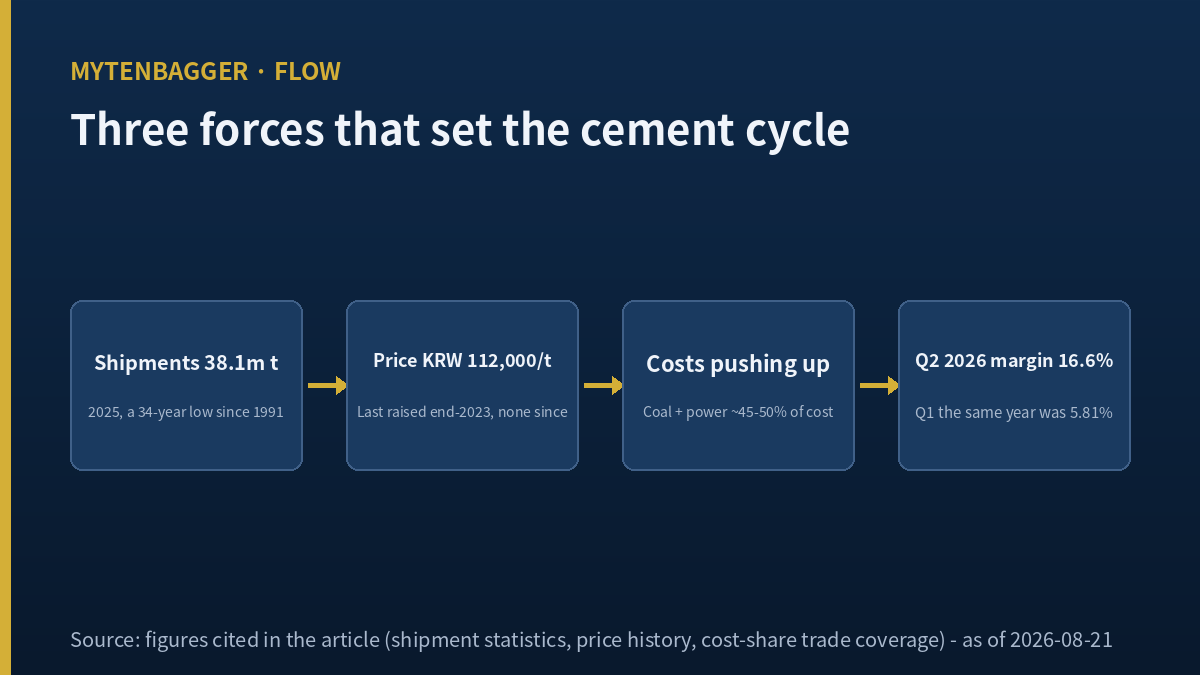
The 16.60 percent margin in the second quarter of 2026 is the first mid-teens print since Q2 of 2024. Then read the row above it: 5.81 percent in the first quarter, 4.88 percent in the fourth of 2025. The table shows a plain seasonal pattern in which the second and third quarters (Korean summer building season) print materially higher margins than the first and fourth (winter, when construction stops). The gap between busy and quiet quarters is more than ten percentage points on this book.
One EBITDA field on the screen I use reads KRW 17.03 billion. That is the same, to the won, as the 2026 Q1 discrete operating profit of KRW 17.03 billion. The field appears to fall back to the latest quarter’s operating profit when the underlying depreciation-adjusted figure is unavailable. I kept it out of any coverage-ratio calculation for that reason.
The 2026 first half read differently by revenue and by profit
First-half 2026 revenue came in at KRW 663.98 billion, down 5.93 percent from KRW 705.82 billion a year earlier. First-half operating profit was KRW 78.59 billion, up 21.93 percent from KRW 64.45 billion. Margin moved from 9.13 percent to 11.84 percent. Revenue shrank and operating profit grew, which happens when a cyclical name gets its selling price to hold while volume slips. But whether that mix repeats in the second half is a question the same table cannot answer. In 2025 a Q3 margin of 14.17 percent was followed straight away by a Q4 margin of 4.88 percent. I put the third-quarter print, due in mid-November, on the trigger list for this piece and not folded into a forecast.
Hanil Cement stock and the four million shares merger delivered
The share count matters here because a company-changing event landed in the middle of the earnings series. According to CEO Score Daily’s coverage from July 2025, Hanil Cement absorbed its subsidiary Hanil Hyundai Cement in a merger effective November 1, 2025. Pre-merger shares outstanding stood at 69.26 million. Post-merger the count is 73,545,209. That is 4,283,669 new shares issued, up 6.18 percent.
The 10-to-1 face-value split of 2021 (from KRW 5,000 to KRW 500, listed September 13, 2021) sits further back in the record. It shows up if you line up the 2020 DPS of KRW 5,100 against the 2021 DPS of KRW 540. This piece works only with post-split years so the ratio never confuses.
The merger cuts two ways for this stock. The same earnings pool gets divided across a share count that is 6.18 percent larger, so per-share earnings are pushed down by that amount. But the same coverage also puts combined domestic cement market share at 21.76 percent, which took Hanil past the 21.2 percent held by former leader Ssangyong C&E and made this company the largest domestic cement supplier by volume. Whether the sell-side and index-screen figures reflect the pre-merger or post-merger share count matters, since a 6.18 percent shift shows up in every per-share ratio.
Reconciling to the vendor’s per-share number
Owner-share net income of KRW 74.20 billion divided by 73,545,209 shares gives KRW 1,008.90 per share. The screen shows KRW 1,061, tagged with an eps_basis flag of computed_price_div_per (that is, price divided by PER, so it is a derived number). Reversing the printed 14.3x P/E out of KRW 15,170 gives implied net income of KRW 78.03 billion, which sits between the owner-share KRW 74.20 billion and the consolidated KRW 81.14 billion and is closer to the latter. The vendor’s P/E is likely computed against the consolidated total. My hand-computed multiples come out at 15.04 times on the owner-share base and 13.75 times on the consolidated one. All three sit in the mid-teens; the differences in the fourth digit are where the base changes.
The Korean sell side wrote KRW 19,000 to KRW 20,000
Coverage of this stock is thin but not empty. The WISEfn corporate monitor screen (as of August 19, 2026) lists two named houses. Hyundai Motor Securities put a KRW 19,000 valuation on the shares and Shinhan Investment carried KRW 20,000. The consensus average valuation on the same screen was KRW 19,500. Consensus 2026E EPS was KRW 952 and the resulting forward PER was around 16 times. The number of contributing houses is not shown on that screen; the two names above cover most of what is public. This piece treats the consensus as a two-to-three house read.
Against the closing price of KRW 15,170, the KRW 19,500 average sits 28.54 percent higher. The stated rationale in the Korean-language write-ups of these two houses is a 2027 turnaround, not a 2026 acceleration. Shinhan Investment’s sector note (August 2026) frames it as construction starts recovering this year, cement shipments rising in the second half of this year, and the earnings pass-through arriving in 2027.
Multiplying the KRW 952 consensus EPS by 73,545,209 shares yields KRW 70.02 billion in owner-share earnings. That number is 5.64 percent lower than the KRW 74.20 billion the company earned in 2025. So the consensus quietly assumes 2026 owner-share income falls a little further before the 2027 recovery. In that world, coverage of the KRW 73.55 billion dividend goes above one hundred percent for a year unless the dividend itself is cut. The sell side is not saying that out loud; I say it here because the arithmetic follows from their own EPS estimate.
Cement selling prices, coal, and what I could not check
Korean cement demand hit a 34-year low in 2025 at roughly 38.1 million tonnes, per a Korean trade outlet review. Industry estimates put 2026 volume around 36 million tonnes. Nominal utilization at major plants sits in the mid-fifty percent range. The last industry-wide price increase (to KRW 112,000 per tonne) landed at the end of 2023 and Korean construction associations have since been pushing for a KRW 11,200 per tonne cut. On the cost side, thermal coal is up more than twenty percent from the start of 2026 and industrial power tariffs stepped from KRW 165.8 to KRW 182.7 per kilowatt-hour (roughly plus 10.2 percent). Coal and power together account for something like forty-five to fifty percent of manufacturing cost, per trade coverage.
What I did not find in my available sources: whether a 2026 selling-price change (up or down) has been formally settled, and whether any of the recent ninety days have produced order awards, capex commitments or treasury-share activity of note. Direct filings pages (DART and KIND) were blocked to my crawler, and the wire summaries I could reach did not carry those items. The industry sketch above is qualitative on purpose. I did not fold volume-times-price estimates into any 2026 model in this piece.
Hanil Cement stock next to its domestic peers
Domestic listed cement peers, taken with dividend yield as the leading column and multiples deliberately left aside since profits are still recovering from trough figures. Ssangyong C&E, formerly the volume leader, was taken private by Hahn & Co. in July 2024, which is why it is missing from the list.
| Company | Close (KRW) | Market cap (KRW bn) | Trailing dividend yield |
|---|---|---|---|
| Hanil Cement (300720) | 15,170 | 1,115.7 | 6.59% |
| Asia Cement (183190) | 9,780 | 351.8 | 1.66% |
| Sampyo Cement (038500) | 7,710 | 832.0 | 1.57% |
| Sungshin Cement (004980) | 8,050 | 581.2 | unconfirmed |
The number that jumps out of the table is on the right. Hanil at 6.59 percent, everyone else below two. Two readings compete. Either this company runs an unusually generous distribution policy for its size, or the peers pay something closer to normal and Hanil is running high. I lean toward the second explanation, guided by Korean-language coverage from Newstown pointing out that most of the payout flows through parent holdco Hanil Holdings (003300) and up to the owner family, whose combined stake sits around 71 percent. In a controller-dominated structure the dividend functions partly as a cash channel to the owner group; that is not a criticism, it is a fact about who most benefits from the KRW 1,000 per share when it stays flat through a trough.
I looked for a global peer read too. Cement is a local commodity because transport eats the margin over a few hundred kilometers, and demand is set by the domestic construction cycle. Japan’s Taiheiyo Cement (TSE 5233), the closest analog by demographics and market maturity, trades near 17 times earnings with a dividend yield close to 2.6 percent, per Investing.com’s summary. India’s UltraTech Cement trades in the low thirties on P/E and pays a token yield; the growth setting is entirely different. So I did not put a multi-country PER table into the piece: the numbers on it would not add up to a comparable stack of businesses, and I did not want to imply otherwise.
Nine ways the Hanil Cement stock thesis could be wrong
Reasons my thesis could be wrong, laid out so the same work could be pushed the other way.
- Coverage of 99.12 percent is one year of arithmetic. It is not yet a policy. If 2026 owner-share earnings recover on the back of a stronger third quarter, the ratio drops back toward normal without any change of policy.
- First-half operating profit is already up 21.93 percent and the Q2 margin at 16.60 percent looks like a cycle turn, not just a seasonal print. The trough may be behind.
- Even if the payout skews to the owner family, minority holders receive the same KRW 1,000 per share. A realized 6.59 percent yield is real income, and it is the reason to be here for many Korean retail holders.
- Domestic cement selling-price cuts have been demanded before and rarely enforced. Cost-passthrough is the industry’s default; enforced cuts are the exception.
- The merger with Hanil Hyundai Cement lifted domestic market share to 21.76 percent. That kind of scale changes pricing power in the next negotiating round.
- The government’s August 2026 housing supply package could pull construction starts forward and shorten the wait for a volume recovery.
- The Korean sell side average valuation of KRW 19,500 sits 28.54 percent above the current price. I did not find a single house explicitly rating this stock a sell.
- I compared FY2024 and FY2025 dividends only against post-split years. The company’s pre-2021 payout history sat at KRW 4,500 to KRW 5,100 on the old face value, and the multi-year story of shareholder return is longer than the four years I displayed.
- The Q1 2026 balance sheet carries KRW 1,808.67 billion of total equity and a healthy retained-earnings pile. One or two years of holding the dividend flat can be absorbed inside that pool without a formal cut. The pressure I describe is real; the timing is at least one full year further out than my trigger date suggests.
Numbers I looked at for this Hanil Cement stock piece but did not use
I keep a “not used” section for my own hygiene. Each entry has a reason.
- The vendor’s checklist score of 86 out of 100 (six of seven metrics passed). At a cyclical trough the low-multiple checks can print as passes for the wrong reason. I did not carry it into the verdict.
- Payout-ratio fields of 94.3 percent and a raw of 28.7 percent. I could not verify which net-income base each uses, so I stuck with my hand-computed 99.12 percent and 90.64 percent.
- The EBITDA field of KRW 17.03 billion, since it equals the 2026 Q1 discrete operating profit to the won and is not a depreciation-adjusted figure. Left out of coverage math.
- EPS of KRW 1,061 (basis price divided by PER), since it is a back-calculated number. My multiples used the reported net income directly.
- Total equity from the screen: null. I sourced this from the DART filings instead: KRW 1,678.03 billion owner-share and KRW 1,808.67 billion consolidated at end-Q1 2026.
- Forward EPS, forward PER and peer multiples were all null on the vendor screen. I substituted the WISEfn corporate-monitor consensus (EPS KRW 952, forward PER around 16 times, average valuation KRW 19,500) and cross-checked each by hand.
- Interest coverage of 4.99 times on the vendor screen. Reversing the FY2025 interest expense of KRW 28.21 billion against operating profit KRW 132.74 billion gives 4.71, which is 5.7 percent off the printed value. The vendor is likely using a different interest column. Rather than pick, I left interest coverage out of the running text.
The seventh bullet is the piece of self-inspection I owe this piece. I have been taking the vendor’s interest coverage as a reasonable proxy for how far a name is from a cash crunch. When my hand math disagreed with the printed number by 5.7 percent I could not tell you which column the vendor used, so I dropped the item outright. The lesson is not to stop using proxies; it is to stop citing a proxy whose column I cannot name.
Where I sit on Hanil Cement stock and what would kill the thesis
Coverage-wise this name sits outside the top hundred KOSPI stocks by market capitalization, and the operating rule of this blog treats anything outside that cohort as an observation piece by default, not a trade case. So the verdict this piece renders is on a proposition: is the 99.12 percent coverage a one-off print, or is it the pattern of this company’s next twelve months.
Here is the trigger that would settle it. If FY2026 owner-share net income prints at or above KRW 73.55 billion, coverage falls back under one hundred percent and this piece was reading a single year’s anomaly. If FY2026 owner-share net income falls short of KRW 73.55 billion and the third-quarter print of this year gives back the first-half improvement of 21.93 percent, the company enters its next annual dividend decision with the arithmetic pointing to a cut. That is one one-directional threshold, and the two sides of it are asymmetric.
The threshold, KRW 73.55 billion, is not rounded for narrative convenience. It is the arithmetic outlay of a KRW 1,000 per-share dividend on 73,545,209 shares outstanding, computed for this piece. Anyone picking up the coverage later can start from that number.
Prices and multiples reflect the August 20, 2026 close as checked at the time of writing. USD conversions are approximate, at roughly KRW 1,413 per dollar on the same date. Vendor-screen fields and DART-filed figures are reconciled in the piece where they disagree.
Adjacent coverage sits alongside this piece for context. On the same cement rail, my earlier read on Asia Cement’s two cheap multiples closing on one number is the nearest comparison. On the construction demand side, a Teuksu Construction piece framed around three years of capex gives a downstream view, and on how a cyclical name reprices, my Foosung note on a single session that turned over 30% of the shares tracks a related mechanism in a different sector.