
CJ ENM Cash Flow: Four Years of Cash That Never Became Profit
I did not come to CJ ENM stock through a brokerage screen. I came to it through a television set in my parents’ living room, because the channel that played on weekend afternoons belonged to this company, and so did the home shopping channel wedged between the programs. That is a bad way to form an investment view and a fine way to notice that a company has more than one business.
What pulled me into the filings was a column that does not appear on any quote page. Between the 2022 and 2025 fiscal years, this company collected 5,515.8 billion won of cash from operations, roughly 3.99 billion US dollars at the rate I use below. Over those same four years it reported a cumulative consolidated net loss of 1,137.4 billion won, about 822.9 million dollars. Cash kept arriving and profit kept leaving. I hold no position and I am not opening one, but CJ ENM stock is now on my watch list for a specific reason, and this article is my record of what that reason is.
What I actually checked, and with which number
| Question I asked | The figure that answered it | Where it came from |
|---|---|---|
| Did the cash arrive? | 5,515.8 billion won over four years | Regulatory filings, summed by me |
| Did the profit arrive? | Cumulative loss of 1,137.4 billion won | Regulatory filings, summed by me |
| Is the company still investing? | Capital spending fell 85.28 percent | Filed figures, ratio calculated by me |
| Is the company still the same size? | Total assets fell 16.12 percent | Filed figures, ratio calculated by me |
Price basis is the Thursday, 2026-09-17 close of 37,500 won, about 27.13 US dollars. Stance is no position and watch only.
Contents
What CJ ENM Stock Costs and What Sits Behind It
The company trades on KOSDAQ, which is the junior board of the Korea Exchange. KOSPI is the senior board where the largest Korean companies list, and KOSDAQ was built for technology, media and growth companies. A KOSDAQ listing is not a warning label by itself, but it does mean the index funds that anchor KOSPI membership are not required buyers here.
I settled the units before anything else. The screen I use reports 21,928,000 shares outstanding. Multiplied by the Thursday, 2026-09-17 close of 37,500 won, that gives 822.3 billion won, which is what the same screen prints as market capitalization. The two agree to the won. At 1,382.2 KRW per USD, the closing rate in the Seoul foreign exchange market on 2026-09-17, that is about 594.9 million US dollars.
I want to flag one thing about the price itself, because I nearly used the wrong one. Three paths in the same data service disagreed. The current price field said 37,500 won. The price trend summary said 36,650 won. The daily series had a Friday, 2026-09-18 row with a 36,650 won close, an empty exchange scope, an empty settlement flag, and volume of 22,177 shares against 65,999 shares the previous session. That is a row still filling while the market is open. So this article uses one confirmed close and prints no percentage move in the share price anywhere.
CJ ENM Stock Sits on Four Years of Cash That Never Became Profit
Here is the cash column, taken from the annual filings, in billions of won: 1,650.8 in 2022, 1,296.0 in 2023, 1,402.6 in 2024, and 1,166.4 in 2025. The sum is 5,515.8 billion won, about 3.99 billion US dollars. Against a market capitalization of 822.3 billion won, that four year total is 6.71 times the entire equity value of the company.
Now the other column. Consolidated net income over the same four years was a loss of 176.8 billion won in 2022, a loss of 396.8 billion won in 2023, a loss of 580.8 billion won in 2024, and a profit of 17.0 billion won in 2025. Add them and the four years are a loss of 1,137.4 billion won.
The yearly cash figures do not move in one direction, and I want to be precise about that. The peak year is 2022 at 1,650.8 billion won. The trough is the most recent year, 2025, at 1,166.4 billion won. That is a decline of 29.34 percent against the 1,650.8 billion won peak. Measured against revenue, the cash conversion also thinned: operating cash flow was 34.45 percent of the 4,792.2 billion won of revenue booked in 2022, and 22.72 percent of the 5,134.5 billion won booked in 2025. So the cash column is not a flat annuity. It is a declining one, and the decline is faster than the revenue line would explain on its own.
Free cash flow tells the same story from the other side. Subtracting capital expenditure from operating cash flow gives 1,451.3 billion won in 2022, 1,196.0 billion in 2023, 1,339.2 billion in 2024 and 1,137.0 billion in 2025. The 2025 figure alone is 138.27 percent of the 822.3 billion won market capitalization I calculated earlier. A company whose single most recent year of free cash flow exceeds its entire market value is either mispriced or carrying something the cash statement does not show. I spent most of my time on this name trying to work out which, and I did not fully settle it.
These two columns are not in conflict. A media company runs a large amount of content amortization through its income statement, and amortization is added back when the cash flow statement is built. That is ordinary accounting and I am not calling it a trick. What interests me is the size of the gap and, more to the point, what the company chose to do with the cash once it had it.
CJ ENM Stock and a Capital Budget That Fell 85 Percent
Capital expenditure, in billions of won: 199.5 in 2022, 100.1 in 2023, 63.4 in 2024, 29.4 in 2025. From 199.5 down to 29.4 is a decline of 85.28 percent against the 199.5 billion won base. In dollars that is roughly 144.3 million down to 21.2 million.
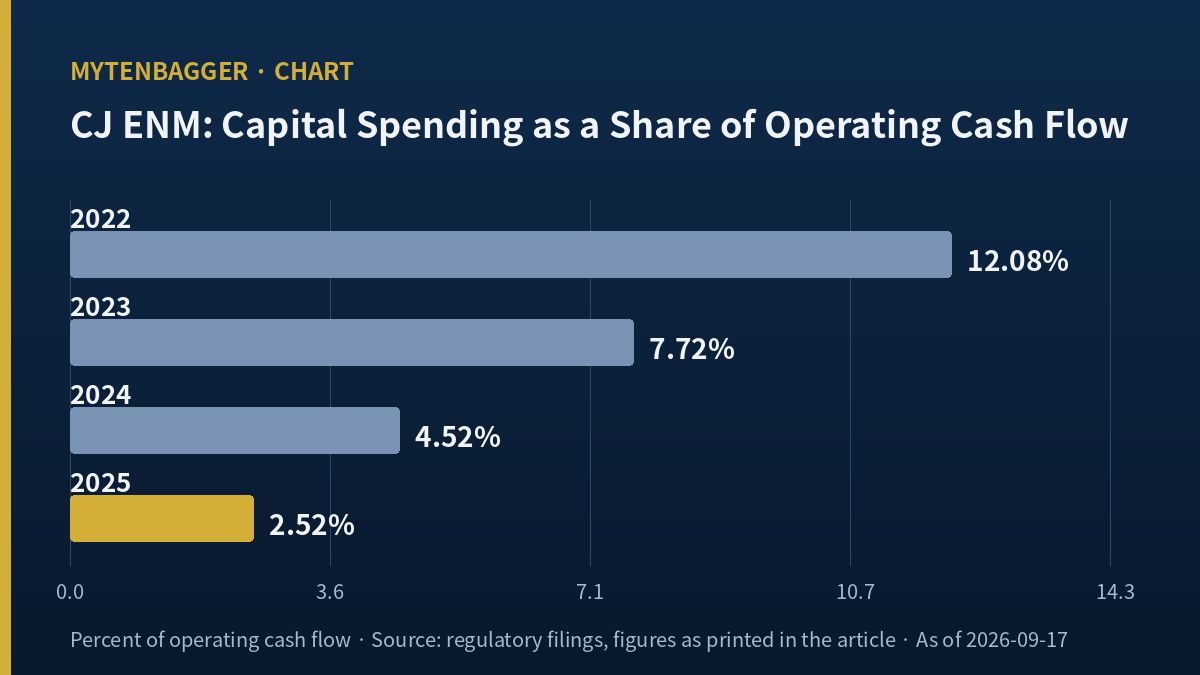
Expressed as a share of the cash that came in, capital spending was 12.08 percent of operating cash flow in 2022, 7.72 percent in 2023, 4.52 percent in 2024, and 2.52 percent in 2025. In the most recent full year the company put back about one won in forty of what its operations brought in.
I hold two interpretations of that and I am not able to settle between them from the filings alone. The generous one is discipline. Management has said publicly that it is expanding profitable domestic investment while shrinking overseas investment, and a smaller capital budget is exactly what that policy would produce. The unkind one is that a company which spends 2.52 percent of its operating cash on fixed assets is not building anything, and that the cash is coming out of a library that was paid for in earlier years.
One number tilts me slightly toward the unkind reading, and it is in the next section.
The Balance Sheet Got Smaller While the Cash Column Held
Total assets, in billions of won: 10,332.2 at the end of 2022, 9,949.9 at the end of 2023, 9,316.6 at the end of 2024, and 8,666.8 at the end of 2025. That is a decline of 16.12 percent against the 10,332.2 billion won starting figure, or roughly 7.48 billion down to 6.27 billion US dollars.
Total equity followed: 4,344.3 billion won at the end of 2022 and 3,445.8 billion won at the end of 2025, about 2.49 billion dollars. Liabilities came down too, from 5,987.9 billion won to 5,220.9 billion won, so the debt to equity ratio moved from 137.83 percent to 151.51 percent. Liabilities shrank by less than equity did, so leverage rose while the company got smaller.
That is the pattern I keep returning to. Cash arrived every year. Capital spending fell every year. Assets fell every year. Equity fell every year. A company can look like that while it is being managed well and deliberately, and it can look like that while it is being consumed. The filings show me the arithmetic and not the intent.
CJ ENM Stock and the One Line That Grew While the Rest Shrank
When every major balance sheet line falls for four straight years, the line that goes the other way is worth naming. Inventory did. It was 97.2 billion won at the end of 2022, 116.0 billion at the end of 2023, 137.0 billion at the end of 2024 and 142.9 billion at the end of 2025. From 97.2 to 142.9 is an increase of 47.04 percent against the 97.2 billion won starting figure, over a period in which total assets fell 16.12 percent.
I am careful here, because inventory in a group like this is not one thing. The commerce business holds physical goods for sale, and the media businesses hold content rights whose accounting treatment sits partly in intangible assets and partly elsewhere depending on the contract. The filing line I read is a single consolidated figure and it does not break those apart. So I can state the direction and the size with confidence and I cannot state the cause.
What I can do is put it next to the revenue line, because if inventory is rising to serve a growing business that is one story and if it is rising against flat sales that is another. Revenue was 4,792.2 billion won in 2022, 4,368.4 billion in 2023, 5,231.4 billion in 2024 and 5,134.5 billion in 2025. Over the full four years revenue rose 7.14 percent against the 4,792.2 billion won base, while inventory rose 47.04 percent. Stock on hand grew roughly six and a half times faster than the sales it exists to serve.
Operating margin over the same window was 2.87 percent in 2022, a negative 0.33 percent in 2023, 2.00 percent in 2024 and 2.59 percent in 2025. Four years, and the best of them is 2.87 percent. That is the context in which the cash column has to be read. This is not a business converting a fat margin into cash. It is a business with a thin margin whose cash statement is dominated by non cash charges being added back, and the difference between those two situations is the whole question for anyone pricing the shares.
One more figure belongs beside the margin line, and it is the one I trust least. The vendor screen I used reports 21,928,000 shares outstanding and 21,929,000 shares in free float, a thousand shares more. Free float cannot exceed shares issued, so one of those two cells is wrong by definition. The gap is small enough to be a rounding artifact in a feed that stores both fields separately, and I could not confirm that from the filings. I therefore wrote nothing in this article about ownership concentration, float, or index eligibility, all of which would have depended on that pair of cells being right.
Where I Had Looked Before This
I have run a version of this reading on neighbors in the same market, and two of those notes changed how I read this one. In my note on SBS, another Korean broadcaster, the book value that anchored the multiple had already been given back within six months of the reporting date, which taught me to date the dividing figure in every ratio before using it. That is why the balance sheet numbers above all carry a year end.
In my note on Kangwon Land I found two profit figures in one filing pointing in opposite directions, which is the habit that made me check this company’s cash column against its profit column instead of accepting either alone. And in my note on Paradise Co the lesson was about dividing figures again, specifically that a widely quoted ratio can be built on a base nobody prints. All three pages were live when I checked them for this article.
CJ ENM Stock Next to AMC Networks
For an overseas comparison I wanted a company where the same two columns are printed on the same page, so that I could run my own arithmetic instead of quoting someone else’s summary. AMC Networks, the United States cable programmer, fits. As of Monday, 2026-09-14 its shares were 12.39 dollars, market capitalization 511.09 million dollars, price to book 0.55, book value per share 22.09 dollars, trailing revenue 2.25 billion dollars and trailing net income a loss of 19.75 million dollars.
The comparison that matters to me is revenue direction against balance sheet direction. AMC Networks posted revenue of 3,097 million dollars in 2022, 2,712 million in 2023, 2,421 million in 2024 and 2,312 million in 2025, a decline in every year. Its operating income over the same years was 86.92 million, 388.41 million, a loss of 39.6 million, and 133.32 million dollars. So both companies are in the position of producing uneven operating profit on a revenue line that is not growing, and both are priced well below stated book.
I also ran my own checks against the printed statistics before using them, because a page that prints a ratio does not always print a ratio I can rebuild. Market capitalization reproduces: 12.39 dollars against 41.25 million shares gives 511.09 million dollars, which is what the page shows. Book value reproduces as well: 22.09 dollars a share against the same share count gives 911.2 million dollars of equity, and 511.09 divided by 911.2 gives 0.5609, against a printed 0.55. That is close enough for me to use the figure while noting the rounding. I did not use the forward earnings multiple the page carries, because I have no way to rebuild the estimate behind it.
Where they separate is what the market pays for the cash. At 0.55 times book, AMC Networks trades at roughly twice the multiple I calculate for this company on its consolidated equity. I will not turn that into a target, because the two book values are built under different accounting regimes and different content amortization policies, and because one company reports in dollars and the other in won. I am comparing how the two situations are put together and not what they cost. Converting either balance sheet into the other currency would create a precision that neither filing supports.
Liquidity is worth one line of its own. Volume on the Thursday, 2026-09-17 session was 65,999 shares. Against 21,928,000 shares outstanding that is 0.30 percent of the register changing hands in a day, and at the closing price it is about 2.5 billion won of turnover, roughly 1.8 million US dollars. That is thin enough that a single institutional decision moves the quote, which is one more reason I am recording a view here and not acting on one.
What the June 2026 Quarter Showed
The most recent confirmed results were released on Thursday, 2026-08-06, covering the three months to June 2026. Consolidated revenue was 1,203.3 billion won and operating profit was 33.4 billion won. Revenue fell 8.3 percent against 1,312.2 billion won in the same quarter of 2025, and operating profit rose 16.9 percent against 28.6 billion won.

By segment, the media platform business reported 380.0 billion won of revenue and 11.0 billion won of operating profit, turning positive from a loss. The film and drama business reported 190.2 billion won of revenue and a 10.5 billion won operating loss. Music reported 230.2 billion won and 10.9 billion won of profit. Commerce reported 402.8 billion won and 26.0 billion won of profit. The company attributed the weakness in film and drama to the delivery schedule of its overseas production arm, which recognizes content when global platforms take delivery, and said no major series was delivered in the quarter.
One arithmetic note, because I made the mistake myself before catching it. The four segment operating profits sum to 37.4 billion won and the reported consolidated figure is 33.4 billion won. The 4.0 billion won difference comes from intercompany eliminations and unallocated corporate costs. Segment tables and consolidated tables are not the same table.
CJ ENM Stock and the Six Price Targets on It
Six named Korean houses have published a valuation on this company in 2026, and every one of them sits above the Thursday, 2026-09-17 close of 37,500 won.
Korea Investment and Securities analyst Kim Jung Chan cut his valuation from 93,000 won to 75,000 won on Tuesday, 2026-04-21, keeping a buy rating and modeling 2026 revenue of 5,322.0 billion won and operating profit of 196.0 billion won. KB Securities analyst Choi Yong Hyun kept a buy rating at 74,000 won on Thursday, 2026-05-07, citing platform consolidation, asset monetization and the music business as the drivers. Daishin Securities analyst Kim Hoi Jae published 56,000 won with a buy rating on Friday, 2026-08-07, modeling operating profit of 150.0 billion won in 2026 and 240.0 billion won in 2027.
Korean press reporting on Friday, 2026-05-08 recorded three further cuts in the same period: DB Financial Investment from 83,000 won to 69,000 won, Hana Securities to 70,000 won, and NH Investment and Securities to 65,000 won. That report did not name the analysts or give exact publication dates, so I am carrying only the house names and the figures.
The spread runs from 56,000 won to 75,000 won. The lowest of the six is also the most recent of the six, which is the part of that list I weight most heavily.
CJ ENM Stock Stays on the Watch List and Here Is What Would Move It
No position, no order, watching. The company sits outside the top one hundred Korean listings by market capitalization, which is where my default is to observe and not to take a side. Nothing in this reading argued me out of that default.
Six objections, each tagged with the section it would erase
- Content amortization makes the cash to profit gap meaningless for any media company. If that holds, the entire section on four years of cash becomes background and the article rests only on the balance sheet.
- A falling capital budget is the stated strategy working, not a company being harvested. If that holds, the third section loses its second reading and keeps only its first.
- Shrinking total assets reflect disposals at good prices and not decline. If that holds, the fourth section needs disposal proceeds beside it, which I did not retrieve.
- The June 2026 quarter shows the operating turn already under way. If that holds, the quarterly section outranks every annual table above it.
- Comparing four years of cash flow to a single day’s market capitalization mixes a flow with a stock. If that holds, the 6.71 times figure comes out and the rest of that section survives.
- Six independent valuations all sit above the traded price. If that holds, my watch only stance is the weakest paragraph in the article.
Two things would change my reading, as opposed to merely challenging it. If capital expenditure rises back above ten percent of operating cash flow in a reported year, the harvest reading weakens and I would rebuild the case from the investment line. If total equity stops falling for two consecutive year ends, the balance sheet argument above stops working and I would need a different frame entirely. The document that settles both is the quarterly report covering September 2026, and in particular its statement of changes in equity and its cash flow statement. I was not able to confirm the filing date for it, which is the fifth of five gaps I am carrying out of this article and into the next one.
Sources
- Company newsroom, second quarter 2026 results, released 2026-08-06 (Korean)
- Edaily, Korean press report on the second quarter figures
- Asia Economy, Korean press report on the Korea Investment and Securities revision, 2026-04-21
- KB Securities, Korean sell side note dated 2026-05-07
- Financial News, Korean press report on the Daishin Securities note, 2026-08-07
- Electronic Times, Korean press report on six valuation cuts, 2026-05-08
- Korea Exchange disclosure system, annual report filing
- AMC Networks key statistics, page dated 2026-09-14
- AMC Networks annual income statement
- Money Today, Seoul foreign exchange market close for 2026-09-17 (Korean)
- Asia Economy, second Korean report of the same 2026-09-17 foreign exchange close
- Annual financial figures are from Korean regulatory filings. Share count, price and multiples are vendor data on the Thursday, 2026-09-17 close.
Related reading