Teuksu Construction Stock Trades Below 3 Years of Capex
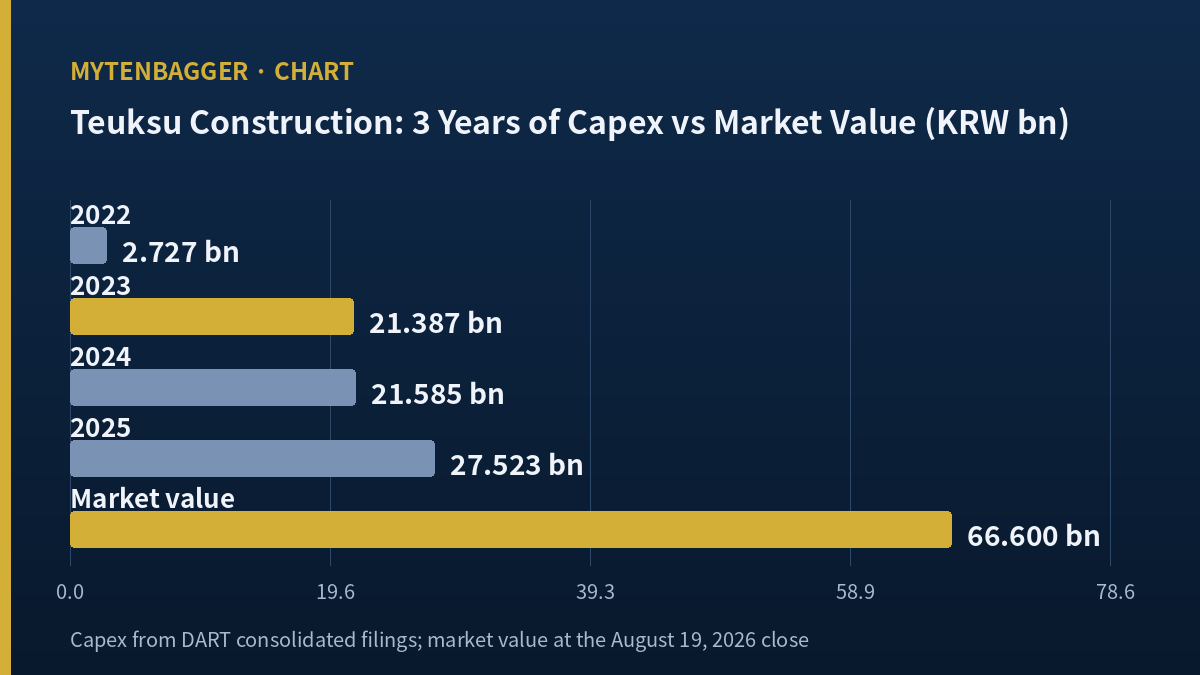
I went looking for a company whose spending I could measure against its own price, and Teuksu Construction stock gave me the cleanest version of that arithmetic I have found on the KOSDAQ this month. The company put KRW 70.495bn into property and equipment across 2023, 2024 and 2025. On August 19, 2026 the exchange closed the whole company at KRW 66.6bn. The three years of machines cost more than the business that owns them is currently worth.
That is a headline, and headlines flatter themselves. What made me keep reading was the second fact. When this company had to explain its 2025 loss to the regulator, the first reason it gave was depreciation on the equipment it had just bought. I have read a lot of loss explanations. It is unusual for a company to point at its own capital program before it points at demand.
The three figures this piece turns on
| Capex, 2023 through 2025 | KRW 70.495bn (about USD 50.4m) |
| Market value, August 19, 2026 | KRW 66.60bn (about USD 47.7m) |
| Operating result over the same three years | KRW 20.404bn of losses |
Korean won is the reference currency. Financials come from Korean regulatory filings on a consolidated basis.
Contents
Where Teuksu Construction stock sits today
Teuksu Construction trades on the KOSDAQ under 026150. The KOSDAQ is Korea’s junior board, the venue for smaller and growth-stage companies, and it sits beside the main KOSPI board the way the Nasdaq once sat beside the NYSE. This is a small name even by that standard.
| August 19, 2026 close | Value | Basis |
|---|---|---|
| Share price | KRW 3,795 | Closing price |
| Market value | KRW 66.60bn | Price times 17,549,407 shares |
| Price to book | 0.77x | Book value per share KRW 4,922, dated end-2025 |
| Price to earnings | not computable | 2025 loss per share KRW 1,113 |
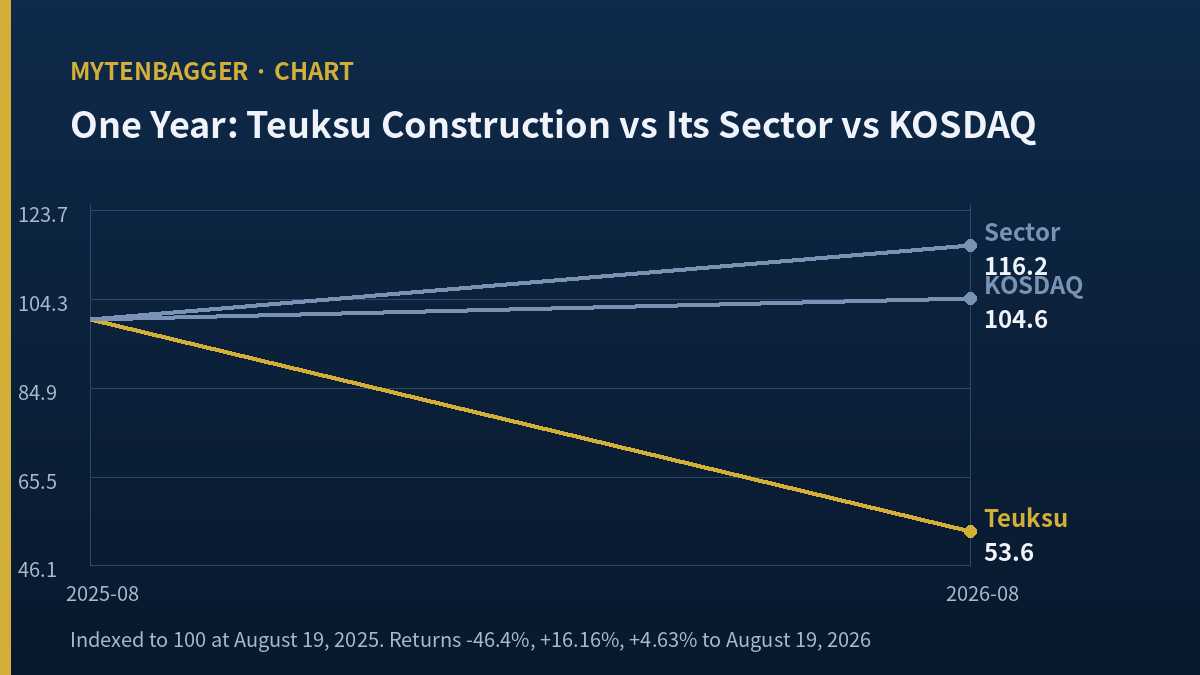
| One-year return | -46.4% | KOSDAQ +4.63%, construction sector +16.16% |
| Beta to the KOSDAQ | 0.581 | Correlation 0.559 |
The book value figure carries a trap I want to flag before I use it. Multiply KRW 4,922 by the share count and you get KRW 86.363bn, which matches the equity attributable to owners at December 31, 2025 almost to the won. So that per-share book value is eight months old. Using the June 30, 2026 owners’ equity of KRW 89.689bn gives KRW 5,112 per share and a 0.74x multiple. I quote 0.77x in this piece and I say which balance sheet date it comes from, because a 3.8% difference between two paths to the same ratio is worth naming.
Three years of equipment spending against one market value
Here is the whole argument in one table. All figures are consolidated, from Korean regulatory filings, in billions of won.
| Fiscal year | Capex | Operating result | Revenue | Debt to equity |
|---|---|---|---|---|
| 2022 | 2.727 | +2.684 | 202.958 | 73.24% |
| 2023 | 21.387 | +2.490 | 232.863 | 90.43% |
| 2024 | 21.585 | +8.752 | 212.529 | 100.90% |
| 2025 | 27.523 | -31.646 | 149.021 | 121.80% |
| 2023 to 2025 | 70.495 | -20.404 | 594.413 |
Two things jump off that table. The first is 2023. Capex went from KRW 2.727bn to KRW 21.387bn, a factor of 7.84, and then stayed above KRW 21bn for three consecutive years. This company decided something in 2023 and has been paying for it since.
The second is the bottom row. Over the same three years the operating line produced a cumulative loss of KRW 20.404bn. So the spending and the earning moved in opposite directions, and the debt ratio climbed every single year while both were happening: 73.24, then 90.43, then 100.90, then 121.80. By June 30, 2026 it had reached 133.54%.
Set the KRW 70.495bn beside the KRW 66.60bn the market pays for the entire company and the ratio is 1.058. Or read it the other way, which I prefer because it is less dramatic and more honest: the market value equals 94.5% of what this company spent on machines in three years. That is not a valuation argument on its own. Equipment depreciates, some of it was financed with the debt that is now on the balance sheet, and a machine is worth what it earns and no more. It is a starting question, and the question is whether those machines can carry their own depreciation.
The company named its own machines as reason one
On February 27, 2026 Teuksu Construction filed the Korean disclosure that a company must make when profit or loss swings by more than 30%. The reasons it listed, in order, were increased depreciation from investment in construction equipment, and then completion settlements on overseas sites together with lower work volume. Korean press carried the filing that day.
I take the order seriously. The second reason is cyclical and can reverse in a good year. The first one does not reverse; it runs off over the life of the asset. And the income statement supports the ordering. In 2025 the cost of sales came to KRW 169.58bn against revenue of KRW 149.02bn, which is a cost ratio of 113.8% and a gross loss of KRW 20.56bn. Selling and administrative expense of KRW 11.08bn held roughly flat. The damage happened above the SG&A line, out on the job sites, where equipment charges live.
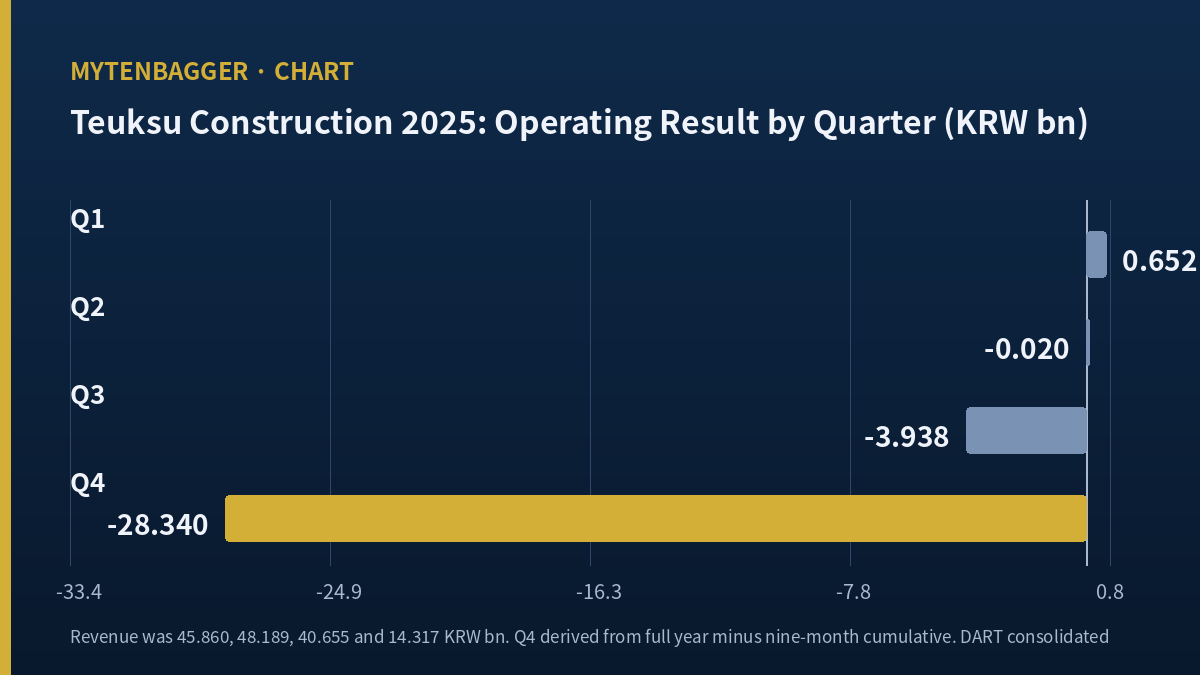
The quarterly split makes the same point with more force. In the fourth quarter of 2025 the company booked KRW 14.317bn of revenue, 9.61% of the year, and KRW 28.340bn of operating loss, 89.55% of the year. The quarters sum to the annual figures to the won, which is the check I run before I trust a table of this kind. A fourth quarter that carries a tenth of the revenue and nine tenths of the loss is a settlement quarter, and settlement quarters are where fixed costs on idle machines land.
One more number belongs here, and it comes from the Korean-language edition of this analysis, where I traced it in detail. The company paid a dividend for fiscal 2025, KRW 29 per share, KRW 508.8m in total, its first payout after eleven consecutive years of none. It did that in a year with an operating loss, a net loss, and free cash flow of negative KRW 8.213bn. I mention it here because it tells you the board was willing to signal, and it does not tell you that operations had turned.
The two machine makers a shareholder cannot buy
When I want to understand what a contractor’s equipment is worth, my habit is to go and read the maker’s accounts. Big machines have narrow markets and the manufacturers disclose enough to calibrate. I tried that here and it failed twice, which surprised me enough that I am writing it down.
Herrenknecht AG
Teuksu brought Korea’s first Herrenknecht shield tunnel boring machine into the country in 1999. Herrenknecht is the largest TBM manufacturer in the world and it is privately held, controlled by its founder’s family. There are no filings to read and no shares to buy.
BAUER AG
The large-diameter bridge foundation work uses BAUER drilling rigs. BAUER was listed in Frankfurt until its delisting took effect at the end of June 20, 2023, in a process the board supported. Also gone from public view.
The delisting is documented in BAUER’s own announcement, and Herrenknecht’s ownership is documented in public reference sources, not in filings. So the two brands that define this contractor’s asset base are both outside listed markets, one by never entering and one by leaving. The practical consequence for me is that I cannot triangulate what a Korean tunneling contractor’s fleet is worth from comparable equipment economics. I have to take the balance sheet at its word, and the balance sheet is exactly what I came here to question. That is a real limit on this piece and I would rather state it than route around it.
Teuksu Construction stock beside a listed ground-engineering peer
Since the machine makers are unavailable, I went to contractors instead. Keller Group, listed in London as KLR, describes itself as a geotechnical specialist contractor working in ground improvement, grouting, deep foundations and earth retention. That is close to a line-for-line match with what Teuksu does. Keller’s figures below are as at August 19, 2026 from Stockopedia; I did not verify a sterling to won rate in this piece, so I leave the Keller numbers in their own currency.
| August 19, 2026 | Teuksu Construction | Keller Group | Skanska |
|---|---|---|---|
| Market value | KRW 66.60bn | GBP 2.27bn | USD 11.55bn |
| Latest full-year revenue | KRW 149.02bn | GBP 3.09bn | USD 18.56bn |
| Price to earnings | not computable | 11.97x | not disclosed on the source screen |
| Latest direction | 2025 revenue -29.88% | H1 2026 revenue +11% | Scale reference only |
Keller grew its first-half 2026 revenue 11% on North American demand while trading at roughly twelve times earnings. Teuksu shrank 29.88% and has no earnings to divide into. Skanska is here purely for scale. At USD 11.55bn it is roughly 242 times the Korean company’s market value, which is the kind of ratio that tells you what “small cap” means in this corner of the market.
The comparison that actually decides the question is domestic, though. Dong Ah Geological Engineering, KOSDAQ 028100, does the same shield tunneling and ground work in the same country under the same contract regime. In 2025 its revenue rose 18.86% to KRW 467.7bn and its operating profit rose 87.99% to KRW 18.1bn. Its market value on August 19, 2026 was KRW 234.2bn, about 3.5 times Teuksu’s. Those figures come from Korean market data screens dated that day.
Same year, same market, same method, opposite results. A construction downturn cannot carry that gap on its own. Whatever happened at Teuksu Construction in 2025 was substantially its own, and the market’s read agrees: against a construction sector that returned +16.16% over the year, this stock returned -46.4%, and a sector-versus-stock decomposition attributes only 15.6% of that gap to the sector. It ranks 60th of 67 names in its sector over the period.
Teuksu Construction stock and the first half of 2026
The half-year report filed on August 14, 2026 is where the argument gets complicated in the company’s favor.
| Consolidated, first half | 2025 | 2026 |
|---|---|---|
| Revenue | KRW 94.049bn | KRW 108.610bn |
| Operating profit | KRW 0.632bn | KRW 4.578bn |
| Interest expense | KRW 1.600bn | KRW 1.817bn |
| Debt to equity | 87.66% | 133.54% |
Revenue up 15.48%, operating profit up 7.24 times, both quarters profitable. That is a real improvement and I will not talk it down. Operating profit now covers interest expense 2.52 times, which is adequate.
Two cautions attach. The first is that KRW 4.578bn of half-year operating profit, annualized crudely, is around KRW 9bn against a three-year capital program of KRW 70.495bn. At that rate the machines take a long time to pay for themselves before anything reaches a shareholder. The second is that the debt ratio has gone the wrong way through the entire recovery, from 87.66% to 133.54% in twelve months. The company is earning more and owing more at the same time.
I wrote up a Korean franchisor that tripled its capex in the year its revenue fell not long ago and reached a similar holding pattern for a similar reason: spending that arrives on the income statement as depreciation before it arrives on the revenue line as work.
What Teuksu Construction stock does not have
No analyst covers it. I checked the Korean consensus screen that aggregates sell-side estimates for listed companies, and it returns the standard message that no opinion has been submitted within the past three months. The 2026 estimate column exists on the page and every cell in it is blank. There is no 2027 column at all.
The closest thing to coverage I located is a named analyst at a Korean brokerage quoted in a trade article on June 25, 2025, explaining why trenchless methods suit dense urban work. No rating, no valuation figure. So this piece has no forward estimates in it, and I am not going to manufacture any.
What exists instead is contracted work, which is a higher-grade input than an estimate anyway. On April 16, 2025 the company signed a TBM power-conduit contract worth KRW 116.21bn running to December 7, 2027. The disclosure states the contract equals 54.68% of recent revenue; dividing KRW 116.21bn by 2024 revenue of KRW 212.529bn gives exactly 54.68%, so I confirmed by back-calculation which year the filing used. Against 2025 revenue of KRW 149.021bn the same contract is 77.98%. A separate rail tunnel contract of KRW 42.488bn followed in June 2025.
It is worth asking whether the machines themselves face growing demand, since that is the bet the 2023 spending represents. Grand View Research sizes the global tunnel boring machine market at USD 6.39bn in its 2022 base year, growing toward USD 9.4bn by 2030 at a compound rate of 4.9%, with Asia Pacific the fastest-growing region on transport infrastructure investment. I flag the base year deliberately: that study was published in 2023 and last updated in mid-2025, so it is a directional input and not a current one. A mid-single-digit growth rate also tells you something uncomfortable. It is fast enough to justify owning machines and too slow to rescue a fleet bought at the wrong point in a domestic cycle.
On the demand side, the Korea Research Institute for Construction Policy reported that specialist contractor awards fell about 7.0% in 2025, with subcontract awards down 8.5%, and Korean press reported overseas construction orders down 63.6% in the first half of 2026 to the lowest first half in twenty years. Pulling the other way, the Construction and Economy Research Institute of Korea forecast 2026 construction orders of KRW 231.2tn with the public component up 8.4% and the national infrastructure budget up 7.9%. A contractor weighted toward public civil works sits on the better side of that split. I covered the same policy backdrop from the cement end in a piece on Asia Cement’s two cheap multiples and from the housing end in one on Kumho E&C.
Where I stand on Teuksu Construction stock and what would move me
A KRW 66.6bn company is small, and my default at that size is to watch it and write it up. I am not making an exception here.
Access is worth a paragraph for readers outside Korea, because it cuts differently than usual with a company this small. There is no American depositary receipt. So the accessible instruments are all the wrong size for this particular question. The two listed peers I used above, Keller in London and Dong Ah on the KOSDAQ, are each easier for a foreign investor to reach than the subject of the piece.
My test is narrow. Can operating profit alone carry the fixed costs those machines created? Right now it covers interest 2.52 times and the debt ratio is still climbing, so the answer is “barely, and not yet convincingly.” The third-quarter report, legally due by November 15, 2026, settles it. If single-quarter operating profit comes in above the second quarter’s KRW 1.989bn while the debt ratio falls back below 133.54%, I drop the premise of this piece. If the third quarter returns to an operating loss, the first-half recovery was two good quarters and not a trend.
Eight arguments against what I have written:
- Capex is not a valuation floor. Machines depreciate, much of this fleet was debt-financed, and comparing cumulative spending to market value ignores both facts. The ratio is a prompt, not a conclusion.
- The 2023 step-up may have been correctly timed. A KRW 116.21bn TBM contract running to December 2027 needs machines to execute, and the fleet was bought before the work arrived. That sequencing looks bad in an income statement and can still be right.
- First-half 2026 is genuinely better. Revenue up 15.48%, operating profit up 7.24 times, two profitable quarters. Calling that “not yet a trend” may be me being slow.
- Public ordering is expanding. Public construction orders forecast +8.4% and the infrastructure budget +7.9% for 2026, which is the demand pool this contractor draws from.
- The book discount is real. At 0.77x book, a reader who thinks in liquidation terms would start with the balance sheet and the equipment on it, and would find my income-statement framing beside the point.
- My peer comparison may be unfair. I did not obtain the client mix for either Korean company. Dong Ah may sit further up the contracting chain, and prime contractors and subcontractors did not have the same 2025.
- I could not price the fleet. Both machine makers are outside public markets, so my central claim about equipment economics rests on a balance sheet I cannot independently check.
- My route to this company was not neutral. I arrived through a Korean search-demand keyword, meaning a search engine’s ranking selected my sample before I did any analysis.
Prices, market value and ratios reflect the August 19, 2026 close as checked at the time of writing. Korean won is the reference currency throughout and USD equivalents are approximate, converted at roughly KRW 1,397.7 per dollar, the Seoul market close on the same date. Financial statement figures are consolidated and come from Korean regulatory filings. The 250-day high and low used for the drawdown are adjusted-close values of KRW 7,690 and KRW 3,145; a closing-price series instead gives a peak of KRW 7,520 on February 6, 2026 and a trough of KRW 3,325 on July 29, 2026, moving the drawdown from 50.65% to 49.53%, and I have used the adjusted series. Keller Group figures are in sterling because I did not verify a sterling conversion rate for this piece.