NH Nongwoo Bio Stock: A Rival Says AI Halved Its Head Start
A Korean business magazine ran a seed-industry feature on February 17, 2026, and one line in it stopped me. A rival breeder, Farm Hannong, said it had used an AI model to cut the development of a new crop variety from what the magazine called the customary ten years down to about half that. I was not reading about NH Nongwoo Bio at the time. I went looking for NH Nongwoo Bio stock because of that sentence.
| What I went looking for | Whether a decade-long breeding cycle is an asset or a liability once somebody claims to compress it |
| What this company spends | About 15% of revenue on research, per the company itself in a 2024 interview |
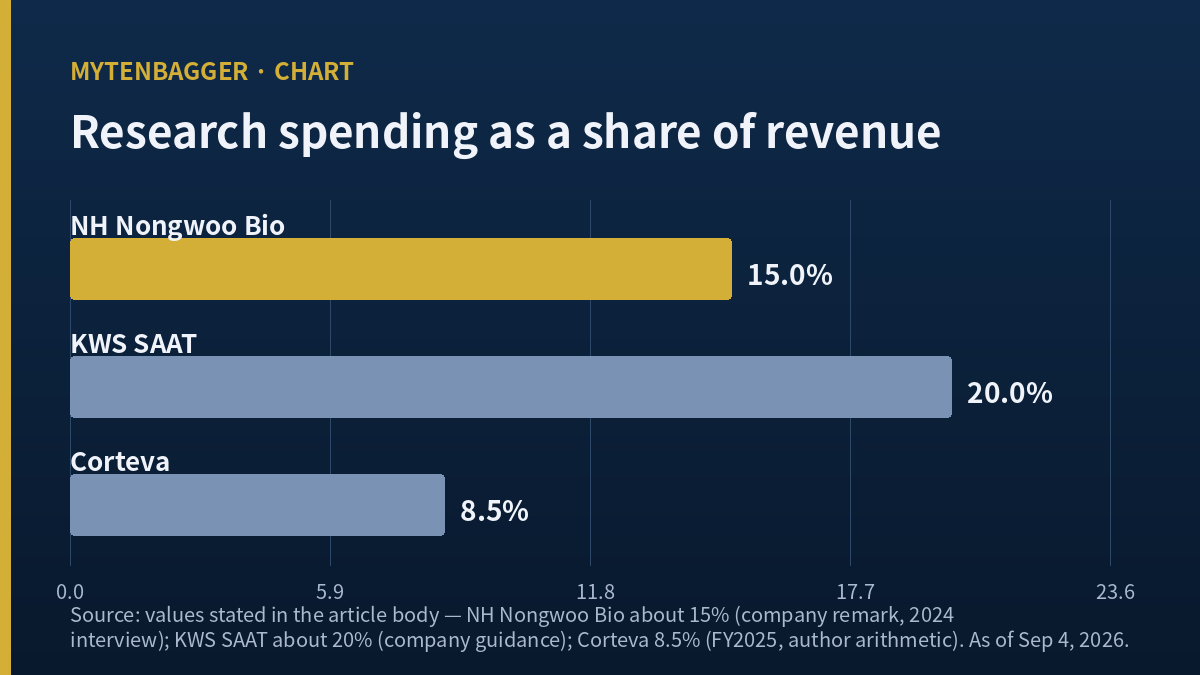
| What its peers spend | KWS SAAT guides to roughly 20% R&D intensity; Corteva ran 8.5% in FY2025 (my arithmetic) |
| What the market pays | 0.71 times revenue and 0.41 times book, against 1.30 and 1.23 at KWS |
| Where I stand | No position, no order. What I am recording here is the evidence I would need, and no purchase sits behind it |
Contents
The claim that sent me to NH Nongwoo Bio stock
Ten years, then five
The feature I read appeared in Maekyung Economy on February 17, 2026, and I am working from the Korean text. Its claim about Farm Hannong is specific: the company applied an AI system to variety development and roughly halved a cycle the article describes as customarily ten years. I have not seen the underlying data, and I am carrying that limitation into everything that follows.
Here is why the sentence matters to a company like this one. A vegetable seed business does not sell a crop. It sells the genetics that produce a crop, and the only thing separating a good breeder from anyone with a greenhouse is the years of crossing, selection and field trials already sunk into a catalogue. Time spent is the asset. If a competitor can buy back half of that time with software, then the asset on this company’s books is worth measuring again.
Why I did not go to the income statement first
My habit with a small listed company is to open the earnings history and work outward. I did not do that here. Research spending sits inside operating costs, so a breeder that spends heavily shows up as a company with a thin margin, and the income statement cannot tell me whether that thinness is weakness or investment. The ratio I actually wanted was research spending against revenue, and that number is not on any screen I use.
So I went to the press instead, and the press gave me two different numbers. Getting those two numbers to agree took longer than reading the financial statements did.
The market this trades in
NH Nongwoo Bio trades on KOSDAQ, the junior board of the Korea Exchange, which lists smaller and more technology-weighted companies than the main KOSPI board. Foreign investors reach KOSDAQ names through a local broker; the largest Korea ETFs track KOSPI-heavy indices, and I could not confirm that this specific company sits inside any of them. There is no depositary program for these shares that I could find.
What NH Nongwoo Bio stock actually sells
Peppers, tomatoes, and a fifth of the domestic market
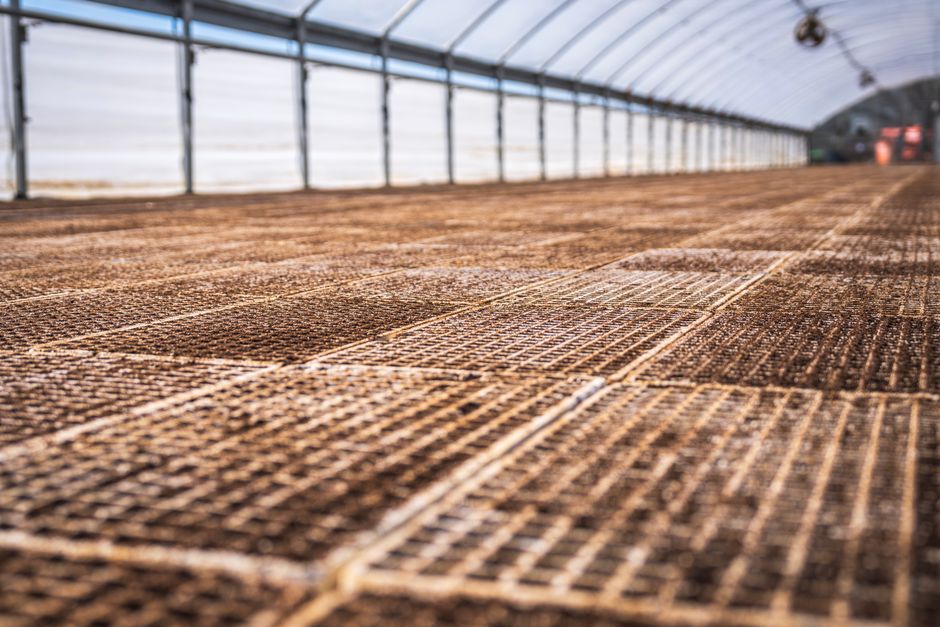
The catalogue is vegetable seed: hot pepper, tomato, cucumber, oriental melon, paprika, cabbage, onion. The company also makes horticultural growing medium. Hankyung visited the head office in October 2024 and reported a domestic vegetable-seed share in the twenty-percent range against a 2030 target of 27%, plus an 11% share in growing medium, fourth in Korea. Three breeding stations sit at Yeoju, Miryang and Gimje.
Nearly half the revenue is already outside Korea
DailyInvest wrote the company up on July 28, 2026 with a figure I had not seen elsewhere: combined revenue at the main overseas subsidiaries went from KRW 44.6bn in 2021 to KRW 67.4bn in 2025, a compound rate of 10.9% over four years. Set against FY2025 consolidated revenue of KRW 158.79bn, the 2025 overseas figure works out to 42.45%. That percentage is my own division. No disclosed segment number backs it, and I could not confirm how many subsidiaries the total covers or whether it sits before or after consolidation adjustments.
Six overseas subsidiaries operate in India, China, the United States, Türkiye, Indonesia and Myanmar, with exports reaching more than seventy countries. In the 2024 interview the chief executive said this would be the year overseas vegetable seed sales first passed domestic sales. I could not find a source confirming whether that happened.
The owner is a farmers’ cooperative
NongHyup Economic Holdings owns 57.91% of the shares, 9,283,920 of them, according to the WiseReport company screen dated August 28, 2026. NongHyup is Korea’s national agricultural cooperative federation, a member-owned organization whose ultimate constituents are farmers. It took the company into its group in 2014. Ajunews reported on July 16, 2026 that the head of NongHyup’s agricultural economics arm visited the site on July 14 to discuss seed exports and custom variety development.
That ownership shape has consequences a US reader should price in. A controlling holder of this type does not sell into strength, does not put the company in play, and answers to farmer members whose interest is supply of good seed at a workable price. Some of what looks like a discount here is the absence of every event that normally repositions a small listed company.
Fifteen percent, or twenty
Two published figures for the same company
The Hankyung piece says the company puts about 15% of revenue into research. The DailyInvest piece says research spending runs at about 20% of standalone seed revenue. Those look like contradictory numbers until you read what each one is divided by. One divides by all revenue, consolidated. The other divides by seed revenue only, on a standalone basis, and the same DailyInvest piece puts seed at 81.61% of first-quarter revenue.
Work through it and the two are compatible. A smaller denominator produces a larger percentage from the same spending. I did not close the loop on it, because I could not open the audited notes and read the disclosed research expense line myself. Both numbers stay in this piece as reported figures with their sources attached, and neither becomes an input to anything else I calculate.
What I did not do with those numbers
I did not multiply 15% by FY2025 revenue to produce a research spending figure in won. It would have been an easy sentence to write and it would have been a fabrication: a ratio a company mentioned in a 2024 interview applied to a 2025 income statement, presented as if it were an accounting fact. Here I nearly made that mistake in my first draft and caught it while re-reading. The number would have looked precise, and it would have been my construction, and the company has disclosed no such figure.
Why the ratio is the point
Reported operating margin for FY2025 was 8.59%, on revenue of KRW 158.79bn and operating profit of KRW 13.64bn. If the research ratio is anywhere near the reported range, this company spends more each year on the next catalogue than it books as profit from the current one. That is a normal shape for a breeder and an abnormal shape for a business trading at 0.71 times revenue. The question I opened with lands right here: a decade of accumulated breeding is what that spending buys, and a rival says the decade is now five years.
What NH Nongwoo Bio stock’s listed peers spend and are paid
The comparison group and how I built it
My rule for this table: listed companies whose primary business is plant breeding, where a single screen gives me the revenue ratio, operating margin and price-to-book together. Four names cleared it. Because the screens update on their own schedule and three of these are not US listings, the reference date is its own column instead of a footnote. Currency stays native, and every comparison below is a ratio, so no exchange rate enters the table.
| Company | Market value | Price / revenue | Operating margin | Price / book | R&D intensity | Screen date |
|---|---|---|---|---|---|---|
| NH Nongwoo Bio (KOSDAQ 054050) | KRW 112.5bn | 0.71x | 8.56% | 0.41x | ~15% of revenue | Sep 4, 2026 |
| Corteva (NYSE: CTVA) | USD 58.62bn | 3.29x | 17.03% | 2.33x | 8.5% (my arithmetic) | Sep 4, 2026 |
| KWS SAAT SE (ETR: KWS) | EUR 2.18bn | 1.30x | 16.79% | 1.23x | ~20% guided | Jun 19, 2026 |
| Sakata Seed (TYO: 1377) | JPY 191.23bn | 1.83x | 12.58% | 1.07x | not found | Jul 30, 2026 |
| Origin Agritech (NASDAQ: SEED) | USD 11.83m | 1.20x | -61.61% | not shown | not found | Aug 26, 2026 |
Peer market data read from stockanalysis.com company statistics pages on the dates shown in the final column; the KWS and Sakata screens had not refreshed to September. Korean figures are the September 4, 2026 close and the FY2025 statutory filing. Origin Agritech shows no price-to-book because its reported shareholders’ equity is negative. R&D intensity for Corteva is my own division of FY2025 research expense by FY2025 net sales; for KWS it is the company’s own guided range; for NH Nongwoo Bio it is the ratio the company gave a reporter in 2024.
The spending is peer-normal and the price is not
Read the R&D column and NH Nongwoo Bio sits between the two European and American reference points: above Corteva, which is a crop-protection business with a seed arm, and below KWS, which is a pure breeder like this one. That is where a Korean vegetable specialist ought to sit, and it is the least surprising column in the table.
Then read the two price columns. On revenue, KWS is paid 1.83 times what this company is paid and Sakata 2.58 times. On book, KWS is paid three times over. The spending profile says peer. The price says something else is being deducted, and no amount of staring at the R&D column tells me what.
What I refused to build here
There is an obvious sentence available: combine the revenue gap and the book gap into one number and call it the total discount. I wrote that sentence, looked at it, and deleted it. Those two ratios have different denominators and multiplying them produces a figure that describes nothing. When I catch myself wanting one headline number for a gap that has two dimensions, the wanting is usually the signal that I have not understood the gap.
The numbers behind that price
Four years of results
Consolidated, from the Korean statutory filings, in billions of won.
| Fiscal year | Revenue | Operating profit | Net income | Operating margin |
|---|---|---|---|---|
| 2022 | 146.30 | 11.01 | 9.82 | 7.53% |
| 2023 | 135.84 | 8.94 | 10.32 | 6.58% |
| 2024 | 144.68 | 11.10 | 10.91 | 7.67% |
| 2025 | 158.79 | 13.64 | 12.28 | 8.59% |
Source: the company’s annual regulatory filings in Korea, each dated December 31 of the year shown. Margins are my division of operating profit by revenue and match the filed figures to two decimals.
FY2025 was the best of the four on all three lines. Revenue rose 9.75%, operating profit 22.86% and net income 12.61% against FY2024, all three my own arithmetic. Margin has climbed from 6.58% to 8.59% across two years. The first half of 2026 pulled the other way: first-quarter operating profit fell 28.98% year on year, on revenue down 2.71%.
The screen, in one column
The September 4, 2026 close was KRW 7,020, roughly USD 5.20. Multiply by 16,025,641 shares outstanding and market value comes to KRW 112.5bn, about USD 83.3m. Trailing earnings ratio 9.16 times, price to book 0.41 times, return on equity 4.5%, price to revenue 0.71 times. The debt-to-equity ratio at the end of June 2026 was 26.29%. The dividend was KRW 250 per share for FY2025, a 3.64% yield, and the company has paid every year since 2018.
Prices and ratios reflect the September 4, 2026 close as checked at the time of writing; there is a lag between that check and publication, so live quotes will differ. Dollar figures use roughly KRW 1,350.4 per dollar, the Seoul close on the same date, and that single rate is the only one used anywhere in this piece. Korean won is the reference currency throughout.
One range I recalculated instead of copying
The data screen gives a 250-session high of KRW 9,020 and a low of KRW 6,400, and labels both as adjusted closing prices. They are not closing prices. Counting the same window myself, the highest close was KRW 8,900 on September 19, 2025 and the lowest KRW 6,540 on June 26, 2026. The dates match across both bases; the levels do not. Everything derived from that range in this piece uses the closing figures.
Owning NH Nongwoo Bio stock from outside Korea
The foreign holder base is 2.32% and I do not know who it is
Foreign ownership of this company runs at 2.32% on one screen and 2.38% on another. Either way it is small, and what struck me is that I could not identify a single one of those holders. No filing I reached names them, no fund letter I found discusses the company, and the shareholder table lists no holder above 5% other than the cooperative. For a US reader that is the practical shape of the situation: you would not be joining an existing foreign shareholder base here, because there is barely one to join.
Access and size
There is no depositary program for these shares that I could locate, so a US holder needs a broker with Korean market access. Average daily turnover over the twenty sessions to September 4, 2026 was about KRW 129m, roughly USD 95,600 at the rate in the footnote above. With 57.91% locked in cooperative hands, the shares actually circulating come to 6,746,641. Size a position against the market value instead of that float and it will not behave the way the spreadsheet says.
The industry a foreign buyer would be buying into
The Maekyung feature puts Korea’s seed industry at roughly 1% of the world total, with 2,561 registered companies in 2024 of which 92% booked under KRW 500m in annual sales. It also describes a domestic problem I had not seen before: local government agricultural offices producing copies of commercial varieties and releasing them cheaply, which the article treats as a drag on the industry and declines to call a service to farmers. Whatever this company’s catalogue is worth, it is worth it inside that structure.
The single forward estimate on NH Nongwoo Bio stock
One institution, one date
The WiseReport screen states that no investment opinion has been published on this company in the past three months, and the forward earnings and forward valuation fields in my data source are empty. I set out to gather estimates from two brokerages and could not. What exists is a Korea IR Council note dated July 27, 2026, by analyst Park Sun-young, reported in the DailyInvest piece linked above: FY2026 revenue of KRW 173.9bn, up 9.5%, and operating profit of KRW 13.9bn at an 8.0% margin. Paraphrasing the analyst’s conclusion, the current valuation discount could narrow gradually if overseas seed sales and higher-value varieties feed through to profitability.
A check on the arithmetic in that note
The reported growth figure for operating profit is 2.2%. Dividing the estimate of KRW 13.9bn by FY2025 actual operating profit of KRW 13.64bn gives 1.90%, a gap of 0.3 percentage points. The likely explanation is rounding: an underlying estimate near KRW 13.94bn would produce 2.2% and would still print as 13.9. I am quoting the published figures as published and recording the difference from my own division here, since the gap is small enough to be invisible and large enough to matter if somebody chains further calculations onto it. If you want a picture of what a company looks like with no analyst covering it at all, I wrote one up in August about a much larger Korean food company.
Five arguments against what I have written
The evidence I am leaning on is thin
One. The AI claim that opened this piece is a competitor’s statement relayed by a magazine. I have no technical detail, no scope, no independent verification. If it is marketing, the premise of my whole framing weakens, and I would rather say so at the top of this list than bury it.
Two. Neither R&D figure came from an audited disclosure. One is a company statement to a reporter in 2024 and one is how a research note described it in 2026. I built a comparison column out of them and labeled every cell with its provenance, but the column is softer than the price columns beside it.
The business itself argues back
Three. Return on equity reads 4.5% on the screen, and the filed annual figures ran 3.93%, 4.00%, 4.02% and 4.41% across 2022 to 2025, a spread of 0.48 percentage points over four years. A company earning that on its book will trade below book in most markets, and that explanation needs no discount story attached to it. I chose not to build this article on that observation, and it remains the most economical account of the price.
Four. First-half 2026 operating cash flow was negative KRW 5.04bn against positive net income of KRW 9.60bn. Seed businesses collect and ship on opposite halves of the year, so this shape recurs, but recurring and comfortable are separate findings and I only verified the first.
And my own framing argues back
Five. I did not evaluate a single variety. I do not know why growers choose this company’s pepper seed over another’s, how long that preference holds, or what a compressed breeding cycle does to a catalogue already in the ground. In an earlier draft I had a confident paragraph about the durability of a seed catalogue, and when I tried to source it I found I had nothing, so it is gone. What replaced it is this sentence admitting the hole. The nearest thing I have written to a study of the customer side of Korean agriculture is a piece on the tractor maker selling to the same farms, and that one covers machinery cycles without touching genetics.
My marker on NH Nongwoo Bio stock
Where I stand
No position and no order. At KRW 112.5bn of market value this sits far outside the size range where I take a stance, so what I am recording is an observation and the conditions that would end it. The distinction I am holding onto is this one: spending that buys time is worth something only for as long as time stays expensive. Everything I found about this company is consistent with a competent breeder spending like its international peers. Nothing I found tells me what that spending will be worth in five years.
What ends this piece
Two conditions. First, if an audited disclosure puts research spending materially below the reported range, then the framing above is measuring something that is not there and I rewrite it from the filings instead of the press. Second, if Farm Hannong or any other competitor publishes evidence that a compressed cycle produced commercially planted varieties, then the ten-year cycle stops being an argument for this company and becomes an argument against it.
Both conditions share a property worth naming. Neither one arrives on a scheduled reporting date. Audited research figures sit in notes I have to go open, and a competitor’s technical result appears whenever that competitor decides to publish it. So the moment either condition is met is a moment I only catch if I happen to be looking. A thesis whose exit depends on my attention instead of a filing schedule is one I have to log differently, and I am logging this one that way.
What I check next
The disclosure I could not open
The audited notes to the FY2025 annual report should carry a research and development expense line. That single figure resolves the 15% and 20% question, converts my softest column into my hardest, and tells me whether this company spends like KWS or like Corteva. It is the first thing I do when I return to this name.
The date on the file
The third-quarter report is statutorily due on November 15, 2026, which falls on a Sunday, so it will land on Monday, November 16. By then the September 4 close I have used throughout will be well out of date, and so will the twenty-session turnover figure. When I reopen this file, the first thing I recalculate is the price line, and the second is whether either ending condition above quietly passed while I was not watching.