Shift Up Stock Clears Seven Tests That Skip Its Cash Line
The screening checklist I keep open while I work has seven lines in it. Revenue scale, operating margin, EPS, ROE, P/E, P/B, and whether operating profit is positive. Across the Korean companies I have written up on this site I do not remember one clearing all seven at once. Shift Up stock did, on the close of Friday, September 11, 2026, at KRW 31,400 a share.
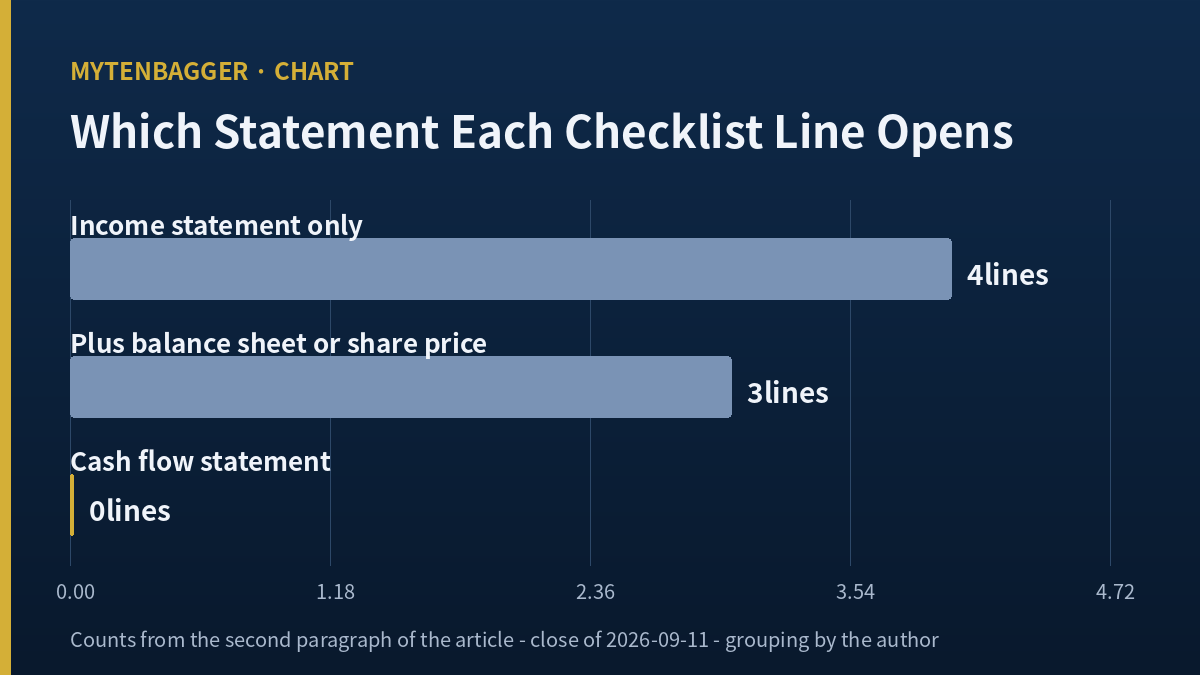
A perfect pass is the kind of result that ought to slow me down instead of speeding me up. So instead of reading the score I read the seven lines, and I asked of each one which financial statement a person would have to open to fill it in. Four of them need only the income statement. Three of them need the income statement plus either the balance sheet or the share price. None of them needs the cash flow statement.
That is the whole of what I found, and everything below is me checking it.
Contents
What a seven for seven scorecard leaves out
Revenue scale and the positive operating profit test are answered by one page of the income statement. Operating margin needs two figures from that same page. EPS needs net income from that page, divided by the share count. ROE takes net income from the income statement and divides it by equity on the balance sheet. P/E divides the share price by EPS. P/B divides the share price by book value per share.
Seven lines, three statements touched, and the cash flow statement untouched. I do not think that is an error. A quick screen built to separate expensive companies from cheap ones and profitable ones from unprofitable ones can reasonably stop there. What I wanted to know was narrower: in this particular company, what does that choice hide?
For context on the pass itself, the values were revenue of KRW 294.5 billion against a KRW 100 billion threshold, operating margin of 61.6% against a 5% threshold, EPS of KRW 3,261 against zero, ROE of 22.7% against 10%, a P/E ratio of 9.63 against a ceiling of 15, a P/B ratio of 1.91 against a sector ceiling of 3.0, and operating profit of KRW 181.4 billion against zero. Several of those pass by an enormous margin. The margin test in particular clears by more than ten times, so no plausible period would fail it.
Shift Up stock and the eighth line I wrote in myself
I added one line to the checklist and kept the format of the other seven. The positive operating profit test asks whether one income statement figure sits above zero, so my eighth line asks whether the most recent quarter of operating cash flow sits above zero. Same form, different statement.
Then I went looking for the figure and it was not there.
A figure that exists only once I take one number out of another
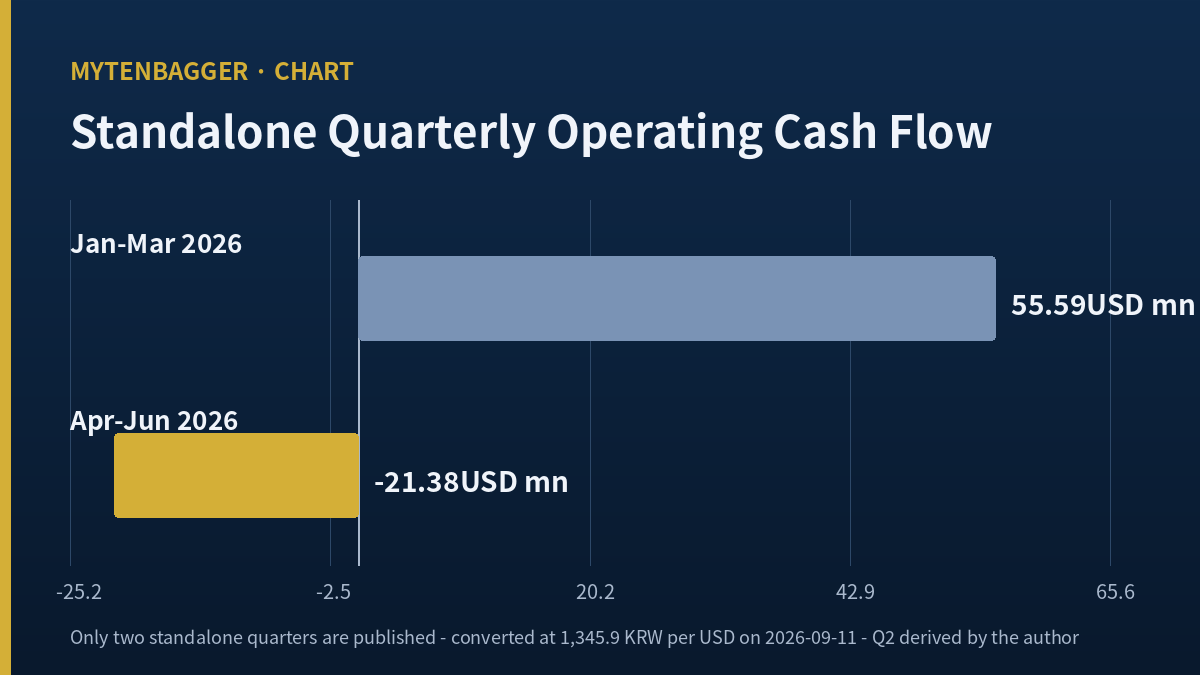
Korean interim filings report flow items on a year to date basis. The half year report carries cumulative operating cash flow of KRW 46.04 billion for the six months to June 30, 2026. The first quarter report carries KRW 74.82 billion for the three months to March 31, 2026. Both are positive. The second quarter on its own is not published anywhere, because the filing format never asks for it.
So I worked it out. Take the first quarter figure out of the half year figure and what remains is negative KRW 28.78 billion. Do the same with capital expenditure and the quarter comes to KRW 2.40 billion of spending, which puts free cash flow for that quarter at negative KRW 31.18 billion. Both are my own arithmetic on filed numbers, and I label them that way every time they appear.
In the same three months the company reported net income of KRW 41.74 billion. One statement says the quarter was profitable and the other says cash left the building. Neither is wrong. They count different things, and the checklist reads only the first of them.
Shift Up stock in dollars for the quarter that went negative
Because most people reading this site hold Korean exposure in dollars, here is the same quarter converted at 1,345.9 KRW per USD, the Seoul foreign exchange market daytime close of 2026-09-11 as reported by Korean financial press.
| Item | USD | KRW billion | Where it comes from |
|---|---|---|---|
| Six months to June 2026, operating cash flow | 34.21 million | 46.04 | Filed |
| Three months to March 2026, operating cash flow | 55.59 million | 74.82 | Filed |
| April to June 2026, operating cash flow | -21.38 million | -28.78 | My arithmetic |
| April to June 2026, net income | 31.01 million | 41.74 | My arithmetic |
Every dollar figure in this article uses that one rate and that one date. The market capitalization on the same basis is US$1.3705 billion, from 58,742,038 shares at KRW 31,400. Total liabilities at the end of June 2026 stood at US$94.82 million against equity of US$730.16 million, which is a liabilities to equity ratio of 12.99%. This is a company with almost no borrowing and a large cash balance, and financial income landing below the operating line is the explanation I would expect for net income running above operating profit. I did not open the note that would confirm it, so I am offering that as my expectation and leaving it there.
Twelve months of cash set against twelve months of profit
A single negative quarter proves very little on its own, so I widened the window to the last four quarters I can reconstruct. Adding the four individual quarters from July 2025 through June 2026 gives operating cash flow of US$92.75 million, capital expenditure of US$5.41 million, free cash flow of US$87.34 million, and net income of US$143.26 million.
Free cash flow over those twelve months came to 60.97% of reported net income. Operating cash flow came to 64.75%. Both are my own arithmetic on filed quarterly data. Those are perfectly ordinary conversion rates for a profitable company, and if I had only ever looked at the trailing year I would have written a shorter and duller article.
The full year 2025 looks even better. Operating cash flow of US$116.78 million against net income of US$142.23 million, and free cash flow of US$114.88 million, which is 80.77% of profit. So at annual resolution this company converts profit into cash at a healthy clip, and the negative quarter disappears entirely inside the average.
The four quarters that make up that trailing year, converted at the same rate, ran US$44.05 million, US$14.50 million, US$55.59 million, and negative US$21.38 million of operating cash flow. Net income in the same four periods ran US$40.59 million, US$43.58 million, US$28.08 million, and US$31.01 million. The profit line moves inside a narrow band across the year while the cash line covers a range of roughly US$77 million from its best quarter to its worst. The distance between how steady one statement looks and how unsteady the other looks is exactly what my eighth line was built to surface, and it stays invisible at annual resolution because the swings cancel out.
What survives the widening is the pattern underneath it. When I reconstruct every individual quarter I can reach, the first and third quarters bring in far more cash than they book in profit, and the second and fourth bring in far less. Seven consecutive quarters follow that alternation without one exception. The April to June quarter of 2026 is the strongest version of that alternation and never a break from it. I could not confirm what drives it, because the cash flow notes I would need to settle the question are in an audit report I was unable to open, so I am recording the pattern and leaving its cause unclaimed.
One caveat belongs with that seven quarter run, and the fault in it is mine alone. The source statements for the earlier quarters are parent only, while the two 2026 quarters are consolidated, and one quarter in the middle is a consolidated annual figure with a parent only nine month cumulative taken out of it. Non-controlling interests are reported at zero at both the end of 2025 and the end of June 2026, so I expect the distance between the two bases to be small here, but I have not measured that distance and I am not going to assert it. What I will say is narrower: the negative quarter itself comes from consolidated figures on both sides of the operation, and the two 2026 quarters are compared on matching ground.
Shift Up stock beside a Japanese studio whose screen carries a cash line
For a company this size the closest structural comparison I could verify is Capcom, listed in Tokyo under 9697. It is a studio that owns a small number of large properties, sells across console and mobile, and carries no debt against a large cash position. I pulled its figures from a US financial data page on September 5, 2026, six days before my Korean close, and I checked three of them before using any.
Capcom traded at JPY 4,248.00 with 418.32 million shares, which reproduces the JPY 1.78 trillion market value shown on the same page. Dividing the price by EPS of JPY 158.95 gives 26.73, matching the printed P/E. Dividing by book value per share of JPY 685.80 gives 6.19, matching the printed P/B. All three reproduce inside the rounding shown, so I was willing to use the rest of the page.
| Measure | Shift Up | Capcom | Basis |
|---|---|---|---|
| Operating margin | 61.59% | 41.65% | Korean full year 2025, Japanese trailing |
| Profit margin | 64.99% | 30.19% | Same as above |
| Free cash flow over profit | 60.97% | 66.74% | Both trailing twelve months, both my arithmetic |
| P/E ratio | 9.63 | 26.73 | Both from vendor screens |
| P/B ratio | 1.91 | 6.19 | Both from vendor screens |
The row I care about is the third one. Over twelve months these two studios turn almost the same fraction of reported profit into free cash, 60.97% against 66.74%, and I worked out both sides myself from the same kind of inputs. At annual resolution the two companies look alike on the measure that my eighth line was invented to test. It is only when the Korean year gets cut into quarters that one of the pieces comes out below zero.
There is a second thing I noticed, and it concerns screens more than it concerns either company. The Japanese page I used prints a free cash flow figure as a standard field. The Korean screen I use prints an operating cash flow figure and a free cash flow figure too, but neither one is among the seven lines that produce the score. The data was available on my own screen the whole time. It simply was not being graded.
What I compared and what I left alone
I compared operating margin, profit margin, the cash conversion row, and the two valuation ratios. Those five survive the crossing because each is a percentage or a ratio computed inside a single currency, so no yen ever meets a won in this article.
I left alone revenue scale, ROE, dividends, beta, and the fifty two week ranges. Revenue scale would need a yen to won conversion I have no verified rate for. ROE and dividends sit on accounting conventions and fiscal calendars that differ between the two markets in ways I cannot adjust for from a summary page. Shift Up publishes no dividend at all: the field on my screen is marked undisclosed while a payout ratio of 55.5 is still sitting in the raw data, and I will not use a ratio whose numerator I cannot see. I am naming these five once and then not letting them back into the argument.
Which board Shift Up stock sits on, and who already holds it
Shift Up trades on KOSPI, the larger of Korea’s two main boards, which lists the established industrial and financial names. KOSDAQ is the smaller board where most Korean game developers sit, and where several of the peers I have written about are listed. Shift Up sitting on the senior board reflects a size and listing decision, and I read no quality signal into it.
There is no American depositary receipt for this company, so every share outstanding trades on the Korean board itself. Foreign investors already hold 36.89% of them according to my screen, which is the number I actually use: a third of the register sits with holders who priced the same filings I am reading.
I have not confirmed whether either one holds this name at all, and I have been unable to get a current holdings list I trust across many attempts now. What I can say is structural: at US$1.3705 billion this company sits far down any capitalization weighted ladder of Korean equities, so even if it is in the basket the position would be small enough that the question this article asks would never reach the index holder as anything they could act on.
The share price is down 24.61% over twelve months according to my screen, while the trailing four quarters produced US$143.26 million of net income. I mention the two together only because the checklist reads the second and not the first.
One more note on method, because the rebuilding step is the part a reader should be most suspicious of. Korean interim reports give flow items on a cumulative basis, so a standalone quarter is never a filed number anywhere in this market. That is a filing convention and not a company choice, which means every Korean name I write up carries the same gap, and in most of them the gap is dull because the quarters look alike. Here it matters because removing one figure from another turns a positive number negative, and because the alternation says the same operation would have flipped the sign in three earlier quarters as well if the amounts had been slightly larger.
In the Krafton piece I set a headline sales figure against a legal claim that those same sales were enlarging, and the two turned out to be one contract seen from two ends. This is a milder version of the same discipline: two filed figures, one operation between them, and a result that neither figure shows on its own.
Where I would be wrong about this reading
Six ways this argument fails, each with the document I would need to open to settle it.
- The alternation is ordinary seasonality. If app store settlement and corporate tax payments cluster into particular halves of the year, this pattern is simply what the calendar looks like on a cash statement. Settling it needs the working capital movement note in the 2026 half year audit report.
- Annual resolution is the honest resolution. Full year 2025 turned 80.77% of profit into free cash and the trailing twelve months turned 60.97%, both healthy. Slicing a year into quarters manufactures volatility that no owner of the business experiences. Settling it needs the 2026 annual report cash flow statement.
- A screen is allowed to be narrow. A checklist designed to sort valuation and profitability is not defective for skipping the cash statement, and my eighth line changed the tool’s purpose instead of exposing its fault. Settling it needs the design document behind the checklist, which I could not obtain.
- The weak quarter was announced in advance. The company attributed the year over year fall to a high base created by a PC release in the comparable quarter of 2025, and Korean sell side repeated that reading. If so, nothing about the quarter should surprise anyone. Settling it needs the per title revenue breakdown in the 2025 second quarter report.
- Buybacks may have reversed the share count direction. A repurchase program ran from March to September 2026 with a cancellation planned afterward, and if it executed as described the share count moves the other way from the employee option issuance of the prior year. Korean trade press reported in January 2026 that option exercises during 2025 created 626,720 new shares, which is a larger number than the 330,000 shares the March filing set out to cancel; I am relaying that reporting and have not traced the option figures back to the original filings myself. Settling the direction needs the completion report filed after the program window closed.
- Unreleased titles sit outside every estimate table. Korean brokerages carry 2026 and 2027 revenue estimates below the 2025 result, and the company has said a cross platform title and a console sequel are in development. Either one landing on time makes those tables stale. Settling it needs the company’s own release announcement and the estimate revisions that follow it.
I have written about this sector before from other angles. In the NCSoft piece the problem was where the profit being divided had come from, and in the Neowiz piece it was three desks arriving at one reason in ninety days. Here the income statement figures are fine and the question is about a statement nobody consulted.
The two documents that would change my reading of Shift Up stock
I hold no position and have no order working. What decides whether I keep watching or stop is not the next move in the price. It is two specific filings, neither of which I can produce, both with dates already fixed by someone else.
The first is the third quarter report for 2026. Its statutory deadline falls on November 15, 2026. It will carry nine month cumulative operating cash flow, and I will take the half year figure of KRW 46.04 billion out of it to rebuild the third quarter on its own. If the seven quarter alternation holds, that quarter should be strongly positive. If instead a second consecutive quarter comes out below zero, what I found was not seasonality, and I move from watching to avoiding.
The second is the completion report for the share repurchase program, whose window closed on September 10, 2026. If the buying was completed and the planned cancellation follows within the year, shareholder returns for this company overtake the dilution from the prior year’s option exercises. If it was not, they do not.
The two documents test different things. The first checks a number I built myself. The second checks a promise the company wrote down. Neither one is mine to produce, which means the only work left on my side is to write down the dates and open the files when they arrive. I have put November 16, 2026 in the calendar for the first.
Price and screen figures are as of the close of Friday, September 11, 2026, at KRW 31,400, vendor data from Kiwoom. Financial statement figures come from Korean regulatory filings, and standalone quarters are rebuilt from cumulative filings by the author. Share count 58,742,038. Currency conversion at 1,345.9 KRW per USD, the Seoul daytime close of 2026-09-11.
Sources consulted, several of them Korean language and paraphrased by me instead of quoted: Money Today on the second quarter result, August 11, 2026, Bloter on per title revenue, August 12, 2026, Digital Today on the buyback and cancellation filing, March 10, 2026, Etoday on a Korean brokerage estimate revision, August 12, 2026, Hankyung consensus page, Capcom statistics page, September 5, 2026.