Gaon Cable Stock Earns 10.62% on a 2.02% Net Margin
The first number I threw out was 12.83. That is the price-to-book one vendor page shows for Gaon Cable stock, and it is built on a book value from December 31, 2025. A half-year report has been filed since. Rebuilt on the June 30, 2026 balance sheet the ratio is 11.71, and that is the figure I use below. Finding the 9.6% gap between those two is what sent me to the other end of the same equation, where a return on equity of 10.62% turned out to have almost nothing to do with the margin.
Gaon Cable (KOSPI: 000500) is a Korean wire and cable maker, 81.71% owned by unlisted LS Cable. KOSPI is the senior board of the Korea Exchange in Seoul, where the country’s large industrials list. At the September 3, 2026 close of KRW 208,500 per share, the company carries a market value of KRW 6,208.6 billion, roughly USD 4.57 billion. Against 2025 net profit of KRW 51.4 billion, that is 120.80 times earnings (my calculation).
| Figure | Basis | Does it carry weight in what follows? |
|---|---|---|
| Return on equity 10.62% | FY2025, Korean regulatory filing | Yes. It is the number the whole piece takes apart |
| Net margin 2.02% | FY2025, same filing | Yes. Lowest of the five companies I lined up |
| Asset turns 1.85 and leverage 2.85 | My calculation from FY2025 filed statements | Yes. These two legs produce the return |
| Price to book 11.71 | Sept 3, 2026 price over Jun 30, 2026 book, my calculation | Yes, with the caveat that its two dates differ |
| Price to earnings 120.80 | Sept 3, 2026 price over FY2025 profit, my calculation | Context only. The composition of the return matters more to me |
| Share count 29,777,607 | Post bonus issue, new shares listed July 23, 2026 | Yes. Every ratio above sits on it |

Contents
What Gaon Cable stock costs against what the company earned
The multiple, and the two inputs under it
I calculate the market value as 208,500 won times 29,777,607 shares, which is KRW 6,208.6 billion. Divided by 2025 consolidated net profit of KRW 51.4 billion, that is 120.80 times. Korea’s regulatory filing system reports no non-controlling interest for this company, so the parent-owner figure and the consolidated figure are the same, and the multiple does not shift depending on which one I pick.
Revenue for 2025 was KRW 2,545.7 billion, about USD 1.87 billion. Operating profit was KRW 79.2 billion. The company turns roughly 1.87 billion dollars of sales into 38 million dollars of profit, and the market values that at 4.57 billion dollars.
The first half of 2026 improved the operating line
Through June 30, 2026 the company reported revenue of KRW 1,633.0 billion, operating profit of KRW 64.0 billion and net profit of KRW 42.5 billion. Against the same six months of 2025 that is revenue up 27.32% and operating profit up 41.78%, both my calculation from the filed figures. ZDNet Korea reported on July 20, 2026 that second-quarter operating profit came in at KRW 36.1 billion, up 55.5% year on year, which agrees with my own arithmetic to one decimal place.
The net margin for that half was 2.60%, up from 2.02% for full-year 2025. So profitability is trending upward, from a very low base. The multiples above use the full-year 2025 figure because that is the last audited annual number available.
The return that looks ordinary until I take it apart
A 10.62% return on equity, in three parts
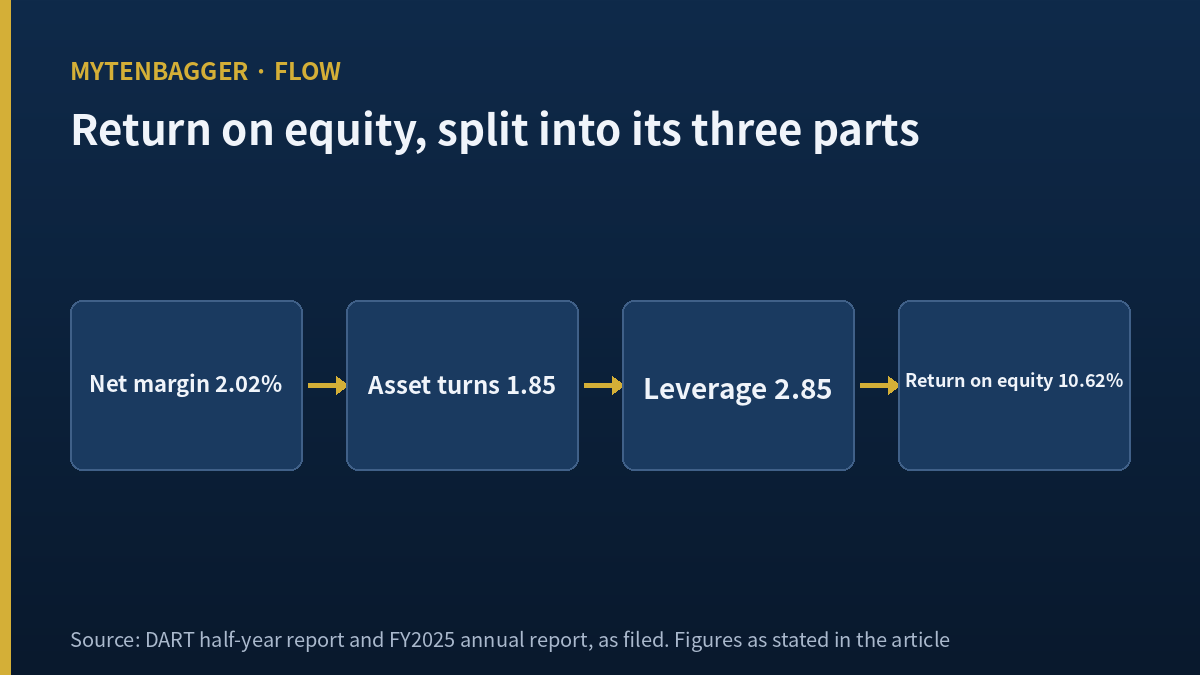
Korea’s filing data reports return on equity of 10.62% for 2025. Taken alone that reads as an unremarkable manufacturing return. I broke it into its three components using the same filed statements:
- Net margin: KRW 51.4 billion of profit on KRW 2,545.7 billion of revenue, or 2.02%.
- Asset turnover: KRW 2,545.7 billion of revenue on KRW 1,377.9 billion of total assets, or 1.85 times (my calculation).
- Leverage: KRW 1,377.9 billion of assets on KRW 483.8 billion of equity, or 2.85 times (my calculation).
The three multiply back to the reported 10.62%, but only at full precision: 2.0189% times 1.8475 times 2.8482. The rounded figures I printed just above give 10.65%, and that 0.03 of a point is rounding and nothing more. I mention it because the closure is the whole reason this decomposition is worth doing. The components are the return, carried to more decimal places than I show.
What the three parts say
Two of the three legs are doing the work. Asset turnover of 1.85 is high for a manufacturer of this kind, and leverage of 2.85 times is the second lever. The margin leg contributes almost nothing on its own. A business earning 2.02% on sales reaches a double-digit return on equity only by pushing volume through a thin asset base and financing part of that base with borrowed money.
The debt leg has been getting heavier. On June 30, 2026 total assets were KRW 1,661.2 billion against equity of KRW 530.2 billion, which is leverage of 3.13 times (my calculation), up from 2.85 at the end of 2025. Total liabilities rose by KRW 236.8 billion over the half. The debt-to-equity ratio in the filing moved from 184.82% to 213.29%.
Four years of the same decomposition
The one test I could run on this company’s own history
A single year of decomposition tells me how the return was built once. Running the same three inputs across every year in the filing tells me which leg has been changing. I did that for 2022 through 2025, and each year closes on its reported return to two decimal places.
| Fiscal year | Net margin | Asset turns | Leverage | Product | Reported ROE |
|---|---|---|---|---|---|
| 2022 | 0.74% | 1.88 | 2.48 | 3.45% | 3.45% |
| 2023 | 1.19% | 1.87 | 2.42 | 5.41% | 5.41% |
| 2024 | 1.47% | 1.66 | 2.30 | 5.59% | 5.59% |
| 2025 | 2.02% | 1.85 | 2.85 | 10.62% | 10.62% |
Source for margin and reported return is the Korean regulatory filing; the turns and leverage columns and the product column are my calculation from the revenue, asset and equity figures in the same statements. Every product row lands on its reported figure at the precision printed.
What moved and what did not
Over those four years the return roughly tripled, from 3.45% to 10.62%. The margin leg rose in each of the three steps, from 0.74% to 2.02%, an average step of 0.43 points. Leverage fell for two years and then jumped, from 2.30 in 2024 to 2.85 in 2025. Asset turns went the other way in 2024, dropping to 1.66, before recovering to 1.85.
So the improvement is real and it comes mostly from the margin leg, which is the leg I keep saying contributes almost nothing. Both statements hold at once. The margin has more than doubled and it is still 2.02%. That is the shape of this business: the percentage moves a lot in relative terms and stays small in absolute ones, and the return only reaches double digits once leverage is added on top of it.
Gaon Cable stock and a margin that sits last among its peers
Five companies, one decomposition
My comparison basis for this piece is narrow on purpose. I included only listed makers of wire, cable or electrical power distribution hardware. I used price against book and return on equity, then broke the return into the same three legs for each company, taking margin, turns and return from stockanalysis.com and deriving each leverage figure from the other three. I did not convert currencies, because a ratio does not change when the currency does and converting only adds error.
| Company | Price to book | Return on equity | Net margin | Asset turns | Leverage | As of |
|---|---|---|---|---|---|---|
| Gaon Cable (KOSPI: 000500) | 11.71 (mine) | 10.62% | 2.02% | 1.85 (mine) | 2.85 (mine) | price Sep 3, 2026; book Jun 30, 2026; ratios FY2025 |
| Nexans (EPA: NEX) | 2.95 | 11.44% | 4.51% | 0.99 | 2.56 (derived) | Jul 15, 2026 |
| Prysmian (BIT: PRY) | 4.88 | 22.36% | 6.51% | not obtained | not derivable | Aug 29, 2026 |
| nVent Electric (NYSE: NVT) | 6.02 | 15.75% | 12.38% | 0.70 | 1.82 (derived) | Sep 3, 2026 |
| Fujikura (TYO: 5803) | 13.78 | 38.96% | 15.67% | 1.41 | 1.76 (derived) | Aug 29, 2026 |
The ordering I get from that table
Gaon Cable has the lowest return on equity of the five and the lowest net margin of the five. It also carries the highest leverage of the four for which leverage can be derived, and that gap widens once the June 2026 figure of 3.13 replaces the 2.85 in the table. On price against book it ranks second, behind Fujikura.
Dividing each company’s price-to-book by its return on equity gives Gaon Cable 1.103, nVent 0.382, Fujikura 0.354, Nexans 0.258 and Prysmian 0.218 (all my calculation). The Korean company’s figure is 2.89 times the next highest, nVent’s 0.382.
One caveat on my own row before that comparison is used for anything. The 11.71 sits on a June 30, 2026 book and the 10.62% sits on a December 31, 2025 equity base, so my 1.103 mixes two dates in a way the four peer figures do not. On the December book the same ratio is 1.208. Both readings sit above every peer, which is why I keep it, and neither is basis-clean.
That ratio is a blunt measure and I do not want to lean on it too hard. It says nothing about growth ahead, and this company has a growth story I cover further down. What it does say is that the price is not being set by the return the business currently produces.
Where the comparison is loose
Seven places, and I would rather list them than bury them. The vendor dates run from July 15 to September 3, 2026. My row I calculated and the peer rows I took from a data service. The peer figures are trailing twelve months and mine are a fiscal year. Prysmian’s asset turnover was not available, so its decomposition is incomplete and its leverage cannot be derived. My price-to-book uses a June 30, 2026 book, and the peer figures use whatever balance sheet date that service carries. Fujikura’s business mix includes optical fiber and connectivity products, a different margin structure from a cable maker. And nVent makes enclosures, fastening and thermal-management products, so its 12.38% margin and 0.70 turns come from a different kind of business again.
Does the leverage leg pay for itself?
I calculated the spread instead of assuming it
A rising leverage leg lifts the return on equity only for as long as the assets earn more than the debt costs. That is a spread, and it is easy to assert without computing. So I computed it.
For 2025: operating profit of KRW 79.2 billion on total assets of KRW 1,377.9 billion is an operating return on assets of 5.75%. Interest expense of KRW 40.7 billion on total liabilities of KRW 894.1 billion is 4.55%. The spread is 1.19 points (all my calculation). Annualising the first half of 2026 gives 7.70% against 4.50%, a spread of 3.20 points.
Measured on net profit instead of operating profit, 2025 gives a return on assets of 3.73% against the same 4.55% cost, and the spread turns negative. Which measure is right depends on what the borrowing funded, and I could not split the KRW 236.8 billion liability increase between borrowings and trade payables anywhere in what I read. That split is the single thing I would most want before deciding how much weight the leverage leg can take.
Interest cover says the same thing from the income statement
Interest expense for the half was KRW 25.4 billion, and half-year operating profit of KRW 64.0 billion covers it 2.51 times (my calculation), against 1.95 times for the full year 2025. So cover improved even though leverage rose. That is consistent with a positive operating spread and it does not settle the net-profit version of the question.
I looked at a company in the same sector earlier and found the mirror image of this. Taihan Cable funded four years of growth mostly out of shareholder money, taking in KRW 952.5 billion through two rights issues. Gaon Cable took in nothing from shareholders over the half in question and let liabilities carry it. Neither route is automatically better. They put the risk in different places, and the place it sits here is the interest line.
Gaon Cable stock sits on a share count that changed twice this summer
A bonus issue that put no money in
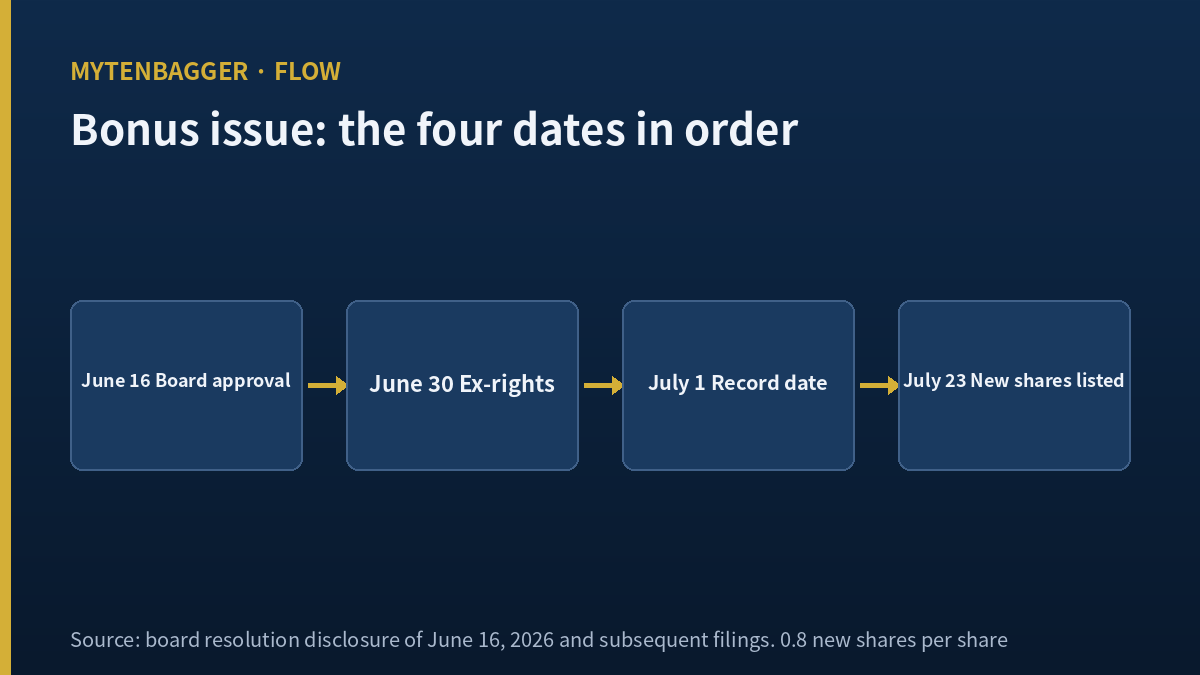
On June 16, 2026 the board approved a bonus issue of 0.8 new shares for every share held. Global Economic, a Korean outlet, reported the ratio and the timetable the following day. The company moved KRW 66.2 billion out of its share premium account into paid-in capital and issued 13,234,492 new shares. Nothing entered the company’s bank account. The record date was July 1, 2026, the ex-rights date was June 30, 2026, and the new shares listed on July 23, 2026.
The share arithmetic reconciles without a residual, which is how I confirmed the count. Before the issue: 16,543,115 shares at a par value of 5,000 won gives paid-in capital of KRW 82.7 billion. After: 29,777,607 shares gives KRW 148.9 billion. The difference of KRW 66.2 billion is the share premium the filing says was used.
Two dates, twenty-three days apart
The quoted price adjusted on June 30, 2026 and the registered share count adjusted on July 23, 2026, twenty-three days later. Any market value or multiple produced in that window is unreadable unless the writer says which share count was used, and the two answers differ by a wide margin. That is why every multiple I calculate here uses the September 3, 2026 close and 29,777,607 shares, with the balance sheet date named alongside wherever a book value is involved.
Two book values behind Gaon Cable stock, and the one I used
Why the vendor page shows 12.83
The book value per share on WiseReport, a Korean company data service, is 16,247 won. That divides equity of KRW 483.8 billion at December 31, 2025 by today’s 29,777,607 shares. My own figure divides equity of KRW 530.2 billion at June 30, 2026 by the same share count and gives 17,806.94 won (my calculation). The two differ by 9.6%.
Six months of retained profit is most of that difference. It is not all of it. Net profit for the half was KRW 42.5 billion against an equity increase of KRW 46.5 billion. The remaining KRW 3.9 billion I could not attribute, and the 2025 dividend of KRW 1.7 billion, if it was paid within the half, would make that residual larger.
Neither figure is wrong. The vendor figure is the last audited annual book, mine is the last filed book. I chose the more recent one and I name the balance sheet date every time the ratio appears, because a price-to-book quoted without its date is not something a reader can check.
Where the growth story comes from
A busduct supply arrangement with a US technology buyer
Busduct is a metal enclosure that carries electrical power through a building, and data centers use a great deal of it. The Korea Economic Daily reported on May 18, 2026 that Gaon Cable had won a busduct supply arrangement with Meta for AI data centers, described as being on a scale of four trillion won (the headline dollar figure behind that build-out, and what it actually covers, is broken out in Korea AI Infrastructure Stocks After the $950 Billion Summit), and more precisely as an expectation that cumulative supply through 2030 would exceed that figure. Ajunews, another Korean outlet, described it as a five-year long-term supply agreement. The 2026 initial tranche was reported at roughly KRW 50 billion.
I keep the word “expectation” in that sentence deliberately. Fifty billion won against 2025 revenue of KRW 2,545.7 billion is 1.96% of a year’s sales (my calculation). Four trillion won spread evenly across five years would be KRW 800 billion a year, a different order of magnitude. Which of those two figures the share price is looking at is, to me, the question this company turns on.
Export mix is moving, and I could not verify the percentages
Economist Korea reported on August 6, 2026 that export revenue rose from KRW 202.6 billion in 2024 to KRW 651.1 billion in 2025, a factor of 3.21 (my calculation), with an export share of about 40% by the first quarter of 2026. The direction is not in doubt and it matters for the margin leg, because the company describes its overseas work as carrying better pricing than its domestic work.
The revenue base behind the reported percentages I could not match to the consolidated statements. My Korean-language piece on this company works through why. For this piece I take the direction and leave the percentages out of my argument.
Why a company this closely held stays listed
LS Cable and four related parties hold 81.71%, leaving a free float of 18.29% (my calculation). Newdaily Biz, a Korean business outlet, reported on June 17, 2026 that roughly a year earlier, as LS Cable raised its holding toward 81.62% and planned further purchases, a voluntary delisting had been discussed, and that the purchase plan was dropped as the share price rose. The same report framed the continued listing as a way for the market to price the unlisted parent’s North American data center business. If that reading holds, a bonus issue that multiplies the share count of a company with an 18% float is about creating tradable shares, and raising money was never the point.
Gaon Cable stock and the figure with no house attached
The named house published no valuation
A note from KB Securities analyst Kim Sun-bong dated August 6, 2026 carries a Not Rated designation and no valuation figure. It does carry 2026 estimates: revenue of KRW 3,543.6 billion, up 39.2%, and operating profit of KRW 167.6 billion, up 111.6%, at a 4.7% operating margin. The stated basis is a North American busduct order book of KRW 5.3 trillion at LSCUS, a US subsidiary.
I could not establish from the group structure filings whether LSCUS consolidates into Gaon Cable or sits on the LS Cable side. Until that is settled, whether the 5.3 trillion figure reaches this company’s income statement is also unsettled. Nor do I know whether that order book and the four trillion won Meta arrangement describe overlapping volumes.
The estimate is worth checking against the half-year. Operating profit of KRW 167.6 billion for the year, with KRW 64.0 billion already reported in the first half, needs KRW 103.6 billion in the second half, or 1.62 times the first half (my calculation). This company’s fourth quarter of 2025 produced operating profit of KRW 7.9 billion, its weakest quarter that year. That does not make the estimate wrong. It means the conditions attached to it are conditions I could not read in the source.
Two facts I record and neither of which I adopt
The only research I could attach a name to declined to put a number on this company. The only number I could find has no name on it: WiseReport’s consensus page carries a valuation of 290,000 won and a count of one contributing institution as of September 2, 2026, which sits 39.09% above the September 3 close (my calculation), and the page does not say whose figure it is.
So I record both facts and adopt neither. For a company with a market value above six trillion won, one contributing institution is thin coverage on its own, and a valuation whose author I cannot name is not something I can weigh against my own reading.
Gaon Cable stock for a US-based reader
What blocks a US position here is the float
I found no American depositary receipt for this company. The usual next step is a broker with Korea Exchange access, and that step exists here. The obstacle I ran into is a different one. With 81.71% held by the parent group, the float is 18.29% of 29,777,607 shares, about 5.44 million shares (my calculation). At the September 3, 2026 close that tradable side is worth roughly KRW 1,136 billion, about USD 0.84 billion. I could not obtain a reliable daily volume series to size a position against, which is itself part of the answer.
What I can say is that a float of this size is the constraint I would have to solve first. So the position I can take in the United States is a reading position, and I say that as someone who has not tried to take another.
Currency and timing
Prices and multiples in this piece reflect the September 3, 2026 close as I checked them at the time of writing. Dollar figures are approximate, converted at about 1,359.3 won per dollar on that same date, the Seoul market close as reported by Money Today, a Korean financial outlet. The Korean won is the reference currency throughout. Financial statement figures come from Korea’s regulatory filing system as loaded into the data services I used.
My stance on Gaon Cable stock and what would break it
Where I stand
I do not own this and I have no order in. My first filter was size, and the company passed it. What I looked at after that was the composition of the return, and what I found was a return built on turns and borrowing, with a margin leg that has not exceeded 2.02% in any of the four filed years. That is a workable structure for as long as volume grows and the spread stays positive. It is a fragile one if either reverses, because the margin leg has no slack in it to absorb a shock.
The condition that breaks my reading
If the 2026 third-quarter report, due by law on November 16, 2026, shows a nine-month net margin at or above 2.90%, my reading is wrong, whatever leverage does. I am setting one leg. A second leg would only make the test harder to fire without making it sharper. My reading is about where the return comes from, and a margin that reaches 2.90% would be a 43.6% jump on the 2.02% of 2025 and would move the margin leg from a rounding presence to a real share of the return. Leverage I will record alongside it as context.
I checked whether the condition is already true. The first half delivered 2.60%, so it is not. I checked what it would take to fire. If third-quarter revenue lands near the second quarter’s KRW 869.4 billion, a nine-month margin of 2.90% needs about KRW 30.0 billion of net profit in the quarter, a quarterly net margin of 3.45% (my calculation). This company’s best quarter on record in the data I hold is the third quarter of 2025 at 2.88%. So the threshold sits 1.20 times above the record, which is demanding. It is also within reach of a company whose margin has risen in three consecutive annual steps and again in the first half.
I checked the direction against the way the two legs actually move, and they move opposite ways. The margin has risen in each of three annual steps and again in the first half, moving toward the threshold. Leverage has gone from 2.85 to 3.13, moving away from any deleveraging test. That asymmetry is why I put the test on the margin leg alone: a two-legged test would have been unfalsifiable here, and an unfalsifiable condition is decoration.
What I do when it fires
Previous pieces of mine stopped at the words “then I am wrong”. This one goes one step further. If the condition fires, I stop treating price against book as the interesting ratio and rebuild the comparison table on margin alone, because a company at 2.90% belongs in a different group from the one I placed it in above. If the third-quarter report arrives and the condition is neither true nor false, because a figure I need is not disclosed, I record it as undetermined and wait for the annual report. A missing disclosure is not a result. The primary source for judging this is the quarterly filing itself; the second is the company’s own results material; if neither carries the figures, the question stays open until March 2027.
One label I had to change
For a long time I filed high asset turnover under efficiency and left it there as a compliment. Working through this company changed the label for me. Turnover of 1.85 against peers running from 0.70 to 1.41 is a sign of a lean asset base. It is also a sign of a business that has to keep the volume moving, because there is no margin to fall back on. The same number reads as strength in one sentence and as exposure in the next, and which one it is depends entirely on the margin sitting beside it. I had been reading the number without its neighbor.
What argues against my reading of Gaon Cable stock
Things that cut against what I wrote, plus the gaps I did not close. Each is labeled with its direction.
- [Cuts against me] WiseReport’s consensus page carries 290,000 won, 39.09% above the last close. My only basis for discounting it is that I could not attach a name to it.
- [Cuts against me] KB Securities’ 2026 operating profit estimate of KRW 167.6 billion, if met, changes the earnings multiple substantially.
- [Cuts against me] The net margin has risen in each of three annual steps and again in the first half of 2026. My reading describes a leg that is moving against it.
- [Cuts against me] The operating spread is positive on both the 2025 and the annualised 2026 figures, at 1.19 and 3.20 points. The leverage leg is paying for itself on that measure.
- [Cuts against me] Interest cover improved to 2.51 times in the half from 1.95 times for the full year 2025, though leverage rose.
- [Cuts against me] Export revenue grew by a factor of 3.21 between 2024 and 2025, and the export share reached about 40% in the first quarter of 2026.
- [Cuts against me] The Meta arrangement runs five years with a cumulative expectation of four trillion won attached. Looking only at the initial KRW 50 billion may be too short a horizon.
- [Cuts against me] Economist Korea reported on August 6, 2026 that the US subsidiary’s 2026 revenue is expected to roughly double.
- [Gap] I could not establish whether LSCUS consolidates into this company, which leaves the KRW 5.3 trillion order book unattached to an income statement.
- [Gap] I do not know whether that order book and the Meta arrangement describe overlapping volumes.
- [Gap] The KRW 236.8 billion increase in liabilities is not split between borrowings and trade payables anywhere in what I read. I have an interest expense figure and no total borrowings figure, so the spread calculation rests on an approximation.
- [Gap] Prysmian’s asset turnover was not available, so one row of the comparison carries neither a turns figure nor a derived leverage figure.
- [Gap] A Korean credit rating opinion dated June 26, 2026 appears in search results but I could not open it, so I do not know the rating or the outlook.
- [Cuts both ways] An 18.29% float means small trades move the price, upward as readily as downward, and a voluntary delisting was discussed in the past.