HL Mando Stock: Six Years of Orders at One Year of Price
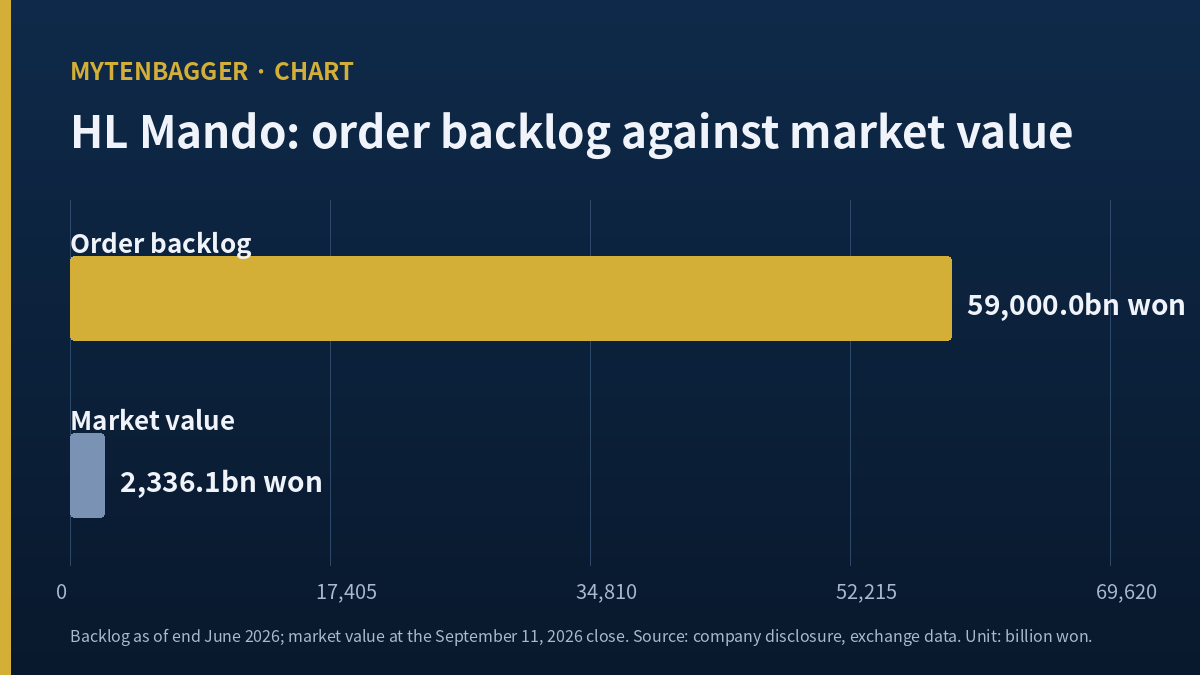
I started by turning a quantity into a length of time. HL Mando reported an order backlog of 59 trillion won as of the end of June 2026. The company’s first half brought in 4,806.9 billion won of revenue, which annualizes to 9,613.8 billion won. Divide the backlog by that run rate and you get 6.14 years of work already booked. I did the same division against reported 2025 revenue of 9,454.8 billion won and got 6.24 years. Both arithmetic results are mine, and both land in the same place: this company has something on the order of six years of business written down before it sells anything new.
Then I looked at what the market pays for the whole enterprise. At the close of Friday, September 11, 2026, the shares finished at 49,750 won, which puts the market value at 2,336.1 billion won, or about US$1.74 billion at that day’s exchange rate. The backlog, converted the same way, comes to roughly US$43.98 billion. The booked work is 25.26 times the company (my calculation). That ratio on its own means very little, and I want to explain why before I build anything on it.
  Close of Friday, September 11, 2026: 49,750 won

  /     Order backlog, end of June 2026 .......... 59,000.0 bn won
  //    Revenue, first half 2026 annualized ......  9,613.8 bn won
  ///   Years of work already booked .............      6.14 years
  ////  Market value at the close ................  2,336.1 bn won
  ///// What the forward multiple prices .........  11.60x one year

  Six years of orders. One year of earnings in the price.
Contents
HL Mando stock sits under a book of work six years long
HL Mando trades in Seoul under the code 204320 on the KOSPI, the senior board of the Korea Exchange, which carries the country’s larger industrial and financial names and is distinct from the KOSDAQ board that lists smaller and earlier-stage companies. The company makes braking, steering and suspension systems. Its customers are automakers in Korea, North America, Europe, China and India, and electronics-led product lines accounted for 66 percent of second-quarter revenue by the company’s own count.
The three numbers the backlog rests on
Three figures define the order position, all reported by the company for the second quarter of 2026 and carried in Korean press coverage dated July 30, 2026. New orders in the quarter came to 3.1 trillion won. New orders for the first half came to 5.8 trillion won against a full-year goal of 13 trillion won, which is 44.62 percent of the way there at the midpoint (my calculation). And the standing backlog at the end of June was 59 trillion won.
I want to be exact about what I am not claiming. A backlog is work a customer has committed to buy, priced at award. It is not revenue, it is not profit, and its conversion schedule is not published in a form I could read. Automotive programs run for years, volumes flex with the model cycle, and pricing gets renegotiated. Six years of booked work is a real fact about the order position and a very weak fact about any particular year’s earnings.
What the backlog actually is, and what it is not
The reason I still think the figure is worth putting in a journal entry is the scale contrast. A company carrying twenty-five times its own market value in committed work is telling me that the market’s doubt is about conversion and margin, not about demand. That framing is testable in a way that vague pessimism is not.
Margins are where the six years get decided
For 2025 the company reported revenue of 9,454.8 billion won and operating profit of 357.1 billion won, an operating margin of 3.78 percent (my calculation). The first half of 2026 ran at 4.17 percent, and the second quarter alone at 4.29 percent. These are thin margins by any measure, which is ordinary for a tier-one supplier and also the reason the backlog cannot be read as a store of value. Six years of revenue at four percent is a different proposition from six years of revenue at ten.
HL Mando stock and the one year the forward multiple pays for
Both multiples reproduce from the same close
Here is where the price sits. The screen I used reports trailing earnings per share of 2,130.40 won and a trailing multiple of 23.35 times. The same screen reports a consensus forward estimate of 4,290 won per share and a forward multiple of 11.60 times, drawn from 23 contributing houses with an average rating of 3.96 on a five-point scale. Both figures are quoted against the same September 11, 2026 close, and both reproduce: 49,750 divided by 2,130.40 gives 23.35, and 4,290 multiplied by 11.60 gives 49,764, which is the close within rounding.
Run the forward estimate back through the 46.96 million shares in issue and the implied full-year profit is 201.4 billion won (my calculation). That is what the market is currently paying 11.60 times for. Against a 59 trillion won order position, the price is being set by one year of expected profit while the book stretches out six.
Why I do not treat that as a bargain claim
A forward multiple always prices one year. That is what forward multiples do, and it would be silly of me to present a standard feature of the arithmetic as a discovery. What I take from the comparison is narrower: the gap between the order position and the earnings the market is currently paying for is large enough that almost all of the investment question lives in conversion, not in whether the work exists. When I next open this company, the first thing I will check is whether backlog growth and revenue growth have started to travel together.
The half year that landed almost exactly where one broker put it
One coincidence made me stop and check my own annualization. Hana Securities analyst Song Sun-jae, in a note reported by Korean press on Wednesday, July 15, 2026, set out a 2026 revenue estimate of 9,613.0 billion won and an operating profit estimate of 401.0 billion won. My own annualization of the reported first half produced 9,613.8 billion won. The two land 0.8 billion won apart, which on a figure of that size is a rounding difference.
I do not read that as confirmation of anything about the company. Doubling a reported half year is the crudest possible forecast, and the fact that a professional estimate happens to sit on the same number tells me the house is also modeling a flat second half, not that either of us is right. What it does give me is confidence that I read the half-year revenue correctly, which was the thing I actually wanted to verify.
HL Mando stock, region by region, for a single quarter
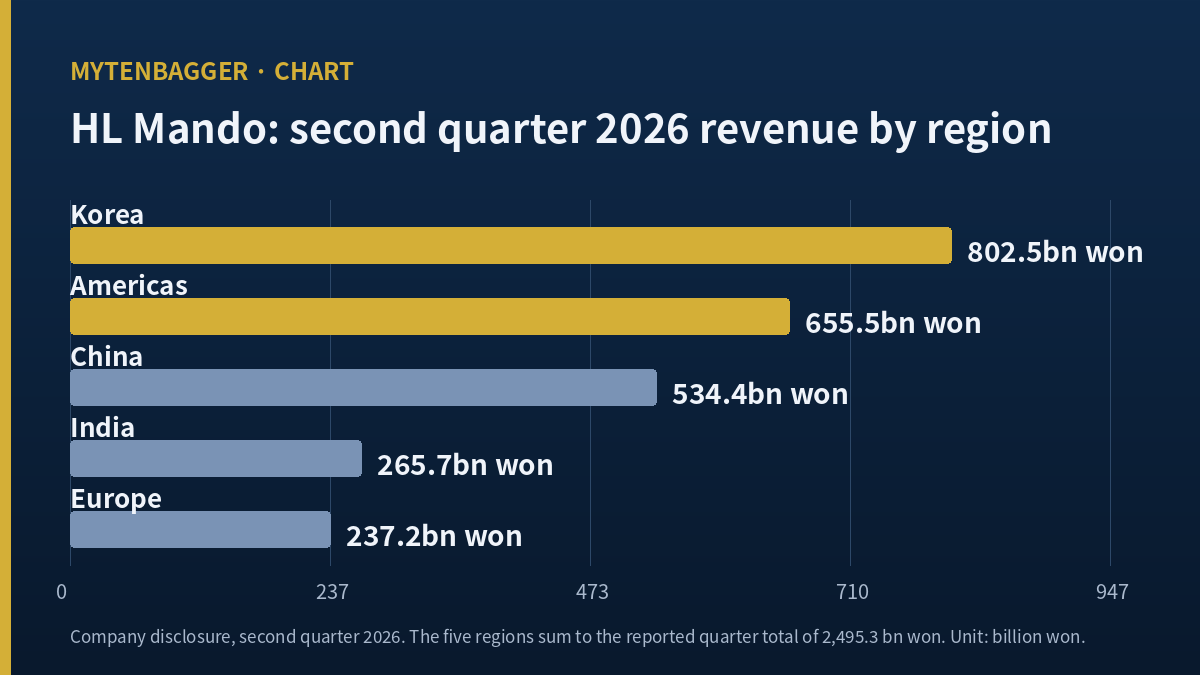
The company disclosed second-quarter revenue by region, and the five figures add to the reported quarter total exactly, which is the first thing I check before I use a breakdown for anything. Korea contributed 802.5 billion won, down 2.3 percent year on year. The Americas contributed 655.5 billion won, down 1.4 percent. China contributed 534.4 billion won, up 10 percent. India contributed 265.7 billion won, up 17.7 percent. Europe contributed 237.2 billion won, up 16.5 percent. The five sum to 2,495.3 billion won, the reported quarter.
The two regions that shrank are the two largest
Korea and the Americas together made 1,458.0 billion won, which is 58.43 percent of the quarter (both my calculation), and both declined. China, India and Europe grew at double-digit rates from a combined base of 1,037.3 billion won. I am not going to turn that into a story about a pivot, because the company does not publish profit by region and I refuse to describe a profit shift using revenue alone. What I can say is that the growth is real and that it is currently carried by the smaller half of the business.
The quarterly numbers themselves were unusual in one respect. Second-quarter revenue of 2,495.3 billion won was up 3.9 percent and operating profit of 107.0 billion won was up 2.8 percent, both modest. Net profit of 58.8 billion won was up 493.9 percent. For the half, revenue of 4,806.9 billion won was up 2.9 percent, operating profit of 200.6 billion won was up 9.4 percent, and net profit of 111.9 billion won was up 151.2 percent. Working backward, the first quarter carried 2,311.6 billion won of revenue, 93.6 billion won of operating profit and 53.1 billion won of net profit (all my calculation). The distance between the operating line and the bottom line moved a great deal and I could not resolve what drove it, so it stays out of my thesis and goes into the open questions below.
Where HL Mando stock trades against a US peer
For a global comparison I used BorgWarner (NYSE: BWA), a US drivetrain and propulsion supplier of broadly comparable position in the supply chain, quoted as of the same Friday, September 11, 2026. I did not build a table. I split the peer figures into two lists instead: the ones I was willing to put next to HL Mando’s, and the ones I deliberately left out with the reason attached. The second list is the more useful of the two.
Figures I compared, with both sides quoted on the same date:
- Trailing multiple. BorgWarner 34.00 times against HL Mando 23.35 times.
- Forward multiple. BorgWarner 12.23 times against HL Mando 11.60 times. The two forward figures are within one turn of each other while the trailing figures are more than ten turns apart.
- Profit margin. BorgWarner 2.89 percent on LTM revenue of $14.34 billion, which reproduces from a reported LTM net income of $415.00 million (my calculation). HL Mando’s 2025 group net margin was 1.30 percent on 9,454.8 billion won of revenue (my calculation).
- Beta. BorgWarner 1.10 against HL Mando 0.71.
- Scale. BorgWarner’s market value of $13.57 billion is 7.79 times HL Mando’s US$1.74 billion (my calculation).
Figures I left out, and why:
- Operating margin. BorgWarner’s screen shows 10.00 percent against HL Mando’s 3.78 percent, but the two are built under different accounting regimes and different definitions of what sits above the operating line. A gap that wide across regimes is more likely to be a definitional difference than a competitive one.
- Return on equity. Same reason, plus the question of whether the equity figure is period-end or averaged, which I could not settle on both sides.
- The gap between operating profit and net profit. BorgWarner earns a 10.00 percent operating margin and a 2.89 percent net margin, and I could not resolve HL Mando’s own equivalent gap. Comparing two unresolved things produces a sentence, not a finding.
- Book multiples. BorgWarner trades at 2.41 times its stated $27.60 per share of net assets.
- Dividend. BorgWarner pays $0.68 annually for a 1.03 percent yield. The Korean company’s yield reads differently on different screens for reasons that have nothing to do with the peer, so a straight comparison would have been misleading.
One arithmetic note on the peer that I could not close. BorgWarner’s stated market value of $13.57 billion does not reconcile with its quoted price of $66.31 and its 203.67 million shares, which multiply out to $13.51 billion, a difference of 0.48 percent (my calculation). Its stated earnings per share of $1.96 likewise does not reconcile with $415.00 million over that share count, which gives $2.04. Share counts on these screens are often basic where the earnings figure is diluted, and I left both discrepancies visible instead of picking whichever version made the comparison tidier.
I have taken a similar ranking approach to a Korean lighting supplier before, in a piece on SL Corp’s margin rank against its valuation rank, and I looked at how a Korean tire maker’s group and owner profit lines diverge in an entry on Hankook Tire.
Four figures published on HL Mando stock this summer
Four Korean houses published valuation figures for the company over seventeen days in July 2026, and the trajectory is worth recording because at least one of them runs the opposite way from its own earnings estimate.
| House | Figure published | Date reported | Note |
|---|---|---|---|
| Daishin Securities | 80,000 won | Tuesday, July 14, 2026 | Cut from 100,000 won, a 20 percent reduction |
| Hana Securities | 69,000 won | Wednesday, July 15, 2026 | Paired with a 401.0 billion won operating profit estimate |
| KB Securities | 77,000 won | Thursday, July 30, 2026 | Cut about 6.1 percent while raising the profit forecast 14.1 percent |
| NH Investment Securities | 64,000 won | Friday, July 31, 2026 | Lowest of the four |
One figure moved for a reason outside the company
The KB entry is the one I keep rereading. That house raised its annual operating profit forecast by 14.1 percent and lowered its published figure by roughly 6.1 percent in the same note, and the house gave a higher cost of capital as the reason, with market interest rates rising. The number moved down for a reason that has nothing to do with the company’s operations. I file that as a caution about reading these figures as verdicts on a business.
The consensus figure carried on the screen I used is 69,174 won, which is 39.04 percent above the September 11, 2026 close and 16.12 times the 4,290 won forward estimate (both my calculation). I quote these as market information. I do not adopt any of them, and I do not publish a figure of my own.
The plant that stands between the book and the earnings
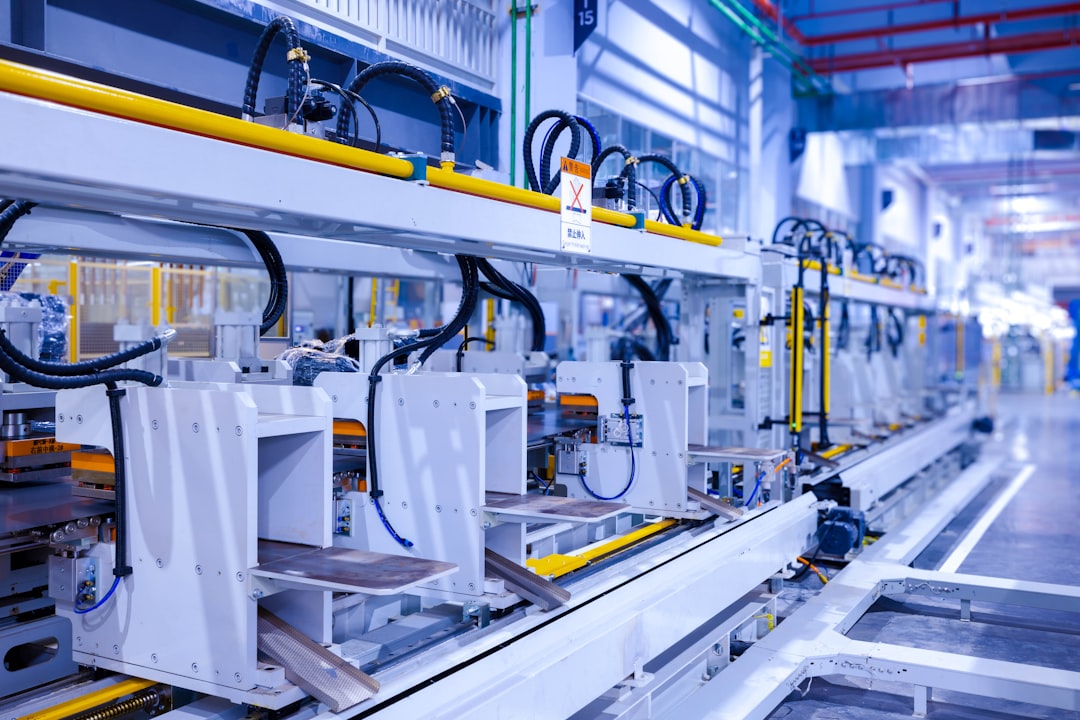
In July 2026 a subcontracted worker died at the company’s Pyeongtaek plant. Part of the plant’s production was suspended afterward, and Korean press reporting on Monday, August 31, 2026 described the stoppage as having run past a month, with the regional labor office declining to lift the work-suspension order. Reported points of dispute include allegations of unlawful dispatch arrangements and demands for criminal referral under Korea’s serious accidents legislation, alongside a labor ministry comprehensive inspection.
I could not find a published figure for lost units or lost revenue, so nothing about this enters my arithmetic. It enters my position instead. The whole content of my reading above is that six years of booked work has to convert into earnings, and a plant that cannot run is the most direct possible obstacle to conversion. A backlog is a promise about the future that depends entirely on the factory floor working in the present.
Nine questions about HL Mando stock I could not close
My usual practice is to write the other side as statements. This time I could not, because most of what stands against my reading is not a counter-argument but an unanswered question. So here they are as questions, with no answers attached.
- Over how many years does a 59 trillion won backlog convert, and does the company publish that schedule anywhere I have not looked?
- Is the backlog quoted at award pricing, and if so, how much of it has since been renegotiated?
- What drove net profit up 493.9 percent in a quarter when operating profit rose 2.8 percent?
- If that driver was non-recurring, does the 4,290 won forward estimate depend on it repeating?
- When were those 23 contributing estimates last refreshed, and how many predate the Pyeongtaek stoppage?
- How much revenue did the suspended lines carry before July 2026?
- Does the 44.62 percent order-intake progress at the half year imply a normal second-half weighting, or a shortfall against the 13 trillion won goal?
- Two of the four published figures were reductions from prior versions while at least one of the underlying profit forecasts was raised. What reconciles those two directions?
- If the market already knows everything in this entry, what exactly did I find? The order position is public, the multiples are on every screen, and the stoppage has been reported for weeks. The possibility that I have described the consensus back to myself is the strongest thing standing against this piece.
Where I stand on HL Mando stock and what would end it
I hold none of this and I have no order working. I am watching. Two things keep me out. The company sits outside the largest hundred names on the Korean market by value, which is my standing threshold for taking a position at all, and a plant of its own is currently stopped with no published figure for the damage.
What I do expect, and expect strongly, is that the conversion question gets answered on a schedule instead of staying open. That is the part of this I would want to be holding for, and it is why the company stays on my list instead of off it.
Sorting the exit conditions by whether the evidence gets published
I have started grading my own abandon conditions by a test that has nothing to do with the company: will the evidence that would overturn me actually be published? A condition that can never be checked is not a condition, it is a decoration.
- This one gets published. If third-quarter revenue comes in below the first-half quarterly average of 2,403.5 billion won (my calculation), then the flat-second-half assumption sitting inside both my annualization and the Hana estimate is wrong, and the 6.14-year figure has to be rebuilt on a lower run rate. Quarterly reports arrive on a fixed calendar, so this gets tested.
- This one gets published. If the full-year order intake finishes materially short of 13 trillion won, the backlog stops being a growing asset and starts being a drawdown. The company states its annual goal and reports against it, so this gets tested too.
- This one may never get published. The revenue lost to the Pyeongtaek suspension may simply never be disclosed as a separate figure. If it is not, then my decision to stay out over it will never be shown right or wrong. I would rather record that in advance than pretend the judgment was falsifiable.
Prices and multiples reflect the Friday, September 11, 2026 close as checked at the time of writing. Dollar conversions are approximate, at about 1,341.59 won per dollar on that same date, and the Korean won is the reference currency throughout. Quarterly and regional figures come from company disclosure carried in Korean press reporting dated July 30, 2026; market data and the consensus estimate from a Korean market data screen labeled to the same date; the Hana Securities estimate from Korean press coverage of that note; the Daishin figure from a Korean report brief; the plant suspension from Korean press reporting dated August 31, 2026; and the exchange rate from historical currency data. Where I write that a figure is my calculation, it means the source did not publish it and I derived it.
Related reading