NHN Stock Sits on Equity Smaller Than It Was Four Years Ago
For five consecutive balance sheet dates, the capital stock line at this Korean software and payments company has read 18.75 billion won. Not approximately. The same figure, from December 2022 through June 2026. In the same window the company retired 4,764,776 of its own shares in four separate cancellations, and that line did not move by a single won. I spent most of this session working out why, and what fell out of it was a reconciliation that also explains why NHN stock shows two different share counts on one quote screen. I hold no position in it.
  Owners equity, Dec 2022        1,693.0 bn won
  ___________________________________________
  Owners equity, Jun 2026        1,488.4 bn won
  ___________________________________________
  Change                            -12.09  %   (derived)
  ___________________________________________
  Liabilities, same window          +65.50  %   (derived)
  ___________________________________________
  Capital stock line, all dates      18.75 bn won  (unchanged)
  ___________________________________________
  Shares retired, four events     4,764,776      (sum, derived)
Contents
The capital stock line has not moved in five periods
Korean issuers report a capital stock figure that equals par value times shares issued. When a company cancels treasury shares out of retained earnings, the share count falls but the capital stock line does not, because the cancellation is charged against earnings and not against paid-in capital. That is the accounting. What I wanted to see was how far apart the two numbers had drifted here.
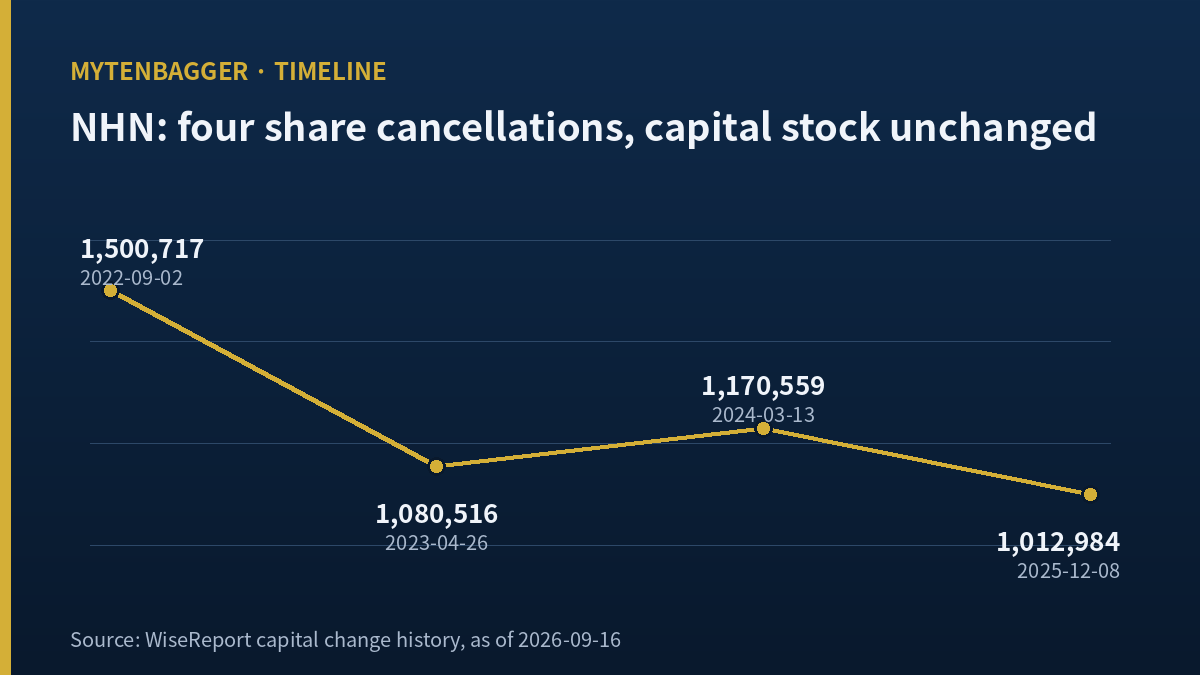
The corporate profile screen at WiseReport lists the capital change history. A bonus issue on January 24, 2022 added 17,952,890 shares and left capital stock at 18,758,958 thousand won. Four earnings-funded cancellations followed. I list them below because the arithmetic in the next section depends on all four.
The four cancellations, in order
- September 2, 2022: 1,500,717 shares
- April 26, 2023: 1,080,516 shares
- March 13, 2024: 1,170,559 shares
- December 8, 2025: 1,012,984 shares
Those four sum to 4,764,776 shares (my sum). Meanwhile the balance sheet from ValueLine shows capital stock of 18.75 billion won at December 2022, December 2023, December 2024, December 2025 and June 2026. Five dates, one figure, four cancellations in between. Divide 18,758,958 thousand won by the 500 won par value and you get 37,517,916 shares (derived). That is the share count the capital stock line still describes.
What NHN stock is paying 1.19 times for
Here is the equity side, in billions of won, from ValueLine. I dropped the minority interest column deliberately and say why further down.
| Period | Assets | Liabilities | Total equity | Owners equity | Debt ratio |
|---|---|---|---|---|---|
| Dec 2022 | 3,025.2 | 1,032.8 | 1,992.4 | 1,693.0 | 51.83% |
| Dec 2023 | 3,449.7 | 1,459.9 | 1,989.8 | 1,631.4 | 73.37% |
| Dec 2024 | 3,193.0 | 1,427.7 | 1,765.4 | 1,451.5 | 80.87% |
| Dec 2025 | 3,851.4 | 2,080.6 | 1,770.8 | 1,463.1 | 117.49% |
| Jun 2026 | 3,519.4 | 1,709.3 | 1,810.1 | 1,488.4 | 94.43% |
I checked the debt ratio column against the two figures beside it. Dividing liabilities by total equity gives 51.84, 73.37, 80.87 and 117.49 percent for the four December dates using the rounded figures in the table. Three match the published column to the second decimal; December 2022 comes out one hundredth of a point high, which is the rounding in the inputs and not a disagreement. The June 2026 figure of 94.43 percent is my own division, because that period is not published with a ratio.
I also checked whether assets minus liabilities equals total equity at each date. Four of the five close exactly at the precision the table carries. December 2024 comes out one tenth of a billion won short.
Now the part that matters. Owners equity was 1,693.0 billion won at December 2022 and 1,488.4 billion won at June 2026. That is a fall of 12.09 percent over three and a half years (derived). Liabilities over the same window went from 1,032.8 to 1,709.3 billion won, a rise of 65.50 percent (derived). Assets grew 16.34 percent (derived), so the growth in the asset base was financed on the liability side while the owners side shrank.
Against that, the quote screen prints a price-to-equity multiple of 1.19 and a per-share equity figure of 47,466 won. The two are internally consistent: 56,400 divided by 47,466 is 1.1882. What I could not do is reproduce 47,466 from the balance sheet. Owners equity at December 2025 divided by either share count on the screen gives roughly 45,300 or 44,700 won, and the June 2026 figure gives about 46,000. None of those is 47,466. I do not know what the screen divided, so I kept its 1.19 as the screen’s number and computed my own separately: market value over June 2026 owners equity is 1.2250 (derived, using the smaller share count).
Two speeds inside one screen
Two speeds. That is what I found on a second data source I opened to cross-check the first, and it is the thing from this session I most want to remember. The AlphaSquare page for this company prints a current price that matches the September 11, 2026 close exactly, and beside it a price-to-earnings figure of 30.51 and a price-to-equity figure of 0.61. Run those backward against the earnings and equity per share the same page shows, and the multiples resolve to a share price near the bottom of this year’s trading range. They do not resolve to the price printed at the top of the same page.
So the price field was current and the multiple fields were stale, on one page, with no marking to say so. I have been treating a quote page as a single object that is either fresh or not. It is not. It is a set of fields that update on different clocks, and the fast field sits directly above the slow ones, which is the arrangement most likely to fool me. From now on I reconcile every multiple against the price on the same page before I use either. It took me two derivations to notice, and I only ran them because a different screen disagreed.
Where the 424,175 share gap comes from
The WiseReport screen lists shares outstanding of 32,328,965. It also lists a market value of 1,847.3 billion won. Those two do not go together. Multiply the September 11, 2026 close by that share count and you get 1,823.4 billion won (derived), which is 23.9 billion won, or 1.31 percent, below the market value the same screen reports.
The reconciliation runs through the capital stock line. Take the 37,517,916 shares implied by capital stock at 500 won par. Subtract the four cancellations totaling 4,764,776. You are left with 32,753,140 shares. Multiply that by the close and you get 1,847,277,096,000 won, which rounds to the 1,847.3 billion won the screen prints. The market value field is built on the share count after those four cancellations. The shares outstanding field is built on something 424,175 shares smaller.
What that residual 424,175 is, I could not establish. A fifth cancellation after the December 2025 event and not yet reflected in the capital change table would do it. So would a treasury holding netted out of one field and not the other. I looked for a treasury share count and did not find one on any page I opened. What I can say is that the gap is not noise and not rounding: it reconciles to the last won through a chain of five disclosed events, and whatever sits at the end of that chain is a real corporate action I have not identified.
The practical consequence is small but not zero. Anyone reading market value off that screen is reading a figure 1.31 percent higher than price times the share count printed two lines above it. I used the smaller figure throughout this note and flagged where I did. A company that reports two multiples on one screen was the subject of an earlier note on NCSoft; there the split was between two earnings bases, and here it is between two share counts.

NHN stock against a US AI infrastructure name
I wanted a US-listed company that the market is valuing on datacenter capacity it has not yet monetized, because that is the part of this Korean company the sell-side is now writing about. Applied Digital Corporation, listed on the Nasdaq under APLD, fits that description and closed on the same session, September 11, 2026. What I could not get was an equity figure for it, which means the comparison I actually wanted to run, price against net assets on both sides, was unavailable. So I ran the ones I could and I am not presenting a table, because a table implies the rows are commensurate and two of them are missing on one side.
Alternating one line each, the Korean company first:
- Market value: 1,823.4 billion won, which converts to about 1,359.1 million dollars (derived)
- Market value: 7,700 million dollars
- Trailing earnings multiple: printed, and positive
- Trailing earnings multiple: not available, because trailing earnings are negative
- Trailing net income: positive, and the reason the multiple exists
- Trailing net income: negative 250.26 million dollars
- Owners equity: 1,488.4 billion won, about 1,109.4 million dollars (derived)
- Owners equity: I could not obtain it
- Shares: two counts on one screen, 424,175 apart
- Shares: 291.47 million, and 26.42 dollars times that count returns 7,700.6 million dollars, which is the reported market value at its stated rounding
The single comparison that survives intact is scale against value. The US company carries about 5.67 times the market value of the Korean one (derived) on revenue roughly a third the size (derived from the Korean company’s 2025 full year against the US company’s trailing twelve months, which are different measurement windows, so read the ratio as indicative). I am not claiming that is wrong. Capacity businesses get valued on what the capacity will earn, and the US company has more capacity coming. I am noting that the Korean company arrives at its current valuation with positive net income and a measurable equity base, and the comparison company arrives at a much larger one with neither. If the market is applying the same logic to both, it is applying it far more gently here.
Figures I left out of the NHN stock note
The minority interest column, and why dropping it cost me something
ValueLine reports total equity and owners equity separately, so the residual is available at all five dates and it is not small. I left the column out of the table above and out of the argument. The honest reason is that I decided this note would be about the direction of the owners line and the capital stock line, and adding a third equity line would have split the reader’s attention across two stories. The cost is real: total equity at June 2026 is higher than at December 2024 while owners equity is lower, and the difference between those two directions lives entirely in the column I removed. Someone working from my table alone cannot see that.
Dividend figures that came in two versions
Two screens gave two dividend yield figures for the same closing price, and they differ by roughly a factor of two. I could not find the underlying per-share dividend on a primary filing during this session, because the search kept returning a similarly named listed affiliate’s dividend resolutions instead. With two unreconciled versions and no primary source, I used neither, and the note contains no dividend analysis as a result.
Thirteen ways this NHN stock reading weakens, strongest first
I ordered these by how much each one damages the argument above, from most to least. The ordering is mine and it is a judgment call, which is itself the last item.
- I could not reproduce the per-share equity figure the screen prints from any combination of reported equity and reported share count. My entire valuation discussion rests on a number whose construction I do not know.
- The 424,175 share residual reconciles arithmetically but I never identified the corporate action behind it. An unexplained figure that closes to the last won is still unexplained.
- A falling owners equity line is not automatically bad. Canceling shares out of retained earnings reduces equity on purpose, and 4,764,776 shares of cancellation is a deliberate return of capital. No loss produced that portion of it.
- Following from that, part of the 12.09 percent decline I highlighted is the company doing exactly what shareholders asked for. I did not separate the deliberate portion from the involuntary one, and I do not have the equity movement statement that would let me.
- Liabilities rising 65.51 percent while assets rise 16.34 percent reads badly in isolation, but a company building datacenter capacity borrows to build it. Leverage taken on for capacity is a different fact from leverage taken on to cover losses, and I cannot tell them apart from these five rows.
- The June 2026 debt ratio of 94.43 percent is my own division and is not a published figure. If the vendor computes its ratio on a different equity base than I did, my number will not match theirs when they publish it.
- One of the five periods fails the assets-minus-liabilities identity by a tenth of a billion won. I called it rounding. I did not verify that against a filing.
- The capital stock line staying flat through four cancellations is how Korean accounting handles this, and no anomaly is involved. Readers unfamiliar with it may take my framing as a discovery when it is a convention.
- The comparison company has no available equity figure, so the one comparison I ran across both is scale against value, which is the crudest of the ones I wanted.
- Everything on the balance sheet is reported as of June 30, 2026. Two and a half months of activity sit between that date and the price I compared it against.
- The par value of 500 won is my inference from dividing capital stock by an implied share count. I did not read it off a filing. If par value is different, the 37,517,916 share figure and everything downstream of it moves.
- Foreign ownership at 13.19 percent came from one screen and I did not cross-check it, and a second source I opened gave a slightly different figure for the same field.
- The ordering of this list is my own judgment about which objection hurts most. Someone who thinks the unexplained share residual matters more than the unreproducible equity per share would put item two first, and I would not be able to argue them out of it.

My position and what would end it
I own none of this and I have no order working. The company sits outside the top hundred Korean issuers by market value, which is where my default sits, and nothing in the balance sheet moved me off it. What I found interesting was narrower than a position: a set of screens that disagree with each other in ways that reconcile, and a capital account that tells a different story from the share count sitting next to it.
My stance in one line: when the equity figure a valuation multiple divides by cannot be reproduced from any reported equity and any reported share count, I do not size a position on that multiple, however reasonable the multiple looks.
In earlier notes I asked what would prove me wrong, who would know first, and how long it would take. This time the question is one step further in. If the evidence that overturns this appeared, would I actually be somewhere I could see it?
- Yes. A fifth cancellation disclosure, or a treasury share count in the next quarterly report, closes the 424,175 residual. Both are filings I check as a matter of course, and both would arrive on a predictable schedule.
- Probably not. The vendor could quietly correct its per-share equity figure, or its market value field, at any time. Vendors do not announce reconciliations. The screen would simply agree with itself one day and I would only notice if I happened to re-run the same divisions.
- No. The split between voluntary and involuntary equity decline lives in the consolidated statement of changes in equity, and the treasury position lives in the notes. I did not open either during this session, and the honest answer is that I usually do not. The objection that would most damage this note sits in a document I skip far more often than I open.
Prices and multiples here reflect the September 11, 2026 close as checked at the time of writing. Dollar figures here are approximate, at about 1,341.59 won per dollar on that same date, and the Korean won is the base currency throughout. Balance sheet figures are as reported at each period end.
Related reading: note on NAVER
Sources: WiseReport company overview · WiseReport capital change history · ValueLine balance sheet · AlphaSquare quote page · Applied Digital summary · USD/KRW historical closes