Seegene Stock Returned More Cash Than It Earned in Profit
When a company pairs a 95.5 percent dividend ratio with a 173.7 billion won share retirement, I look at its borrowings first. Companies that hand cash to owners using somebody else’s money usually go quiet the following year. So before I opened anything else on Seegene stock, I pulled the balance sheet.
Seegene, code 096530, makes in-vitro diagnostic reagents that screen for several pathogens in a single run, plus the instruments that process them. At the end of June 2026 total liabilities were 226.658 billion won against total equity of 1,039.427 billion won, a ratio of 21.81 percent. That is not the balance sheet of a company funding returns with debt, and there was no large asset sale either. With nothing left to suspect there, I moved to the income statement, and what I found there was stranger.
Add up every won of operating profit this company booked from January 2023 through June 2026 and you get 33.15 billion won, roughly 24.63 million dollars. Add up the three shareholder returns confirmed over the same stretch and you get 233.5 billion won, about 173.49 million dollars. If the money came from neither debt nor disposals, where did the gap come from? That one question is the whole article.
Three receipts, and the two lines I put underneath them
| FY2025 cash dividends, 1,000 won per share for the year | 46.1 bn won |
| August 31, 2026 retirement of 5,491,592 treasury shares | 173.7 bn won |
| Second-quarter 2026 dividend, 300 won per share | 13.7 bn won |
| Total | 233.5 bn won |
| Operating profit across the same fourteen quarters | 33.15 bn won |
| Free cash flow across the same fourteen quarters | 262.825 bn won |
The total line is my own addition of three amounts the company disclosed and the Korean press printed. The two lines below it are my own addition of four reporting periods from the consolidated filings. Not one of the six lines appears on a data screen in that form.
Contents
Seegene stock sits on fourteen quarters of 33.15 billion won
Here are the years. All figures are from the consolidated filings, in billions of won.
| Period | Revenue | Operating profit | Operating cash flow | Closing inventory |
|---|---|---|---|---|
| FY2022 | 853.561 | 196.492 | 319.008 | 158.195 |
| FY2023 | 367.375 | -30.054 | 94.932 | 137.636 |
| FY2024 | 414.251 | -16.480 | 85.390 | 109.369 |
| FY2025 | 474.231 | 34.549 | 149.333 | 82.201 |
| First half 2026 | 265.098 | 45.135 | 75.968 | 75.497 |
FY2023 and FY2024 were operating losses, 46.534 billion won between them. FY2025 turned positive at 34.549 billion won and the first half of 2026 alone brought 45.135 billion won. Put those four periods in one bucket and the operating profit sums to 33.15 billion won. The eighteen months that followed earned 79.684 billion won, and the two loss years consumed 58.40 percent of it.
Now the cash statement for the same four periods. Operating cash flow sums to 405.623 billion won. Capital expenditure sums to 142.798 billion won. What remains is 262.825 billion won of free cash. The income statement says 33.15 billion won over this window; the cash statement says 262.825 billion won. The ratio between the two is 7.93 times.
Inventory has not risen since the end of 2022
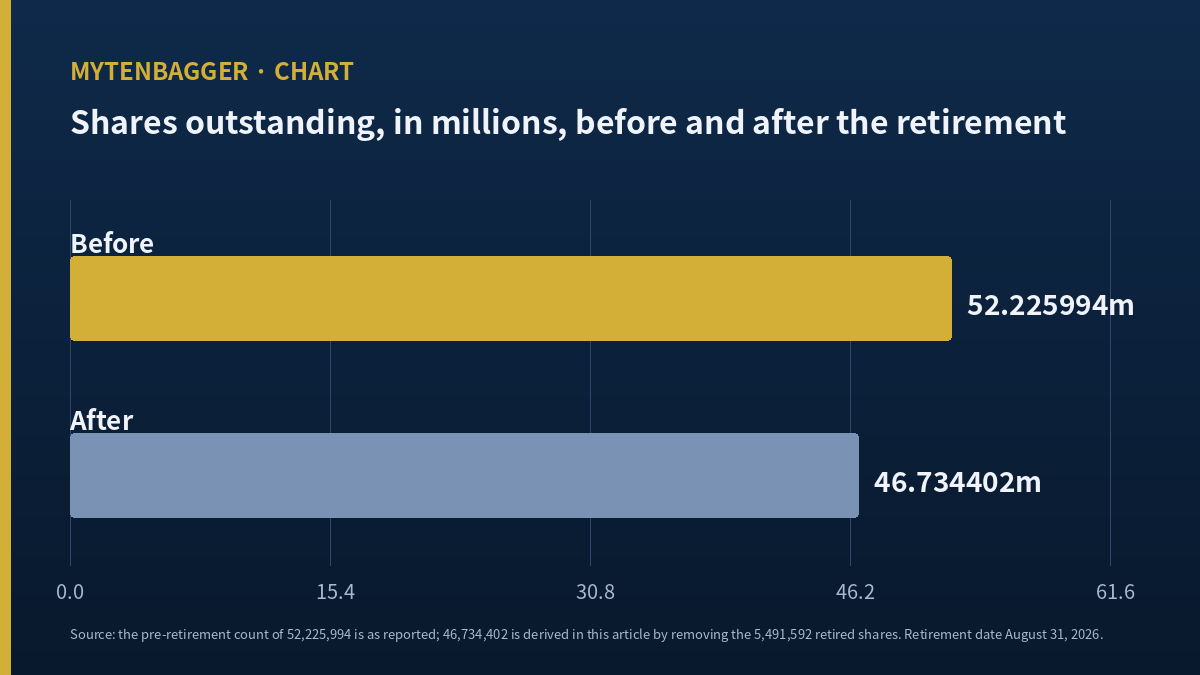
The last column of that table is the answer. Inventory went from 158.195 billion won at the end of 2022 to 75.497 billion won at the end of June 2026, a fall of 82.698 billion won. Across five closing balances it moved down four consecutive times and never once moved up.
While inventory falls, a company is selling goods it already built. Cash coming in from sales exceeds cash going out to build replacements, and the difference lands in operating cash flow. That is why a loss year can still show positive cash. FY2023 paired an operating loss of 30.054 billion won with 94.932 billion won of operating cash; FY2024 paired a 16.480 billion won loss with 85.390 billion won.
Taking only the three full years from FY2023 through FY2025, inventory fell 75.994 billion won while operating cash flow summed to 329.655 billion won. The inventory contribution is 23.05 percent. The remaining 76.95 percent came from non-cash charges such as depreciation and from other working-capital lines, and the face of the filed statements does not let me split that remainder open. So 23.05 percent is as far as I will argue.
Direction is what matters here. Cash made by drawing inventory down stops when inventory reaches its floor. The June 2026 balance of 75.497 billion won is 47.72 percent of the end-2022 level, and inventory days measured against single-quarter revenue fell from 130.8 in the first quarter of 2024 to 50.5 in the second quarter of 2026. There does not look to be much room left.
Seegene stock closed 86 won below the price the company paid
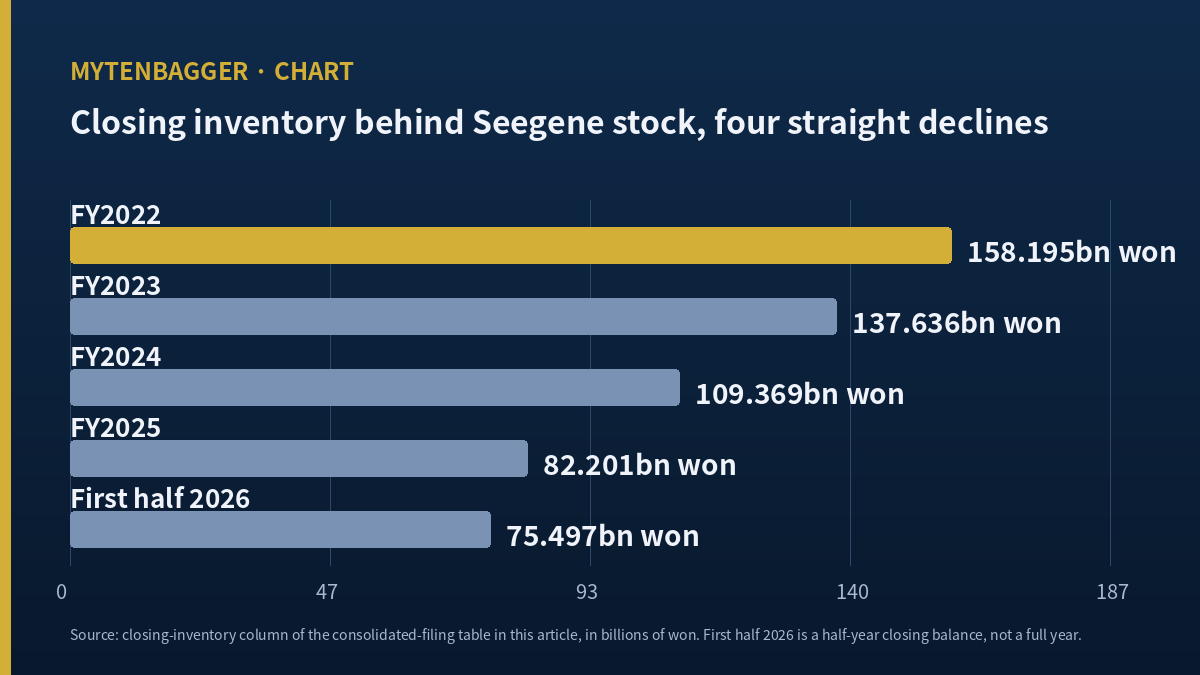
Korean press reporting on August 12, 2026 carried the retirement details: 5,491,592 treasury shares, about 173.7 billion won, retirement date Monday August 31, 2026, shares outstanding before the retirement of 52,225,994, and 10.5 percent of issued stock. The average acquisition cost was printed as 31,636 won.
I divided the two reported numbers myself. 173,700,000,000 won over 5,491,592 shares is 31,630.17 won per share, which sits 0.018 percent from the reported 31,636 won average. The 173.7 billion won figure is rounded, and the two numbers describe the same transaction. So far they interlock.
The next part is where I stopped. The Friday September 11, 2026 close was 31,550 won, about 23.44 dollars. That is 86 won below the 31,636 won average the company paid for the shares it then cancelled, a gap of 0.2718 percent. A retirement raises the per-share claim of everyone left, and yet the stock being cancelled was accumulated above where the market prices it now. I will not call that a failure. Treasury purchases accumulate over many months and the average of that window has no reason to equal any single day’s close. But the answer to “at what price band did this company buy its own stock” is sitting on the screen right now as 86 won, and I am writing it down.
Two share counts, 939 apart
Take the reported pre-retirement count of 52,225,994 and remove the 5,491,592 retired shares and 46,734,402 is left. I did that arithmetic myself; no source printed the result. The share count on the data screen is 46,735,341, which is 939 higher, a difference of 0.0020 percent that changes no calculation in this article.
I am keeping both numbers instead of resolving them, because I did not open the filing itself to read the post-retirement share count line. Market capitalization lands on the screen figure: 31,550 won times 46,735,341 shares is 1,474.5 billion won, matching the printed market capitalization to the hundred million won. So every per-share figure in this article uses the screen count.
Two multiples for Seegene stock, 34.13 and 18.39
The screen prints a price-to-earnings multiple of 34.13 and labels the basis as the trailing four quarters. Yet the same screen’s revenue of 474.2 billion won, operating profit of 34.6 billion won, and net income of 48.4 billion won match the FY2025 annual statements of 474.231, 34.549, and 48.445 billion won to the million. The label says four trailing quarters; the contents are one calendar year.
Rebuilding the actual trailing four quarters, from the third quarter of 2025 through the second quarter of 2026, owner net income by discrete quarter comes to 14.560 plus 4.938 plus 34.731 plus 25.937, or 80.166 billion won. Over 46,735,341 shares that is 1,715.32 won per share, and 31,550 won over that figure is 18.39. Slightly more than half of the printed 34.13.
On FY2025 owner net income of 48.274 billion won the same division gives 1,032.92 won per share and a multiple of 30.54. Three different answers. I am not picking one for the body of this article; I am recording which period produces which value. Book value per share I dropped entirely. The printed 22,020 won agrees neither with 21,727.60 won computed on end-2025 owner equity nor with 22,231.03 won computed on end-June 2026 owner equity, and I could not establish which balance date it uses.
One screen, two dividend ratios, and a disclosed figure that is neither
The same screen prints two dividend ratios, 108.2 percent and 58.5 percent. The first is the 1,000 won annual dividend over the screen’s 924.41 won earnings per share, which works out to 108.18 percent; that earnings figure is itself the close divided by the 34.13 multiple, so it references itself. The second, 58.5 percent, comes close to the 58.30 percent I get dividing 1,000 won by the 1,715.32 won trailing figure I rebuilt above.
Meanwhile Korean reporting on June 1, 2026 put FY2025 cash dividends at 46.1 billion won and the dividend ratio at 95.5 percent. Dividing 46.1 billion won by FY2025 owner net income of 48.274 billion won gives 95.4965 percent, which agrees to the first decimal. The disclosed ratio is 95.5 percent, and neither 108.2 nor 58.5 is that number.
I had planned to build this piece around those three ratios and then dropped the idea. Four of the company records I read and wrote in the past few days all took the form of two figures on one screen that do not agree with each other, and a fifth built the same way would read as a repeat of the previous four. So the material sits in this one section and the spine moved to the time series. Writing down the decision and the reason for it is the honest way to handle it.
One Korean broker raised its Seegene stock number twice in three months
Four Korean sell-side notes turned up, two of them carrying an analyst name. I read all four through Korean secondary coverage and opened none of the originals, and I am saying so before the table.
| Date | House and analyst | Valuation | Estimates carried with it |
|---|---|---|---|
| May 11, 2026 | Mirae Asset Securities, Kim Chung-hyun | 44,000 won | FY2026 revenue 517.8 bn won, operating profit 75.5 bn won, margin 14.6 percent |
| May 11, 2026 | Daol Investment and Securities | 39,000 won | Described the company as the best shareholder returner in its sector |
| July 13, 2026 | Daol Investment and Securities | 45,000 won | FY2026 revenue 545.5 bn won, operating profit 82.5 bn won, dividend yield 4.1 percent |
| August 10, 2026 | Daol Investment and Securities, Park Jong-hyun | 47,000 won | Third-quarter revenue 133.1 bn won, operating profit 18.4 bn won |
The two houses disagree on FY2026. Revenue of 517.8 against 545.5 billion won; operating profit of 75.5 against 82.5 billion won. The profit gap is 7.0 billion won, or 9.27 percent measured against the Mirae Asset figure. I am not averaging them. The spread itself tells you how wide the estimate range is for this company’s earnings.
One timing point bothers me. All four notes predate the August 31, 2026 retirement. The August 10 note came twenty-one days before it and said in the body that a retirement equal to about ten percent of issued stock was still outstanding. So these per-share numbers were struck while the share count was 10.5 percent larger. Holding earnings estimates constant, fewer shares lift per-share earnings; that direction is arithmetic. Whether each house had already built the retirement into its work I cannot judge, because I did not open the originals.
I recounted the 250-day range behind Seegene stock myself
The screen prints a 250-session high of 35,750 won and a low of 21,700 won, and labels the basis as adjusted closing prices over 250 sessions. I counted the 250 daily bars directly. The window runs from September 3, 2025 to September 11, 2026.
On closing prices the high is 35,650 won, set Friday August 28, 2026, and the low is 21,850 won, set Tuesday March 31, 2026. The screen’s 35,750 won is the intraday high of that same August 28 session, and its 21,700 won is the intraday low of Monday March 9, 2026. The basis field says closing prices and both printed values are intraday. I have now seen this mismatch in seven consecutive companies.
Recounted on closing prices, the September 11 close of 31,550 won sits 11.5007 percent below the high and 44.3936 percent above the low. The screen’s versions are 11.7483 percent and 45.3917 percent. Same direction, different digits.
I dropped the change-rate fields from this article entirely. The screen’s current price of 31,550 won is the September 11 close, while the same screen’s trend block gives a latest date of September 14, 2026 and a price of 31,650 won. The daily bar I pulled for September 14, 2026 carries volume of 74,237 shares and an empty market field, which makes it an intraday row from a session in progress. One-month, three-month, and twelve-month change figures drawn off a screen holding a non-closing value are figures whose as-of date I cannot explain.
My stance on Seegene stock and the five places it breaks
Not held, no order placed, observation only. Market capitalization of 1,474.5 billion won, about 1.096 billion dollars, puts this outside Korea’s hundred largest listings, and that band is where my default is to keep a record instead of a position.
One condition keeps the observation alive. The third-quarter 2026 report shows inventory below 75.497 billion won while operating cash flow holds the pace set by the 75.968 billion won half-year figure. That would shift weight toward recovered operations and away from the reading that inventory was burned. One condition closes it: inventory rises while operating cash flow drops below operating profit. Then the 17.03 percent first-half operating margin needs to be examined for how much of it came from inventory valuation instead of sales.
Now the other side, strongest first. Each item ends with which line of my arithmetic it erases.
First, and this is the one I want readers to weigh most. Paying out more than earnings is not unusual in this sector, and the clearest evidence against me is a global peer, and I am putting it here as an objection instead of as support. QIAGEN, a Netherlands-domiciled molecular diagnostics maker listed in New York, prints a dividend-to-earnings ratio of 134.23 percent on a 42.13 dollar price as of September 12, 2026, with an annual dividend of 2.76 dollars against earnings per share of 1.97 dollars; dividing those two myself gives 140.10 percent, and I record both the printed 134.23 and my own 140.10 because the difference comes from which earnings figure is used. Its operating margin is 26.19 percent on trailing revenue of 2.10 billion dollars, against 7.29 percent for this company in FY2025. So a company can earn real margins and still distribute above earnings. What that erases is not the 7.04 multiple but the interpretation I attached to it.
Second. The first-half 2026 operating margin of 17.03 percent is more than double the FY2025 figure of 7.29 percent, and the second quarter alone ran 15.88 percent. If operations have already entered a different regime, then a four-period sum that includes the FY2023 and FY2024 losses is anchored in stale periods. The line that erases is the 33.15 billion won, and the 7.04 multiple comes down with it.
Third. A treasury share retirement is a capital transaction and never passes through the income statement. Placing 173.7 billion won in the same column as 46.1 and 13.7 billion won of dividends adds items of different character. The line that erases is the 233.5 billion won total. Dividends alone are 59.8 billion won, which is still 1.80 times the 33.15 billion won of operating profit across those fourteen quarters.
Fourth. The June 1, 2026 Korean report flagged a long-term software commitment of 19.8 billion won of which only 1.98 billion won, ten percent, had been drawn by the end of 2025, with payment obligations attaching to the undrawn balance. The same report raised related-party purchases up by 9.248 billion won, a prior-period restatement, and fees and commissions up 40 percent. Cash has places to go. No line erases, but the durability of that 262.825 billion won of free cash weakens.
Fifth. The 46.1 billion won FY2025 dividend total is a press figure and I never opened the filing’s dividend total line. I trusted it because the 95.5 percent ratio came back out of my own division. If that number is wrong, the first of my three receipts changes.
I will not hide what I think. I take the 17.03 percent first-half operating margin seriously. A company that cleared two loss years, then booked 45.135 billion won in six months while shedding 82.698 billion won of inventory, starts its next cycle carrying less weight. I still have not bought it. The second and third objections above can both be true at once, and if they are, the gap I built this article on halves.
Here is what I will recompute when the next filing lands, written down in advance. Every figure in this article is built on a four-period sum, and the third-quarter report turns that into five periods. If inventory has risen above 75.497 billion won, the 23.05 percent inventory contribution is unusable from that day. I will not delete the paragraph; I will widen the summed window from four periods to five and run the same division again. Where the operating profit total goes from 33.15 billion won is set by third-quarter standalone operating profit, and if that lands near the 18.4 billion won Daol estimate the total becomes roughly 51.5 billion won and the 7.04 multiple falls toward 4.5. The free cash side depends on capital expenditure, so I cannot call its direction now.
The statutory deadline falls on Sunday November 15, 2026, which puts actual filing on Monday November 16, 2026. The first line I will open that day is neither revenue nor operating profit. It is the inventory balance.
Related reading: Alteogen record on a two percent royalty, Lunit record on cash burned against cumulative revenue booked
Sources and as-of dates. Price, market capitalization, share count, the price-to-earnings multiple, and the two dividend ratios are screen values from a Kiwoom-sourced indicator service, as of the Friday September 11, 2026 close. Revenue, operating profit, net income, equity, liabilities, operating cash flow, capital expenditure, inventory, and interest expense are from the consolidated statutory filings, receipt numbers 20260814002284 for the first-half 2026 report and 20260319000422 for the FY2025 annual report. The 250 daily bars come from the same indicator service. Retired share count, amount, average acquisition cost, and the 300 won quarterly dividend totaling 13.7 billion won are from TheBioNews, August 12, 2026, translated by me from the Korean. The FY2025 dividend total of 46.1 billion won, the 95.5 percent ratio, and the fourth objection above are from Newsspace, June 1, 2026, also my own translation. Second-quarter 2026 results are from Herald Business, August 7, 2026. The August 10 Daol note is reported by Money Today, the May 11 Mirae Asset note by Newspim, and the July 13 Daol note by MedicoPharma; all three are Korean sell-side notes reaching me through Korean secondary coverage, not originals. QIAGEN figures are from stockanalysis.com as of September 12, 2026. Won amounts are converted at 1,345.9 KRW per USD, the Seoul foreign exchange market daytime closing rate on 2026-09-11, up 6.7 won on the prior session, as reported by Financial News. Figures I derived myself, none of them read off a page: post-retirement shares outstanding of 46,734,402, the 31,630.17 won per share from dividing 173.7 billion won by 5,491,592 shares, trailing four-quarter earnings per share of 1,715.32 won and its 18.39 multiple, FY2025 earnings per share of 1,032.92 won and its 30.54 multiple, three versions of book value per share, and the QIAGEN 140.10 percent.