JB Financial Stock: What One Won of Assets Earns Here
Return on equity is return on assets multiplied by an equity multiplier. The sentence is arithmetic and it holds for every listed lender on earth. I keep forgetting how much work that identity can do until I put two banks side by side and watch the two halves pull in opposite directions. JB Financial stock gave me that chance this week, because I finally found a foreign lender built along the same lines.
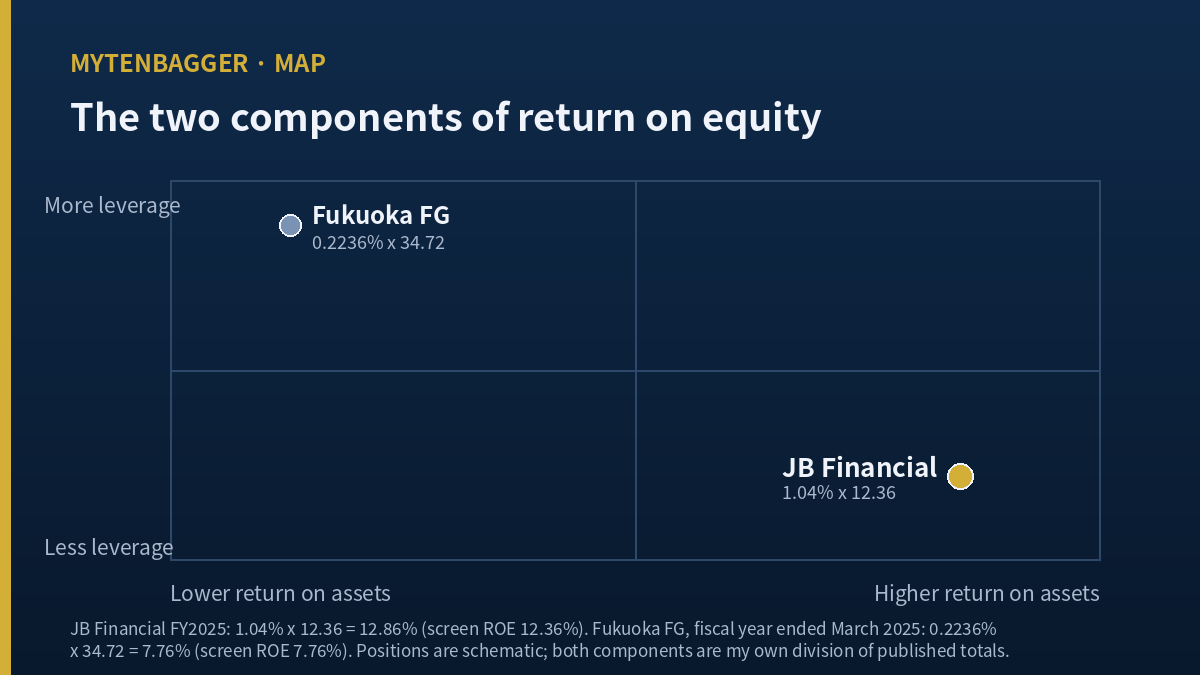
Fukuoka FG 0.22% x 34.72 = 7.76% (screen: 7.76%)
assets earn gives JB 4.65 times higher
leverage stacked gives Fukuoka 2.81 times higher
earnings multiple gives Fukuoka 2.01 times higher
Contents
What JB Financial stock costs against what this bank earns
JB Financial Group trades on the Korea Exchange under 175330. KOSPI is the senior of Korea’s two boards, the one that carries Samsung Electronics and the large financial holding companies, and this name sits in the lower half of it by size. Market capitalization is about US$4.38 billion by my calculation, converted from the won figure on the screen.
The bank holding company runs two provincial banks in Korea’s southwest, Jeonbuk Bank and Kwangju Bank, plus a consumer finance arm. On a full-year 2025 basis the group produced operating revenue of 4,630.5 billion won and net income of 730.0 billion won, of which 710.4 billion won belonged to controlling shareholders. Four years earlier those first two lines read 3,195.3 billion won and 618.3 billion won.
The earnings multiple on the September 10, 2026 close is 8.53 times, against earnings per share of 3,688 won. Hold that number for a moment.
The identity behind every return on equity figure
I want to be careful about what I am claiming here, so I will state the mechanics plainly. Return on equity can be split into two pieces: what the assets themselves earn, and how many won of assets the bank carries for each won of its own capital. Multiply the two and the product is return on equity. Nothing in that is a theory about banking. It is division and multiplication.
What makes it useful is that the two pieces move for entirely different reasons. The first one is about lending spreads, fee income, credit costs and expenses. The second one is about regulation, capital policy and how aggressive the balance sheet is. Two banks can land on similar returns on equity while being nothing alike underneath.
The first piece is also the one that resists being flattered by growth, and this group is a clean demonstration of why. Between 2022 and 2025 its operating revenue rose from 3,195.3 billion won to 4,630.5 billion won, an increase of 44.92% by my calculation. Operating profit over the same stretch went from 825.8 billion won to 952.3 billion won, up 15.32% by my calculation. The top line grew close to three times as fast as the profit line.
Both movements have the same cause. A lender’s revenue line includes gross interest received, and the cost of the deposits and borrowings that funded it sits further down. When rates rise and the balance sheet grows, the revenue line inflates on both counts while the spread between them barely widens. The operating profit margin tracks that directly: 25.84% in 2022, then 19.08%, 19.60% and 20.57%. Net margin follows the same path, 19.35% down to 14.40% and back to 15.77%.
So a reader watching only the revenue line would have concluded this bank grew by nearly half in three years. A reader watching return on assets would have concluded it stood still. The second reader is the one describing the business.
JB Financial stock and three years of a falling equity multiplier
Here is the group’s own history, taken from the annual figures on the vendor screen and my own division of the balance sheet totals.
| Year end | Return on assets | Assets per unit of controlling equity | Product | Screen ROE |
|---|---|---|---|---|
| 2022 | 1.06% | 13.07 (my calculation) | 13.86% (my calculation) | 13.76% |
| 2025 | 1.04% | 12.36 (my calculation) | 12.86% (my calculation) | 12.36% |
My reconstruction runs 0.10 and 0.50 percentage points above the published return on equity. That is expected, because I am dividing by year-end capital while the vendor almost certainly uses an average across the period, and I could not confirm which averaging convention applies. I am showing my version alongside theirs instead of quietly replacing one with the other.
The direction is what interests me. Return on assets barely moved across those three years, drifting from 1.06% to 1.04%. The equity multiplier fell from roughly 13.07 to 12.36. Total assets grew 22.22% while total equity grew 29.65%, so capital outran the balance sheet and the multiplier had to come down. The reported decline in return on equity, from 13.76% to 12.36%, is mostly that. It is not a bank that got worse at lending.
A Japanese regional holding company built the same way
For a foreign comparison I wanted a lender with the same job, and size was beside the point: a listed holding company for provincial banks, serving a region away from the national capital, in a mature economy with an ageing population. Fukuoka Financial Group, listed in Tokyo under 8354, runs the banks of the Kyushu region and fits that description closely.
For its fiscal year ended March 2025 it reported net income of 72,136 million yen on total assets of 32,262,623 million yen and total equity of 929,183 million yen (Japan IR company page for Fukuoka Financial Group; the group’s own investor library carries the underlying reports). Those three figures give a return on equity of 7.76% by my calculation, which matches the published figure, and a return on assets of 0.2236%.
I deliberately did not divide a yen figure by a won figure anywhere in this piece. Every ratio above is computed inside one currency, and only the resulting percentages are compared.
Two things about the Japanese group are worth stating so the comparison is not mistaken for a like-for-like size match. It is much the larger institution in its own market, and its annual dividend of 95 yen sits alongside an earnings multiple that has expanded as domestic policy rates left their long stay near zero. Neither of those facts changes the two component figures I am using, but both explain why I am comparing structure and not scale. What I wanted from the comparison was a lender doing the same job under different conditions, and on that test the pairing holds.
| Measure | JB Financial (FY2025) | Fukuoka FG (FY ended Mar 2025) | Ratio |
|---|---|---|---|
| Return on assets | 1.04% | 0.2236% (my calculation) | 4.65 times in Korea’s favor |
| Assets per unit of equity | 12.36 (my calculation) | 34.72 (my calculation) | 2.81 times in Japan’s favor |
| Return on equity | 12.36% | 7.76% | 1.59 times in Korea’s favor |
| Earnings multiple | 8.53 times | 17.13 times | 2.01 times in Japan’s favor |
The Japanese group carries almost three times as many assets per unit of capital, and still ends up with a return on equity a little over half the Korean one. The whole difference, and then some, comes from the first row.
JB Financial stock, priced at half the multiple of a bank earning less
This is the part I have not been able to talk myself out of. The Korean group earns more on every unit of assets, takes less balance sheet risk to get there, and posts a materially higher return on equity. It trades at 8.53 times earnings. The Japanese group, on 0.22% asset returns propped up by 34.72 times leverage, trades at 17.13 times.
I am not going to pretend those two multiples are strictly comparable. Japanese lenders have spent the past two years re-rating as domestic policy rates normalized, which is a story about the future and not about the reported past, and a Tokyo listing carries index membership and a domestic investor base that a mid-cap Korean financial name does not. Both markets are pricing something other than last year’s ratios. Still, when I set out to explain a gap in returns on equity and reached first for leverage, I reached for the wrong half, and the multiples then went the opposite way to the one I would have guessed.
Where the fifteen houses put their numbers
Fifteen brokerages carried a published figure for this name on the September 10, 2026 screen. The range runs from 33,000 won at the low end to 42,000 won at the high end, a spread of 9,000 won or 27.27% of the low figure by my calculation, and the consensus sits at 37,533 won. Against the 31,450 won close that consensus sits 19.34% above the traded price by my calculation, with the top figure 33.55% above it.
One detail is worth more than the range. Every one of the fifteen figures sits above the traded price, but not every opinion does. Samsung Securities carried a hold rating dated August 18, 2026, with a figure of 34,000 won, and it is the only non-buy of the fifteen. A screen where the amounts agree and the ratings do not is telling me that at least one house thinks the arithmetic works while something else does not.
Five ways this reading fails
| # | What would break it |
|---|---|
| 1 | Asset quality is deteriorating on both sides of the group. Substandard-and-below loans at Jeonbuk Bank went from 170.5 billion won to 271.6 billion won between the June 2025 and June 2026 quarters, and at Kwangju Bank from 174.9 billion won to 281.7 billion won (Korean tax and finance press, September 2, 2026). Loan-loss reserve coverage at both banks has fallen below one times those balances. A return on assets held up by under-reserving is a return on assets that can be given back. |
| 2 | The two accounting regimes are not identical. Japanese and Korean disclosure differ in how consolidation scope and certain fee lines are drawn, and I did not reconcile the two sets of statements line by line. If the definitions diverge materially, the 4.65 times gap in asset returns is smaller than it looks. |
| 3 | A consumer finance arm is not a bank. A meaningful share of this group’s earnings comes from lending outside the two banks, at higher spreads and higher credit risk. Comparing the blended figure with a Japanese group weighted differently flatters the Korean side. |
| 4 | Fukuoka’s fiscal year ends in March. Its most recent full year closed six months before the Korean 2025 full year closed, and Japanese rate policy has been moving quickly (International Banker on Japanese banking profitability). The gap in the table is partly a gap in time. |
| 5 | The multiple may be pricing what I just described. If the market has read the reserve coverage figures the way the Korean press has, then 8.53 times is the answer and there is no anomaly to explain, and my framing has the causality backwards. |
What JB Financial stock does not tell me on this screen
Figures I checked and left out
I looked at the group’s debt-to-equity ratio, which reads 1,156.10% for 2022 and 1,084.16% for 2025, and left it out of the argument. For a bank that line is a restatement of the equity multiplier I already used, and putting both in would have made one observation look like two. I also have the group’s quarterly earnings for 2026, including 219.6 billion won of controlling-shareholder profit in the June quarter and 385.7 billion won for the first half, both ahead of the year-earlier periods (ZDNet Korea, July 23, 2026), but a single half-year does not move a three-year ratio and I did not build on it.
Two more screen figures stayed out. Foreign ownership stands at 34.20% and the trailing beta against the local market reads negative 0.05, which together describe a name that international money holds in size while it barely moves with the index. That is interesting on its own and it has nothing to do with what the assets earn, so it has no place in this argument. The same goes for the 52-week range of 38,500 won at the high and 21,700 won at the low. I did work out that the close sits 44.93% above that low by my calculation, and then noticed the figure lands within a rounding step of the 44.92% revenue growth from earlier in this piece. The two quantities are unrelated in every respect. I am flagging the collision because I came close to carrying one of them into a sentence about the other, and a reader skimming would have no way to catch that.
The group’s own capital plan, published in September 2024, sets out goals for return on equity, common equity tier one and total shareholder return through 2026 (JB Financial Group corporate value announcement, in Korean).
My position on JB Financial stock and what would end it
I own none of it and I have no order in. This is a watching note. At this size the name sits outside the group of companies where I take positions from a first pass, and nothing below should be read as me leaning toward one.
What I take away is narrower than the table might suggest. When two lenders post different returns on equity, my instinct is to reach for leverage, because leverage is the piece I can see fastest and the piece that has burned people most memorably. Here that instinct pointed exactly the wrong way. The bank with far more leverage earns far less, and the arithmetic said so before I had a story ready. I would like to be the sort of reader who lets the second row of a table overrule the first, and this was a small test of that.
Two things would close the observation. First, if third-quarter reserve coverage at the two banks stays below one times substandard-and-below loans while those balances keep climbing, then the asset return I built on is borrowed from a later period and the comparison collapses. Second, if the equity multiplier stops falling and turns back up, the mechanism I described for the declining return on equity stops applying and I would need a different explanation. Korea’s statutory deadline for the third-quarter report is November 16, 2026. I worked through a related question about how two subsidiaries of another provincial holding company diverged in a separate note on a peer whose discount had a traceable cause, and the two pieces sit on different questions: that one on why a valuation gap existed, this one on where a return comes from.

Related reading: a note on a state-linked lender and its payout
Annual figures are full-year 2025 for the Korean group and the fiscal year ended March 2025 for the Japanese one. Korean won is the reference currency and the single US dollar conversion is approximate, at roughly 1,338 won per dollar on that date.
Prices and multiples reflect the September 10, 2026 close as checked at the time of writing. Korean won is the reference currency throughout, and the single dollar conversion uses roughly 1,338 won per dollar on that date, an approximate figure carried for the reader’s convenience. Ratios described as my calculation were computed by me from published totals and do not appear in that form in any source. Screens consulted: the vendor company page for 175330 and the Seoul dollar-won rate history.