Sam Chun Dang Pharm Stock and an Equipment Bill: Five Years
- Audited annual statements show fixed assets at KRW 143,094 million at the end of 2025, against KRW 74,112 million four years earlier.
- The same statements show five years of operating cash totaling KRW 60,564 million and five years of building outlays totaling KRW 101,347 million.
- A company release supplies the growth story that would justify the difference. That release is also what drew a disclosure penalty in April 2026, so I left it out of my arithmetic.
Sam Chun Dang Pharm stock is a KOSDAQ name. KOSDAQ is Korea’s secondary market, roughly what the Nasdaq Capital Market is to US listings, and it holds most of the country’s smaller drug makers. This one sells eye medicines and has spent the past five years turning itself into a manufacturer of an aflibercept biosimilar, the copy version of the drug Regeneron sells as Eylea.
The building came before the selling. Between the end of 2021 and the end of 2025 the company put KRW 101,347 million into equipment and facilities, which is about USD 73.42 million. Over exactly the same five years it collected KRW 60,564 million of operating cash, about USD 43.87 million. The outlays ran to 1.6734 times the cash, by my calculation, and the difference had to come from somewhere other than the business.
I am not holding the shares and I have no order in. What follows is my reading of where the money went and where it came from, taken from the balance sheet and the cash flow statement only.
Contents
Sam Chun Dang Pharm Stock Sits on Five Years of Building
Fixed assets on the balance sheet went from KRW 74,112 million at the end of 2021 to KRW 143,094 million at the end of 2025. That is a 93.0780 percent increase over four years, by my calculation, and the trailing figure reported for March 2026 is higher again at KRW 150,448 million.
Total assets grew over the same stretch too, from KRW 343,948 million to KRW 561,231 million, which is 63.1732 percent. Because the equipment grew faster than everything else, its weight inside the company rose. Fixed assets were 21.5474 percent of total assets at the end of 2021 and 25.4965 percent at the end of 2025, both worked out by me.
That is a real change in what the company is. Four years ago it looked like a distributor with a factory attached. Now a quarter of the balance sheet is production capacity.
Yearly outlays against yearly depreciation
Depreciation tells you roughly what a company must spend to stand still. When spending runs far above it, the company is adding capacity instead of maintaining it.
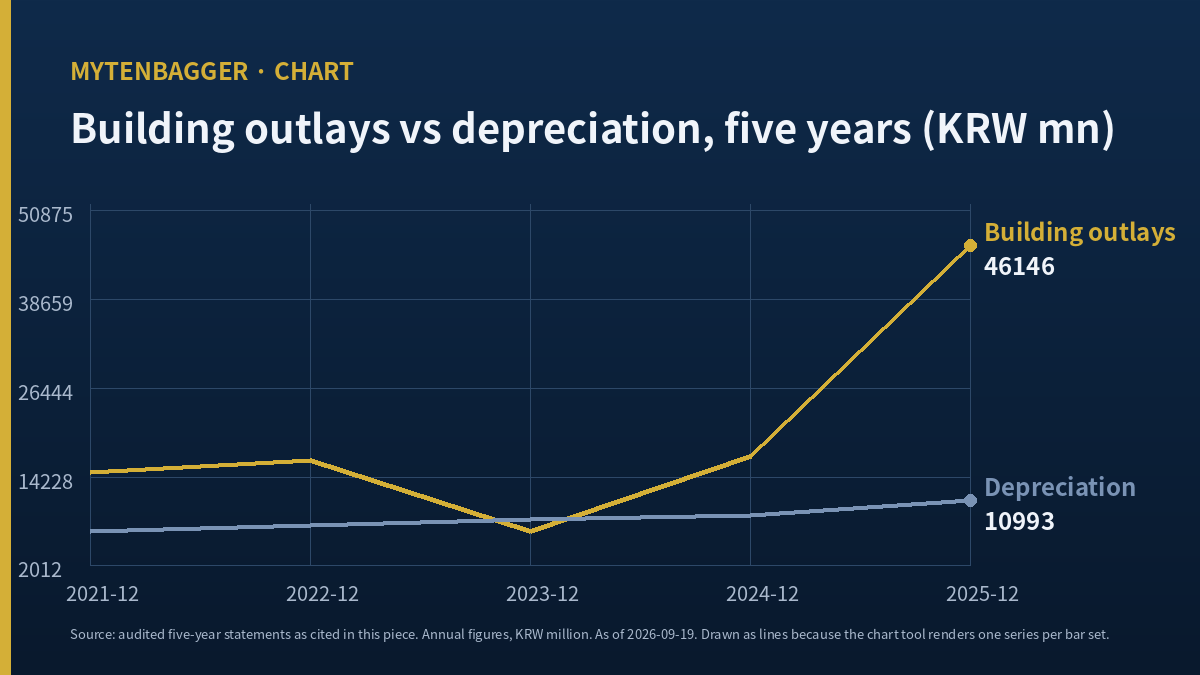
Here are both lines for five years, in millions of won. Building outlays: 14,882 in 2021, 16,531 in 2022, 6,766 in 2023, 17,022 in 2024, and 46,146 in 2025. Depreciation and amortization: 6,741, then 7,651, then 8,430, then 9,029, then 10,993.
The five-year totals are KRW 101,347 million of outlays against KRW 42,844 million of depreciation, a ratio of 2.3654 by my arithmetic. For 2025 alone the ratio is 4.1978. Whatever the company was doing last year, it was not maintenance.
Sam Chun Dang Pharm Stock and the Five-Year Balance Sheet
| KRW million | 2021 | 2022 | 2023 | 2024 | 2025 |
|---|---|---|---|---|---|
| Fixed assets | 74,112 | 87,212 | 90,009 | 103,595 | 143,094 |
| Total assets | 343,948 | 372,793 | 408,022 | 519,772 | 561,231 |
| Cash and equivalents | 49,113 | 22,101 | 40,427 | 105,585 | 95,944 |
| Total debt | 51,541 | 76,590 | 53,625 | 49,941 | 69,831 |
| Total equity | 250,301 | 245,642 | 298,460 | 349,404 | 363,593 |
| Of which minority interest | 76,206 | 71,901 | 77,961 | 83,299 | 87,574 |
| Operating cash flow | -7,707 | 13,279 | 23,428 | 21,771 | 9,793 |
| Free cash flow | -22,589 | -3,252 | 16,662 | 4,748 | -36,353 |
Source: balance sheet and cash flow statement, both pages carrying a March 31, 2026 update stamp. Ratios and totals in this piece are mine.
One number in that table does not agree with my own subtraction
Free cash flow is operating cash minus building outlays. For four of the five years the published line matches what I get by hand. For 2024 the table prints 4,748 and my own working gives 4,749. A one million won gap on a figure of that size is a rounding artifact, and I have left the published value in the table so the source and the page agree. I mention it because I checked every row this way and this was the only one that moved.
Where the Money Came From
Five years of free cash flow add up to minus KRW 40,784 million. The building was therefore paid for outside the business. The financing section of the cash flow statement says how.
Borrowing, year by year
Net debt issued reads 28,659 in 2021, 20,251 in 2022, 4,267 in 2023, minus 4,566 in 2024, and 27,341 in 2025, in millions of won. The five-year total is KRW 75,952 million, about USD 55.02 million.
Total debt on the balance sheet did not rise by anything like that amount, which tells me the borrowing was rolled forward instead of stacked. It stood at KRW 51,541 million at the end of 2021 and KRW 69,831 million at the end of 2025, and the trailing March 2026 figure is lower again at KRW 48,724 million.
And one share sale in 2024
The share issuance line is blank or trivial in four of the five years. In 2024 it reads KRW 71,215 million, about USD 51.59 million. That single year supplied most of the outside money.
I could not establish from the statements whether that was a placement, a rights issue, or bonds converting into shares. The cash flow statement records the money arriving and does not say through which door. Book value per share moved in a way consistent with a modest increase in the share count over the period, but I could not pin the mechanism, so I am recording it as unresolved and not building on it.
The dividend paid in the worst cash year
One line in the financing section runs against the rest of the story. Dividends paid read 968 in 2021, 968 in 2022, 881 in 2023, and 890 in 2024, all in millions of won. In 2025 the figure is 4,651. That is 5.2258 times the prior year by my arithmetic, and it lands in the same year free cash flow came to minus KRW 36,353 million, the weakest of the five.
The amounts are small against everything else here, so this is not a solvency point. It is a signalling point, and it cuts both ways. A board that raises the payout more than fivefold in its heaviest spending year is either confident about what the equipment will earn, or is attending to shareholders at a moment when the cash statement does not support the gesture. I cannot tell which from the statements, and I am not going to pretend the number settles anything. I note it because a company genuinely short of money does not usually do this.
Adding the two together, roughly KRW 147,167 million came in from lenders and share buyers over five years against KRW 101,347 million of building outlays. The ratio is 1.4521 by my calculation. The outside money covered the equipment and left change.
Korean drug makers reach for outside money at very different points in their lives, and the reason matters more than the amount. I made the same argument the other way round when Hanmi Pharmaceutical’s China unit lost 96.6 percent of its operating profit while the headline licensing numbers looked fine. The headline and the funding line answer different questions.
How much of the equipment belongs to the listed holders
Total equity is not the same as the equity behind the listed shares. Minority interest sits inside the total, and here it is large. Subtracting it leaves KRW 174,095 million at the end of 2021 and KRW 276,019 million at the end of 2025, both figures mine by subtraction from the table above.
Read as a share of the total, minority interest was 30.4457 percent in 2021 and 24.0857 percent in 2025. It shrank as a proportion because the controlling side grew faster, while the minority side rose every year in money terms.
This matters for how the building is read. Fixed assets grew 93.0780 percent while the equity behind the listed shares grew 58.5450 percent. Some of the new capacity sits in entities the listed holders own only part of, and the statements as published do not tell me which entities hold which machines. Anyone pricing this on plant value alone would want that split before doing so.
The Twelve Months That Turned Operating Cash Negative
The trailing figures on both statement pages are stamped March 2026. Operating cash flow for that window reads minus KRW 1,129 million. Building outlays for the same window read KRW 51,911 million, higher than any single full year in the table. Free cash flow comes to minus KRW 53,040 million.
What a negative operating line does and does not mean
A negative operating line in a growing pharmaceutical business is usually traced to working capital and only rarely to losses. Inventory built ahead of deliveries and receivables from new export customers both sit in that calculation. The company was preparing for a large step up in export volume, so a build of that kind is what I would expect to see.
That reading is a guess until the notes confirm it. What is not a guess is the sequence: the company spent more on equipment in that window than in any prior year while the operating line was below zero. Cash on the balance sheet fell from KRW 105,585 million at the end of 2024 to KRW 95,944 million a year later and to KRW 84,205 million at the trailing date.
What the current accounts show underneath that
The working capital lines give the explanation something to stand on. Current assets read 168,920 in 2021, 157,749 in 2022, 163,906 in 2023, 242,532 in 2024, and 241,759 in 2025, in millions of won, with the trailing March 2026 figure at 240,295. Current liabilities over the same years read 54,019, then 38,160, then 57,957, then 93,421, then 106,572, and 109,981 at the trailing date.
Working capital, the difference between the two, is printed as 114,901, then 119,590, then 105,949, then 149,112, then 135,187, and 130,314 at the trailing date. The pattern I read there is a company that pulled a large amount of short-term resource in during 2024, then let it drain slowly while the current liabilities kept climbing. Current liabilities roughly doubled from the end of 2021 to the end of 2025, which is 97.2861 percent by my calculation, while current assets rose 43.1204 percent.
That is consistent with inventory and receivables building ahead of deliveries, and it is equally consistent with payables being stretched. The statements do not separate the two, and the difference matters, so I am leaving it open.
Watching a company spend into a cash dip is not automatically a warning. I said something close to this about Samsung Biologics and the multiple I would not pay, where the spending was defensible and the price was the problem. The difference is that the larger company was already earning while it built.
What I Did Not Use in This Piece
Four things I could have used and left out.
First, the income statement. Revenue, cost lines and margins would all have fit here. I chose to build this piece on the balance sheet and the cash flow statement alone, because the question I wanted answered was about money spent and money raised. When I looked at SK Biopharm growing revenue faster than prescriptions I made the opposite choice, and the two questions really are separate.
Second, per-share earnings. Four providers print four different values for this company. I could not establish which are consolidated and which are parent-only, so every per-share figure is absent from this piece.
Third, the company’s own account of its export orders. It has described a large confirmed order book for 2026 and has published quarterly figures for a newly launched product. Those numbers are the reason the shares moved this year. They are also the subject of an April 2026 penalty from the exchange for the way they were released, so I have kept them out of the arithmetic and mention them only as context.
Fourth, the sell-side view. I opened four places looking for named-broker estimates for 2026 and 2027: a Korean consensus page, a retail platform’s report list, a stock data site, and general search. The consensus page carried a September 14, 2026 stamp with zero in the valuation field. I found no named house with a published forecast. I am recording that as the four places I opened, which is a narrower claim than saying no coverage exists.
Sam Chun Dang Pharm Stock Next to Regeneron
I picked the peer on one rule: the company that sells the original of the molecule this business has said it intends to copy. That is Regeneron Pharmaceuticals, which sells aflibercept as Eylea.
Each ratio stays inside its own company
I am putting one line side by side and nothing else, and I am not turning the two into a comparison. Regeneron reports in dollars under United States accounting standards, at a scale about three orders of magnitude larger, and with a depreciation policy I have not read. A ratio built from its numbers and a ratio built from the Korean company’s numbers are not measuring the same thing.
So, separately. Regeneron’s 2025 building outlays were USD 898.4 million against depreciation and amortization of USD 543.7 million, which is 1.6524 inside that company. Over its own five years it spent USD 3,514.9 million against USD 2,075.2 million of depreciation, and it collected USD 26,090 million of operating cash across the same stretch.
The Korean company’s own figure for 2025 was 4.1978, shown earlier. I will not divide one by the other. What I take from setting them down together is narrower and, I think, more honest: the originator funds its building out of operations several times over, and the copier does not yet.
Three Paths I See for Sam Chun Dang Pharm Stock
The percentages below are my judgment and come out of no model.
The path I find most likely, about 45 percent. The export ramp arrives slowly through 2026 and 2027. Operating cash turns positive again as inventory converts, building outlays fall back toward depreciation once the current program finishes, and the balance sheet stops needing outside money. The equipment then earns. This is the path the spending was presumably built for.
Where I could be wrong, about 35 percent. The ramp is slower than the capacity, operating cash stays thin, and the company goes back to lenders or to shareholders in 2027. A second share sale at a much lower price than the one in 2024 would change what every existing holder owns.
The rest, about 20 percent. The good version, around 13 percent, is that confirmed orders convert faster than I expect and the trailing operating line turns sharply positive within two quarters. The poor version, around 7 percent, is that the disclosure problem repeats or the biosimilar meets pricing pressure from later entrants before the equipment is loaded.
Twenty Reasons Sam Chun Dang Pharm Stock Could Prove Me Wrong
- I chose 2021 as the starting year. Starting from 2022 makes the fixed-asset increase 64.0760 percent instead of 93.0780 percent, by my calculation.
- Building outlays are lumpy by nature. One large program inside a five-year window distorts every ratio I built.
- Depreciation lags spending. A company that has just finished building always shows a high ratio of outlays to depreciation, and the ratio falls on its own afterwards.
- The five-year totals treat won of 2021 and won of 2025 as the same unit.
- The balance sheet and cash flow pages carry a March 2026 stamp. The trailing window on those pages may not match the trailing window on other pages of the same site, and I did not confirm that it does.
- The trailing operating cash figure of minus KRW 1,129 million is a single window and not a trend.
- Working capital is my explanation for that negative figure. I did not open the notes that would confirm it.
- Total debt fell between the 2025 close and the trailing date, which sits awkwardly with a company that needs outside money.
- The 2024 share issuance is unexplained in this piece. If it was bonds converting, the economics differ from a placement.
- Minority interest is about a quarter of total equity, which means a meaningful share of these assets belongs to someone other than the listed holders.
- I did not separate leased assets from owned equipment inside the fixed-asset line.
- Goodwill and intangibles rose from KRW 18,920 million to KRW 33,179 million over the five years, and I did not examine what was acquired.
- Regeneron is a much larger company at a different point in its life, and I said so instead of turning the two into a comparison.
- Choosing the originator as the reference point is itself a view. A copy-drug maker of similar size would give a different picture.
- The confirmed order book and the launched product may make all of this arithmetic look backward-looking within two quarters.
- The April 2026 penalty carried five points, far below any level that interrupts trading, and the shares traded normally through September 18, 2026.
- Treating that penalty as a reason to discount company figures is a judgment and not a finding.
- The three probabilities are mine and nothing generated them.
- I read the financial statements through one data provider, using its pages in place of the filings themselves.
- I do not own the shares, and a piece written by someone who has never held a position does not know what the holding felt like.
Four Conditions That Break My Read on Sam Chun Dang Pharm Stock
- Nine-month operating cash flow returns above zero.
- Nine-month building outlays fall below nine-month depreciation.
- The fixed-asset note separates leased assets from owned equipment, and leases turn out to be the larger part.
- Another share sale or convertible issue is announced before the end of 2026.
The first two answer each other on the same statement, and they answer first. The third needs the notes behind that statement. The fourth can arrive on any day or never. I will weigh the first two together, because either one alone tells me less than the pair does.
When I Look at Sam Chun Dang Pharm Stock Again
The trailing window is where I nearly went wrong on this one. I had the balance sheet open in one tab and the income figures in another, and I read both trailing columns as covering the same twelve months. Then I noticed the two pages carried different update stamps, months apart. I could not establish that the windows matched, so I dropped every cross-statement ratio I had started to build and kept this piece inside the two pages that share a stamp.
The rule I am keeping from that: before pairing two numbers from two pages, read the update stamp on each page first, and if the stamps differ, treat the pairing as unavailable until proven otherwise.
The line that would tell me fastest that I am wrong
Next results are scheduled for November 12, 2026. The single line that would retire this piece quickest is nine-month operating cash flow. If it comes back above zero while building outlays are still running high, then the negative trailing figure was a working capital swing exactly as the optimistic reading says, and the framing here becomes a description of a phase that has already ended.
Until that line prints, I am watching and not buying. The close on September 18, 2026 was KRW 159,600, about USD 115.62. What I would be paying for is capacity that has been built and has not yet been loaded, financed by lenders and by one share sale, in a company whose most encouraging numbers reached me through a release the exchange has already penalized. Each of those is survivable on its own. I would rather see the cash line first.
Prices reflect the September 18, 2026 close. Dollar figures are approximate, converted at roughly KRW 1,380.39 per dollar, the September 17, 2026 close, and rounded. Annual statements come from stockanalysis.com; the peer figures are from its Regeneron cash flow page, stamped July 30, 2026. The close and market data were read at chickstockfi and kokstock; the absence of broker forecasts was checked at a Korean consensus page; the April 2026 disclosure penalty is reported by Korean press; the scheduled results date is listed at Investing.com. Ratios, five-year totals and conversions were computed by me.