
NICE Information Service Stock, Four Years: Profit Up 48%
I went looking for the equipment. A company that grew revenue by a quarter over four years should have bought something to do it with, and I wanted to see what. The capital spending line for 2025 reads 5.43 billion won, which is less than the same line read in 2022.
Three sentences up front. First, NICE Information Service stock sits on a business that generated 352.2 billion won of operating cash across 2022 through 2025 and spent 26.1 billion won of it on capital items, or 7.41 percent. Second, the cash that did not become equipment went into dividends and into a slowly shrinking share count. Third, I hold none of this company and I have placed no order in it.
Where four years of operating cash landed
| Line | 2022 through 2025, billion won | Share of operating cash | Source of the figure |
| Operating cash flow | 352.2 | 100 percent by definition | Filed, four annual rows added by me |
| Capital spending | 26.1 | 7.41 percent | Filed, four annual rows added by me |
| Cash dividends paid for fiscal 2025 alone | 29.8 | 24.68 percent of the 2025 figure of 120.9 | Filed dividend schedule |
| Total equity, end of period | 341.6 to 469.5 | Not a use of cash, shown for scale | Filed balance sheet, both ends |
The fourth column says where each figure came from. Two of the four are sums I built from separate annual rows, and a sum I build is a place I can be wrong. The dividend and equity figures are printed as they stand.
Contents
NICE Information Service Stock Sits on a Business With Almost No Equipment
This company sells credit scores and the data behind them. A 2023 September 4 company report from Daishin Securities, written by Park Hye-jin, put the revenue split at 65 percent personal credit bureau work, 20 percent corporate credit bureau work, and 15 percent big data and receivables collection. That report is old enough that the mix has probably moved, and I used it only to see roughly how the revenue divides.
The financial consequence of selling scores is visible in one line. Capital spending was 5.71 billion won in 2022, 7.59 billion in 2023, 7.36 billion in 2024, and 5.43 billion in 2025. Revenue over the same four years went from 479.9 billion won to 602.1 billion won, a gain of 25.48 percent. Revenue grew by 122.3 billion won while the capital line stayed inside a band roughly five to eight billion won wide and finished 4.92 percent below where it started.
I want to be careful about what that does and does not prove. It shows that the line labeled capital spending did not grow. It does not show that the company invested nothing, because purchased data, software development and stakes in other companies may be recorded outside that line. Settling that would take the notes to the annual report, which I did not open for this article. So this observation carries a caveat, and I am not upgrading it to a conclusion.
The Close I Used and the Three Screens I Set Aside
The price basis is the confirmed regular-session close of 15,400 won on 2026-09-18, which is the last trading day before this was written. Four screens printed four numbers for that one session.
The daily price table I trust most marked 2026-09-18 as final, exchange scope KRX, close 15,400 won, volume 50,463 shares. The indicator screen on the same server put 15,320 won in its current-price field with no final marker, and that number falls between the session low of 15,200 and the high of 15,800. A Korean retail screen labeled 15,200 won as the 2026-09-18 regular session. Another labeled 15,350 won at 19:59 on the same date.
I took the one carrying a final marker, and because the four disagree I print no percentage move anywhere in this article. Market capitalization is my own multiplication: 15,400 won times 58,270,235 shares outstanding gives 897.4 billion won, or about 648.7 million dollars at 1,383.3 KRW per USD, the Seoul interbank daytime close on 2026-09-18. The indicator screen prints 892.7 billion won, which resolves against 15,320 won, so it is standing on a different price than mine.
The multiples in this article are mine
Price to earnings of 11.63 times comes from my 897.4 billion won divided by 2025 profit attributable to owners of the parent of 77.2 billion won. Price to book of 1.93 times comes from the same figure divided by equity attributable to owners of 463.9 billion won. Neither was copied from a screen.
One screen deserves a specific warning. Its earnings per share field of 1,298.31 won is described on the screen itself as the current price divided by the price to earnings ratio. Checking that ratio with that earnings figure returns the ratio you started with. A number that cannot be checked independently does not go into an article of mine.
Operating Cash Behind NICE Information Service Stock Grew Faster Than Profit
Operating cash flow ran 71.8 billion won in 2022, 74.4 billion in 2023, 85.2 billion in 2024, and 120.9 billion in 2025. That last figure is 68.39 percent above the 71.8 billion of 2022. Over the same four years consolidated net profit went from 52.7 billion won to 78.1 billion won, a gain of 48.16 percent, and operating profit went from 71.6 billion won to 104.4 billion won, a gain of 45.76 percent.
So cash from operations grew about twenty percentage points faster than either profit line. For a business with an almost flat capital line, that gap is what turns into distributable money. Free cash flow, taken as operating cash less capital spending, came to 326.1 billion won across the four years. Against my market capitalization of 897.4 billion won, four years of free cash equal 36.34 percent of what the whole company is priced at.
I am not presenting that as a valuation argument. It is a magnitude, and magnitudes need a period attached to them. Four years of anything compared with a price on one day is a comparison between a flow and a stock, and readers should hold it loosely.
One year in the window broke the pattern in the other direction. In 2023 revenue rose only 1.22 percent, from 479.9 billion won to 485.7 billion won, while operating profit fell 8.78 percent, from 71.6 billion won to 65.3 billion won. Net profit still rose that year, from 52.7 billion won to 56.0 billion won, so the squeeze sat above the profit line and not below it. The Daishin report written a few weeks into that stretch tied the pressure to the interest rate environment, and I have no way to confirm that attribution from the filings themselves.
Every first quarter runs the cash the other way
Inside the annual figures there is a pattern the annual figures hide. Operating cash flow for the first quarter alone was negative 7.0 billion won in 2024, negative 2.7 billion won in 2025 and negative 9.6 billion won in 2026. Three first quarters in a row consumed cash while every full year produced large amounts of it.
The fourth quarter does the opposite work. Single-quarter operating cash was 47.4 billion won in the fourth quarter of 2024 and 45.8 billion won in the fourth quarter of 2025, and in each case that one quarter exceeded half of what the whole year collected. Three consecutive years repeated the same sequence, a draining first quarter and a refilling fourth. Repetition at that length reads to me as how the billing calendar works, so I record it as a property of the business and not as an event.
The practical consequence is narrow but real. Anyone reading a first quarter report at this company and seeing negative operating cash is looking at the normal position of the calendar, not at a deterioration. I would only start reading it as deterioration if a fourth quarter failed to reverse it, and no fourth quarter in the window has failed to.
NICE Information Service Stock and a Share Count Reconstructed From Dividends
The company filed a corporate value enhancement plan that commits to buying back and retiring one percent of its own shares each year, to a consolidated payout ratio of at least 35 percent, and to raising the dividend per share by five percent over the prior period. It set 2027 targets of more than 690 billion won of revenue and more than 110 billion won of operating profit, with a stated compound annual growth rate of nine percent.
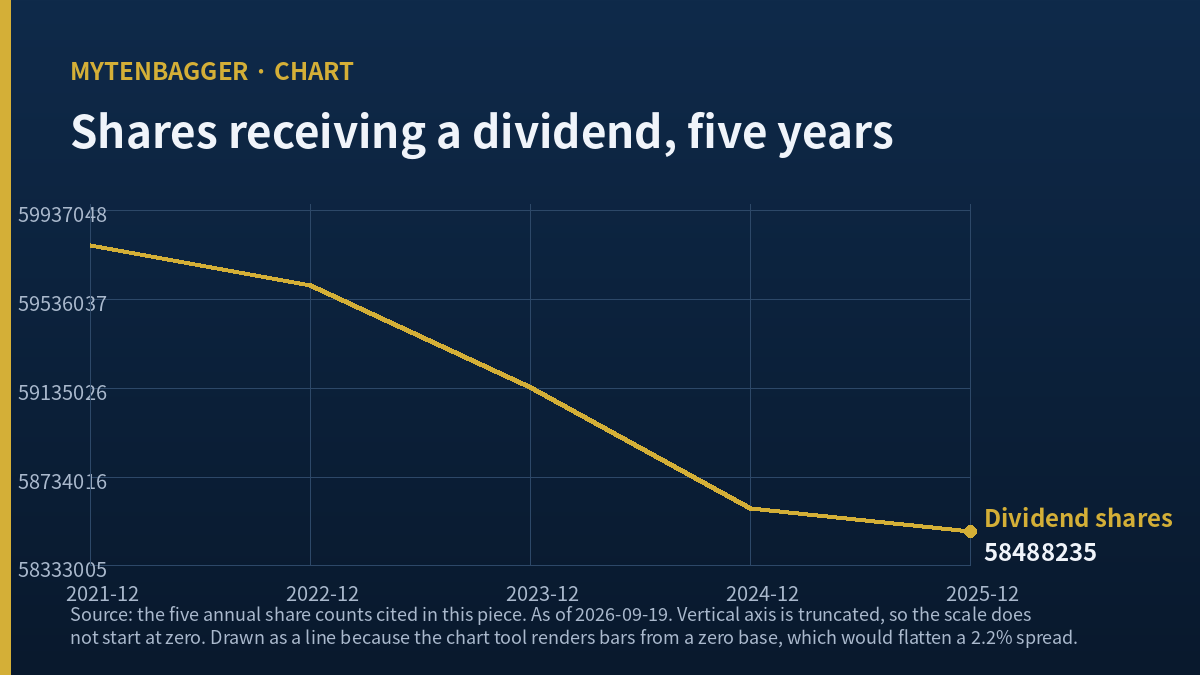
Commitments are easy to file. I wanted to see whether the retirement part was actually happening, so I divided total cash dividends paid by dividend per share for each of five years. That quotient is the number of shares that received a dividend.
| Fiscal year | Total cash dividend, billion won | Dividend per share, won | Shares that received it |
| 2021 | 19.73 | 330 | 59,781,818 |
| 2022 | 22.05 | 370 | 59,600,000 |
| 2023 | 24.25 | 410 | 59,141,463 |
| 2024 | 26.95 | 460 | 58,591,304 |
| 2025 | 29.83 | 510 | 58,488,235 |
The count falls in every step. From 2021 to 2025 it drops 2.16 percent, from 59,781,818 to 58,488,235. Shares outstanding as of the 2026-09-18 session stand at 58,270,235, which is 2.53 percent below the 2021 figure. The annual reduction is smaller than the one percent per year the plan describes, so either the retirements are running behind the commitment or the timing of retirement and record date pushes part of the effect into the following year. I could not settle which from the dividend schedule alone.
What NICE Information Service Stock Pays Out, and on Which Basis
Dividend per share has climbed every year in the filed history: 100 won for 2014, then 120, 130, 140, 190, 230, 275, 330, 370, 410, 460 and 510 won for 2025. The 510 won for fiscal 2025 was approved at the shareholder meeting on 2026-03-23. Filed payout ratios for the last four years read 42.0 percent, 43.0 percent, 35.0 percent and 38.2 percent against consolidated profit.
There is a conflict worth flagging. One indicator screen prints a payout ratio of 39.3 percent and, a few fields away, a raw payout ratio of 53.4 percent for the same company at the same moment. I could not establish which period each field measures. Because the article does not rest on the payout ratio, I am naming the conflict and leaving both numbers out of the argument.
First Half of 2026 Came in Above the Same Half of 2025
Half-year revenue was 319.2 billion won against 293.5 billion won for the first half of 2025, a gain of 8.74 percent. Operating profit was 62.3 billion won against 52.5 billion won, a gain of 18.51 percent. Consolidated net profit was 51.6 billion won against 42.0 billion won, a gain of 23.04 percent. The filing receipt number for the half-year report is 20260813000967.
Operating margin for that half reads 19.51 percent, computed from 62.3 billion won on 319.2 billion won of revenue. For full-year 2025 the same computation gives 17.34 percent, from 104.4 billion won on 602.1 billion won. Both figures are above every full year in the four-year window. The next scheduled filing is the third quarter report, with a statutory deadline of 2026-11-15.
Three Pages I Opened Before This One
I reread three pieces in this corpus before writing, each for a different reason.
- To avoid repeating a description of the same industry, I went back to the piece on Korea Ratings trading at 4.3 times sales against 10.5 at Moody’s. That article made the credit rating business itself the subject, which is why this one does not.
- To check how I had previously read a company that retired stock, I opened the piece on Dentium falling 40 percent in the year it retired 15.9 percent of its shares. A shrinking count lifts per-share figures and says nothing about direction.
- To remind myself how thin a reported gain can look next to the market reaction, I opened the piece on Kyungdong Navien dropping 11.3 percent on the day of a beat.
I opened all three and matched the headline on each before linking.
NICE Information Service Stock Carries One Published Estimate
Forward coverage is thin. I widened the date window to twelve months and looked past the main financial press, and I still found one named brokerage estimate. I am recording that gap instead of filling it.
LS Securities analyst Jeong Hong-sik published a company visit note on 2025-07-09 with a buy opinion maintained and a 20,000 won valuation. The note carried 2025 estimates of 592.0 billion won of revenue, 99.6 billion won of operating profit and 81.0 billion won of net profit, and 2026 estimates of 644.8 billion won, 108.7 billion won and 88.2 billion won.
Set against what was filed, the 2025 revenue estimate of 592.0 billion won came in 10.1 billion won under the reported 602.1 billion won, and the operating profit estimate of 99.6 billion won came in 4.8 billion won under the reported 104.4 billion won. The net profit estimate of 81.0 billion won came in 2.9 billion won over the reported consolidated 78.1 billion won. Two lines beat the estimate and one did not.
Equifax as a Method Test for NICE Information Service Stock, Not a Ranking
The global comparison here is Equifax (NYSE: EFX). I did not pick it for size and I did not pick it for growth. I picked it because I wanted to run my own arithmetic on a second company and see whether that arithmetic is capable of returning the opposite answer.
The test is simple. Take four-year revenue growth and four-year operating profit growth and see which is larger. At the Korean company, revenue grew 25.48 percent and operating profit grew 45.76 percent, so profit grew faster. At Equifax, revenue went from 5,122 million dollars in 2022 to 6,075 million dollars in 2025, a gain of 18.61 percent, while operating income went from 1,090 million dollars to 1,142 million dollars, a gain of 4.77 percent. There, revenue grew faster.
That is the result I was looking for. A calculation that returns the same verdict everywhere is not measuring anything, and this one does not. It reversed at the second company I tried it on, which means the answer it gave at the first company carries information.
What I did not do: I did not convert either set of figures into the other currency, I did not build a combined table, and I did not say which company is better. The two sets are prepared under different accounting standards and I did not confirm that operating income means the same thing in both. One reproduction did work and is worth recording. Equifax 2025 price to earnings of 40.22 times net income of 660.3 million dollars implies a market value of 26,558 million dollars, and dividing that by the price to book of 5.61 gives equity of 4,734 million dollars. Working instead from return on equity of 13.76 percent and the same net income gives 4,799 million dollars. The two routes meet within 1.37 percent.

NICE Information Service Stock: My Stance and Six Objections
I hold none of this and have placed no order. At a market value of 897.4 billion won the company sits outside the top hundred on its home market, so my default of watching without a position applies. Two conditions would end the watch. The first is capital spending rising above 20 percent of operating cash flow in a full year, which would mean the business has started to need equipment. The second is the share count derived from dividends paid rising above the prior year, which would mean the retirement program has stopped. My checkpoint is 2026-11-16, just after the third quarter filing deadline.
Six objections follow. They are ordered by how cheaply I could check each one, not by how likely each is to be right. The ones at the top can be checked from this page alone.
- The capital spending claim rests on that line covering all of this company’s investment. If purchased data or capitalized software sits elsewhere, the section is void. Cost to check: open the notes to the annual report.
- Four years of free cash compared with one day of market value mixes a flow with a stock. Choosing a different four years would change the ratio. Cost to check: nothing, the objection is visible in the arithmetic above.
- A share count derived from dividends paid is not the same thing as shares outstanding on any given date. Treasury shares do not receive dividends, so my series may be tracking treasury movements as much as retirements. Cost to check: pull the share ledger from the filings.
- One published estimate, from 2025-07-09, is not coverage. Nothing in this article reflects a professional view formed after the first half of 2026 was filed. Cost to check: wait for the next report.
- Operating margin at 19.51 percent for a half year has not been tested against a full year yet. Half-year margins at this company have historically run below the eventual full-year figure in some years and above it in others. Cost to check: compare six half-year filings.
- Alternative credit scoring would change the premise under every number here. The 2023 Daishin report already noted that telecom carriers and fintech firms were developing alternative scoring methods and entering personal credit assessment indirectly. Cost to check: highest of the six, since competitor share data is not filed anywhere.
NICE Information Service Stock, and the Steps of This Article in Reverse
Here are the checks I ran, last one first. The order matters because the thing I verified last is the weakest joint in the piece.
The last thing I did was open three internal destinations and match their headlines. Before that I ran the growth comparison on Equifax twice, once to get the numbers and once to confirm the sign reversed. Before that I divided dividends paid by dividend per share for five years to rebuild the share count. Before that I added four annual cash flow rows and four annual capital spending rows into the two sums that anchor this article. Before that I compared four screens on one session close and decided to print no percentage move. And the first thing I did was to go looking for equipment that turned out not to be there.
The top of that list, the internal links, can be wrong without touching the argument. The bottom of it cannot. If the capital spending line is not what I take it to be, the question I started with was the wrong question, and everything I built on top of the answer comes down with it.
Values I Left Out, and Sources
Four things were available and went unused. The ratio of profit to equity held inside a narrow band across all four years, which is a real observation, but I left it for a separate treatment because tracing cash was the job here. Total liabilities of 177.0 billion won against interest expense of 1.1 billion won implies a cost on those liabilities of 0.64 percent, which says most of that balance is not borrowed money. The book value per share printed on one indicator screen at 7,931 won does not resolve against either equity figure at the end of 2025, so it is out. Foreign ownership of 32.65 percent belongs in a section on share flows that this article does not have.
Sources for the figures above. Financial statement values come from Korean regulatory filings, receipt number 20260313001207 for fiscal 2025 and 20260813000967 for the first half of 2026, as republished on the company’s own investor relations page. Session prices were compared on a Korean retail quote screen and a second Korean market data screen. Year-by-year return figures used as a cross-check came from Korea Economic Daily company financials and a Korean valuation summary page. The brokerage estimate is the LS Securities visit note of 2025-07-09, and the business mix and competitive note come from the Daishin Securities report of 2023-09-04. The corporate value enhancement targets are reported by Bloter. Peer figures come from Equifax annual financials and Equifax financial ratios. The exchange rate of 1,383.3 KRW per USD is the Seoul interbank daytime close for 2026-09-18, confirmed in Korean press at Money Today and Asia Economy.
Related reading