SK Biopharm Stock Grew Revenue Faster Than It Grew Prescriptions
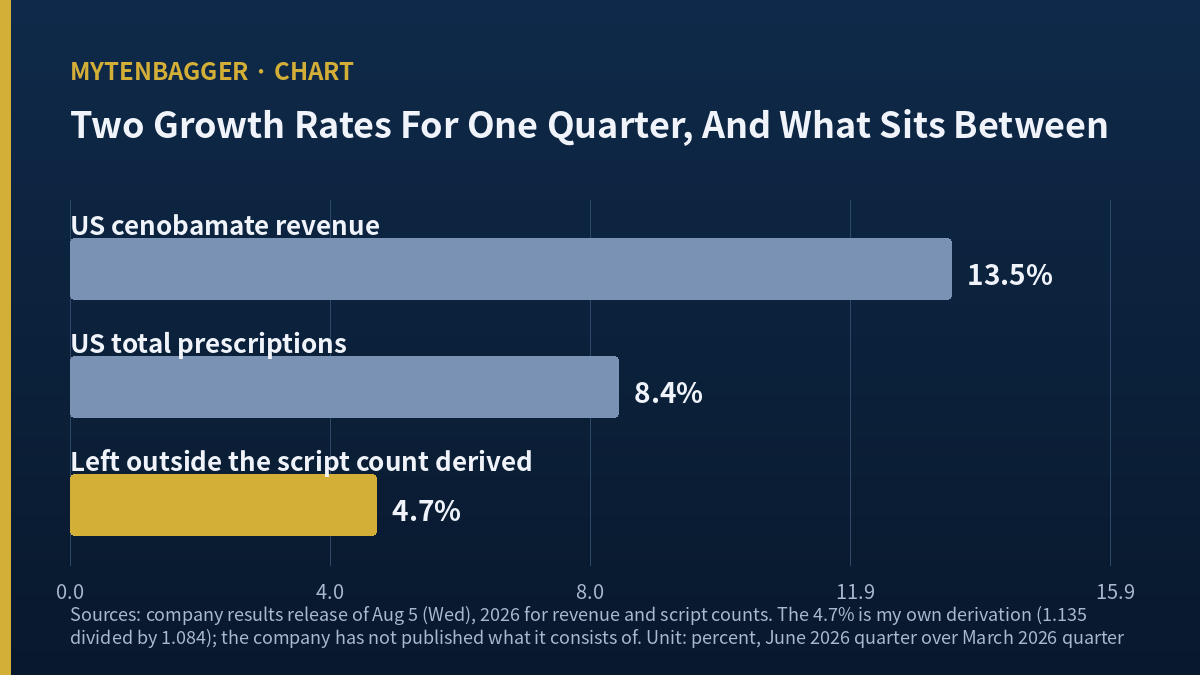
I keep two numbers for SK Biopharm stock in the same row of my notes, and in the June 2026 quarter they stopped matching. US prescriptions for cenobamate went up 8.4 percent over the March quarter. US revenue from the same drug went up 13.5 percent. Set the two growth factors against each other, the revenue one over the prescription one, and roughly 4.7 percent of the increase is left standing outside the script count. I do not know what that 4.7 percent is, and the company has not printed the split.
| What I measured | Q1 2026 | Q2 2026 | Move |
|---|---|---|---|
| US cenobamate revenue | ₩197.7bn | ₩224.4bn | +13.5% |
| US total prescriptions | not disclosed | about 143,000 | +8.4% (company) |
| Revenue per prescription | not published | not published | +4.7% (my calculation) |
| Best single month of scripts | not disclosed | 49,155 in June | highest month the company has published |
Contents
SK Biopharm stock, two growth figures, and the space between them
Where each number comes from
SK Biopharmaceuticals trades on the KOSPI, the main board of the Korea Exchange in Seoul, under code 326030. The KOSPI is the larger of Korea’s two boards; the KOSDAQ carries smaller and earlier-stage companies. This one sells one product of any commercial scale: cenobamate, an anti-seizure medicine marketed in the United States as XCOPRI, sold there by the company’s own American sales organization, with no licensing partner in between.
For the quarter ended Tuesday, June 30, 2026, the company reported US cenobamate revenue of ₩224.4bn and said US total prescriptions ran to roughly 143,000, up 8.4 percent over the March quarter. Both figures come from the company’s own results release of Wednesday, August 5, 2026, carried the same day by Korean trade outlets including TheBioNews. The company put June alone at 49,155 scripts, the highest monthly figure it has published. Revenue for the March quarter was ₩197.7bn on the same basis, so the revenue move works out to 13.5 percent by my calculation. Both figures cover the same three months and the same country, which is what makes them comparable at all.
Divide 1.135 by 1.084 and you land on 1.047. So each prescription in the June quarter carried roughly 4.7 percent more revenue than each prescription in the March quarter. That is a derived figure, mine, and it holds only if the two growth rates cover the same base. I have written it that way in the box above.
Why the 4.7 percent interests me more than the 13.5 percent
Three things it could be, and I cannot separate them
Revenue per prescription can move for reasons that behave very differently over time. Gross-to-net changes, where the discounts and rebates given to US payers shrink or grow, move it. Channel inventory moves it, since a wholesaler building stock records revenue the company has not yet seen dispensed. A shift toward higher-dose or longer-duration prescriptions moves it. A list-price increase moves it. Each of these has a different half-life, and the ones that come from inventory reverse.
None of that is speculation about the company’s honesty; it is the ordinary set of things that sits between a script count and a revenue line for any US-marketed drug. What I want is the split, and the split is what I do not have. Korean coverage of the August 5, 2026 results reported the revenue and the script count side by side without decomposing the gap between them, and I could not find the decomposition in the company’s own materials either.
There is one reason I would like the answer soon, and it has a clock attached. UCB’s brivaracetam lost its US compound patent in February 2026, and Money Today’s biotech desk has written that generic competition followed. When a cheap third-generation anti-seizure generic reaches formularies, the pressure it creates shows up in net price before it shows up in script counts. If the 4.7 percent is price, the same mechanism can take it back.
The quarter behind SK Biopharm stock, in consolidated numbers
Ten discrete quarters
| Quarter | Revenue | Operating profit | Net profit |
|---|---|---|---|
| Q1 2024 | 114.0 | 10.3 | 9.7 |
| Q2 2024 | 134.0 | 26.0 | 24.6 |
| Q3 2024 | 136.6 | 19.3 | 6.3 |
| Q4 2024 | 163.0 | 40.7 | 186.4 |
| Q1 2025 | 144.4 | 25.7 | 19.6 |
| Q2 2025 | 176.3 | 61.9 | 29.5 |
| Q3 2025 | 191.7 | 70.1 | 71.4 |
| Q4 2025 | 194.4 | 46.3 | 132.7 |
| Q1 2026 | 227.9 | 89.8 | 102.7 |
| Q2 2026 | 247.4 | 97.1 | 85.1 |
Figures are billions of Korean won, consolidated, and discrete for each quarter, taken from the company’s filings with Korea’s electronic disclosure system by subtracting each cumulative period from the one before it, and the three I cite by receipt number are the 2025 annual report (20260318000773), the first-quarter 2026 report (20260515001253) and the 2026 half-year report (20260814002274). The two fourth-quarter rows are computed by subtracting nine-month cumulative figures from the full year. Ten rows, three columns, one company, and every cell on the same accounting basis.
Nine adjacent comparisons sit inside that table. Revenue fell in exactly one of them, in the March quarter of 2025. Operating profit fell in three, and the three do not share a season: the September quarter of 2024, the March quarter of 2025, and the December quarter of 2025. Net profit fell in four, and it repeatedly moves opposite to the operating line. The December quarters of 2024 and 2025 both carry a net figure well above the operating figure for the same three months, roughly four and a half times in one case and under three in the other. I have not read the notes that would explain that, so I am recording the pattern while leaving the cause open.
For the first half of 2026 the consolidated numbers are revenue ₩475.3bn, operating profit ₩186.8bn, and net profit ₩187.8bn. Against the first half of 2025 (₩320.7bn, ₩87.6bn, ₩49.1bn) that is up about 48, 113, and 282 percent, computed on the unrounded filing figures behind this table. The June quarter alone carried a 39.24 percent operating margin.
Half-year US cenobamate revenue was ₩422.1bn. Converted at my one rate for this piece, that is roughly $306.5m. The company has guided to $550m to $580m of US cenobamate revenue for the full year 2026, so the first half covers somewhere between 52.8 and 55.7 percent of that range by my calculation. That is a guidance figure from the company, and I am keeping it labeled as such.
Where my data screen and the daily bars disagree on SK Biopharm stock
One field I stopped using, and one that reproduced
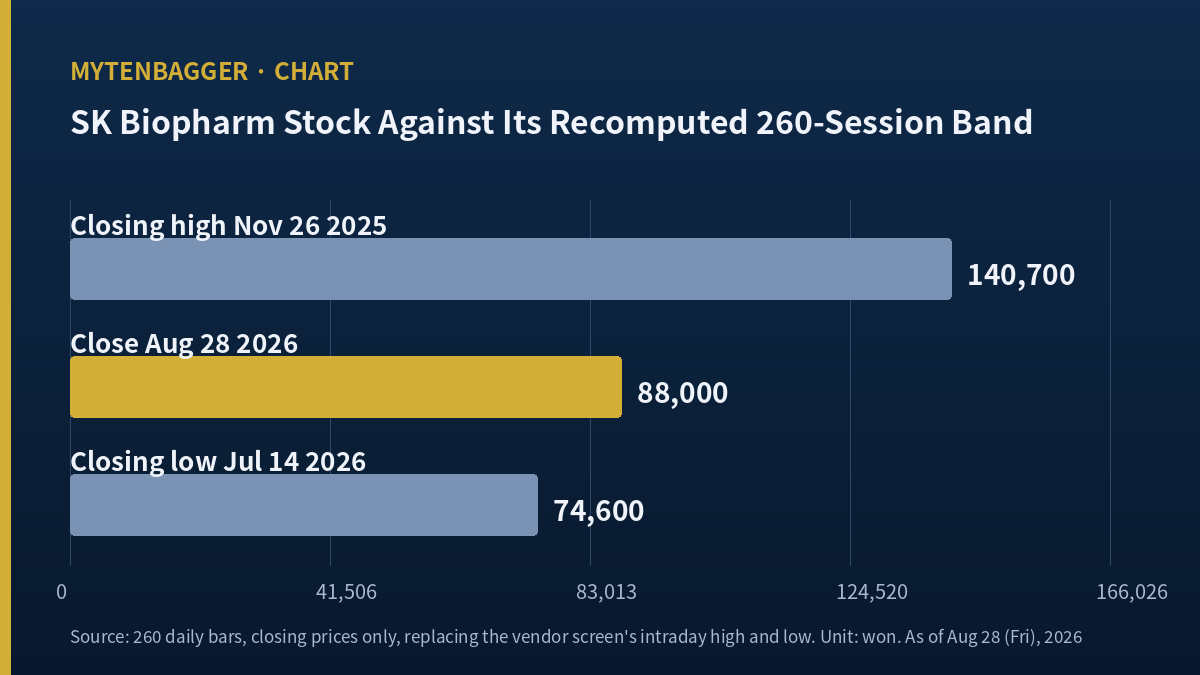
My Korean vendor screen prints a 250-day high of ₩144,100 and a low of ₩73,000 and states the basis as adjusted closing prices. Neither number appears as a close anywhere in the daily file I keep. Counting 260 bars by hand, the highest close was ₩140,700 on November 26, 2025 and the lowest was ₩74,600 on July 14, 2026, which puts the August 28, 2026 close of ₩88,000 about 37.5 percent below the high by my calculation against the screen’s 38.9. My window is 260 bars against the screen’s stated 250, so part of that gap is window length; the labeled basis is the part I can actually show. Six of those 260 rows also carry a close outside that day’s own high-low range, all six drawn from one source table inside the merged file. That is a caveat on my recount and not a footnote to it, since my extremes come from the same file. None of the six is a row I used for a high, a low or a window anchor, and I checked that before printing anything. The trailing-return fields on the same screen anchor to windows of 185, 367 and 92 days while carrying six-month, twelve-month and three-month names, so for the return sentences in this piece I have used my own recomputed values and not the screen’s.
One vendor field did reproduce cleanly, and knowing how it was built changed what I think it means. The screen shows a 39.3 percent return on equity. Dividing 2025 profit attributable to owners of the parent by the average of the 2024 and 2025 year-end equity attributable to owners gives 39.28 percent, which lands on the printed value. So that figure is an owners-basis return measured against average equity, which is a different thing from the year-end balance a reader might assume. Because that equity attributable to owners grew by more than a quarter across the first half of 2026, the same calculation on a current balance would land somewhere lower, and I have not attempted it here. It is the one field on that screen I would quote without rebuilding first.
One more thing sits in the daily file and I am not using it as evidence. The single largest one-day fall in those 260 bars was Wednesday, March 4, 2026, when the close went from ₩110,200 to ₩97,500. Its neighbor, Tuesday, March 3, fell 8.01 percent. The later of the two came five sessions ahead of the March 9, 2026 topline release for a competing Kv7 compound, and I am not joining those events into a chain.
What the sell side held this company up against
A peer table that opens with a company I did not choose
I am not carrying over a single valuation amount from any Korean broker in this piece. What I am taking from them is the comparison they chose, and the two inputs that comparison rests on. In an English-language note dated August 5, 2025, Mirae Asset Securities analysts Seung-min Kim and Se-eun Jo applied an EV/EBITDA of 27 times, described in the note as the 2019 to 2021 average for Vertex Pharmaceuticals, to the present value of 2028 estimated EBITDA at an 8.5 percent discount rate. So Vertex goes in the first row below, because someone pricing this company put it there. The rest of the rows are mine.
| Company | P/E | P/B | ROE | As of |
|---|---|---|---|---|
| Vertex Pharmaceuticals (VRTX), chosen by the broker | 31.53 | 6.78 | 23.54% | 2026-08-28 |
| UCB (EBR:UCB) | 19.24 | 3.56 | 20.57% | 2026-08-19 |
| Jazz Pharmaceuticals (JAZZ) | 16.71 | 3.30 | 22.11% | 2026-08-29 |
| Neurocrine Biosciences (NBIX) | 22.58 | 4.24 | 22.09% | 2026-08-30 |
| Alkermes (ALKS) | 122.81 | 4.53 | 3.85% | 2026-08-28 |
| Ono Pharmaceutical (TYO:4528) | 16.34 | 1.33 | 8.50% | 2026-07-17 |
| Supernus (SUPN) | loss-making | 2.47 | -10.49% | 2026-08-30 |
| Xenon Pharmaceuticals (XENE) | loss-making | 4.67 | -43.62% | 2026-08-28 |
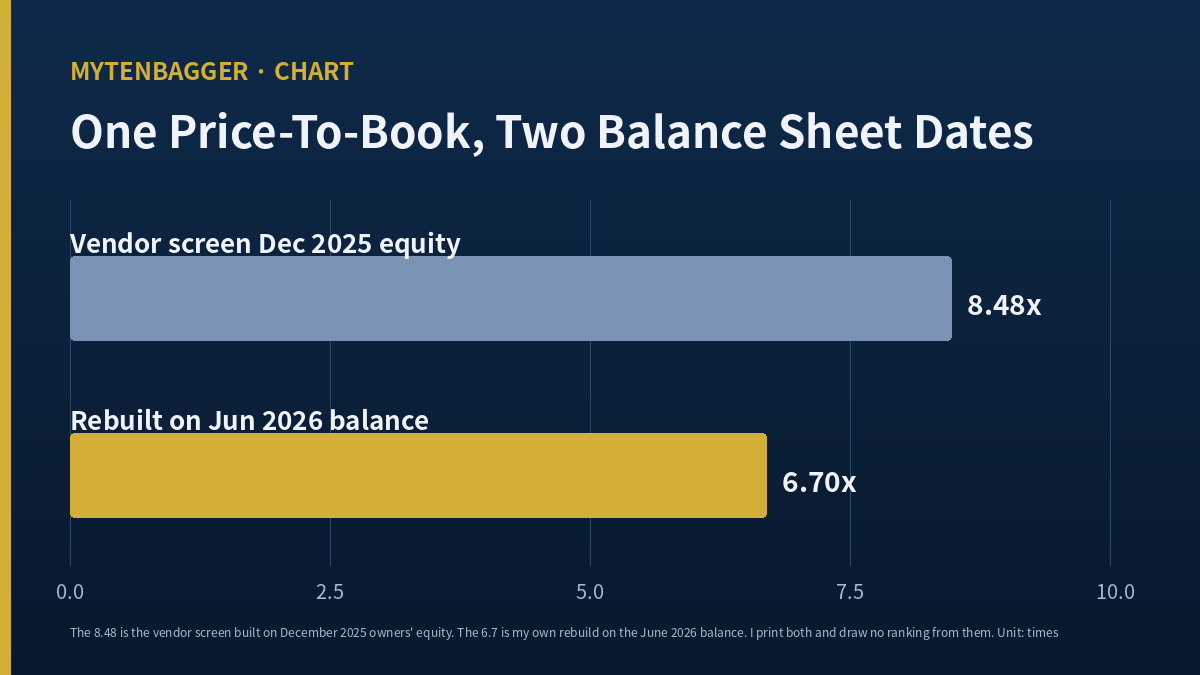
| SK Biopharmaceuticals (326030) | 25.82 (FY2025) | 8.48 (Dec 2025) | 39.3% | 2026-08-28 |
Eight peer rows and one row for the company itself. Six of the eight peers carry a trailing P/E and two do not, because both of those two ran a loss over the trailing period. The as-of dates on the peer rows run from July 17 to August 30, 2026, a spread of 44 days, and the Ono row is the oldest of them. All eight peer rows come from one US data provider. The bottom row does not: it comes from a Korean vendor screen, because that provider’s Korean listings have given me inconsistent snapshots before. I am not treating the bottom row as directly comparable to the eight above it, and the fiscal year-end column that would make some of these rows properly comparable is not published by that provider, so I left it blank and did not fill it from memory. The only cross-row reading I will take from this table is the range the peers occupy, and not where this company sits inside it.
That caution has teeth here. The bottom row prints a price-to-book of 8.48 on a screen that builds it from December 2025 equity attributable to owners. Rebuilt on the June 2026 balance, which grew by more than a quarter across the half, the same ratio comes out near 6.7 by my calculation, and 6.7 sits inside the range those eight rows occupy while 8.48 sits above it. I cannot say which of the two belongs beside the peer column, so I am printing both and drawing no ranking from it. The return-on-equity column has the same problem in reverse: the bottom row’s 39.3 percent is an owners-basis figure measured against average equity, and the eight rows above it come from a provider that does not tell me how it builds the same field.
Reaching SK Biopharm stock from a US account
Three routes, and what each one leaves out
Here is the part of this company that I find genuinely odd from an American desk. Nearly all of the revenue in this piece was earned in the United States, from prescriptions written by US physicians and paid by US payers. The shares that carry the economics of those prescriptions are not listed on a US exchange as far as I could establish. I looked for an American depositary receipt or an over-the-counter line and did not find one; that is a search that came up empty, and I am not calling it proof of absence.
The index route does not close the gap either.
Which leaves the Seoul listing itself, through a broker with Korea Exchange access. Access notes usually end the same way in this journal. This one does not, because here the access gap and the revenue geography run in opposite directions.
Six ways I could be wrong about SK Biopharm stock
1. The 4.7 percent could be inventory. If wholesalers built stock in the June quarter, some of that revenue reverses in the September quarter and my whole framing inverts.
2. The US compound patent on cenobamate runs to October 2032, and a patent suit against India’s MSN Laboratories was settled on Wednesday, August 19, 2026. What was disclosed is that the settlement gives the other side a route to launch a generic version; the date and the remaining terms were not disclosed, according to Korea Biomedical Review.
3. A competing Kv7 activator, Xenon’s azetukalner, reported positive Phase 3 topline results on Monday, March 9, 2026, in a trial that Korean coverage has repeatedly described as enrolling a large share of participants already taking cenobamate. Xenon’s own release is the primary document for the trial result; the enrollment detail I have only from that Korean coverage. Korean coverage after the June-quarter beat framed competitive worry as one reading of why the shares did not respond; Hankyung carried that reading from Kiwoom Securities analyst Heo Hye-min on August 6, 2026. I am recording it as a reading and not as a cause.
4. The second product this company just bought is not de-risked. On Wednesday, August 26, 2026 it licensed an epilepsy candidate from Biohaven, with an upfront component that is large against a single year of this company’s operating profit and payable in two parts, at signing and a year later. Korean pharmaceutical trade press has written that the confirmatory trial reads out later in 2026, that the widely quoted response rate comes from an open-label extension and not from a controlled study, and that the molecule missed primary endpoints in other indications; Korean Pharmaceutical Association News laid out that case.
5. I do not know how that upfront payment is being recognized. Expensed, and the profit trend the table above ends on does not carry into the second half. Capitalized, and it does. Either way I cannot extend that trend past June 2026, and I am not going to.
6. The valuation is demanding on the vendor screen’s own figures. A price-to-earnings near 26 on a fiscal-2025 basis and a price-to-book near 8.5 on a December 2025 balance are both well above the thresholds I apply when I look at any other pharmaceutical name, and good results do not by themselves keep a multiple where it is. I could not obtain a Korean pharmaceutical sector average to place these against, so I am not making that comparison.
My position in SK Biopharm stock and the condition that breaks this entry
What I am doing, and why it is nothing
I own none of this and I have no order working. I am watching. The revenue growth is real and the operating margin is high, and the June 2026 quarter alone carried a 39.24 percent operating margin against 28.85 percent for the 2025 fiscal year on the same vendor screen, which I do not take lightly. What stops me is narrower than the whole thesis: I have two growth figures for the same quarter and I cannot say which part of the faster one is durable.
The condition that breaks this entry is a piece of information. No price level does it. When I can find, in a company filing instead of a press summary, how US cenobamate revenue growth divides between prescription volume and net price per prescription, this note gets rewritten. If most of the 4.7 percent turns out to be volume mix that compounds, the case gets stronger than I have written it. If it is gross-to-net or channel stocking, the 13.5 percent I opened with is the wrong figure to have anchored on and the 8.4 percent was the honest one all along. I have put that sentence here so that a later version of me cannot pretend the test was something else.
I have written this kind of entry before from the opposite side. When record earnings landed on a 52-week low I bought without waiting, and that Celltrion note says so. When a single contract term put a lid on a leader’s economics I said the lid was the whole story, in the Alteogen entry. And I have looked at a Korean pharmaceutical company whose best-selling product it did not own, which is the Chong Kun Dang case. This one differs from all three. Here the company owns the molecule outright and the numbers are good; what I lack is a decomposition.
How to read the dates and currency in this entry
Prices and multiples here were checked at the time of writing against the close of August 28, 2026, the last trading session before I sat down on the morning of Monday, August 31, 2026 in Seoul; August 29 and 30 were a weekend. Publication comes later than writing, so the figures below can differ from live quotes. Korean won is the base currency of this entry, and every dollar figure I converted uses one approximate rate, roughly ₩1,377.3 per dollar on August 28, 2026, taken from Investing.com and used as a single figure throughout. Where another party published its own conversion, I left that party’s figure alone instead of recomputing it. Company financials are consolidated and come from regulatory filings; the vendor screen values are a Korean brokerage feed refreshed on August 28, 2026; the peer table comes from a US provider with the as-of date printed in its own column. Where a table mixes them I have said so in the note beneath it, because they do not share a moment.
Related entries in this journal on Korean pharmaceutical names, for readers who want the wider set: I looked at how license revenue and recurring royalty split for another Korean drugmaker in the Yuhan entry, which is the closest structural cousin to the question this piece leaves open.
I ran the same cash question on another Korean healthcare name. Lunit has burned more cash than it has ever booked in revenue, which puts a narrowing loss in a different light than a widening one.