Korea Petrochemical Stock Against One Line: 63% of Assets
- Against the September 18 price, the whole company costs 641.55 billion won, a figure I built by multiplying 6,500,000 shares by the close.
- Inside the June 30 balance sheet, current assets alone came to 1,010.25 billion won. My division of the first by the second gives 63.5041 percent.
- Beyond both numbers, I could not confirm what the company owes against those assets in commitments I never saw, so I own none of this and placed no order.
Contents
Two dates, and why I put Korea Petrochemical stock between them
June 30, 2026 is a balance sheet date. September 18, 2026 is a price date. Eighty days separate them, and almost every comparison I am about to make crosses that gap. I want that admitted in the first paragraph instead of buried in a footnote, because the whole piece rests on setting one date’s stock of assets against another date’s stock of price.
On the second of those dates, Korea Petrochemical stock closed at 98,700 won. There are 6,500,000 shares, so I multiplied and got 641.55 billion won for the entire company. On the first of those dates, the company’s own balance sheet showed current assets of 1,010.25 billion won. I divided one by the other. The answer is 63.5041 percent.
That is the article. Everything after this paragraph is me checking whether the division means anything, and listing the places where it might not. I should say plainly that I find the number arresting and that finding a number arresting is exactly when I start making mistakes, which is why the objection list below runs to twenty one items and the conviction section runs to one paragraph.
What the June 30 balance sheet says beneath Korea Petrochemical stock
The lines I used, in billions of won, are these. Total assets 2,888.96. Current assets 1,010.25. Cash and cash equivalents 302.68. Property, plant and equipment 1,636.11. Total liabilities 758.17, of which current liabilities are 512.82 and short-term borrowings are 148.23. Total equity 2,130.78, of which 1,876.12 belongs to the controlling shareholders.
The six divisions I printed and the two I lean on
From those lines I made six divisions and printed all six. Current assets are 1.5747 times the market value I built. Current assets minus every liability the company carries leaves 252.08 billion won, which is 39.2923 percent of that market value. Cash alone is 47.1795 percent of it. Property, plant and equipment is 2.5502 times it. Market value over total equity is 0.3011, and over controlling equity 0.3420. Alongside those, the current ratio works out at 196.9989 percent and total liabilities over total equity at 35.5818 percent.
Two of those carry weight for me and four are context. The second one says that if you took the current assets, settled every liability the company carries including the long-dated ones, and dissolved what remained, the residual would still be a meaningful fraction of what the shares cost. The third says that the cash line by itself covers close to half the price of the company. I am not claiming either outcome is available to anyone. I am saying the arithmetic sits there and I can do it from published numbers, which is more than I can say about most of what I would need to value this business properly.
The current ratio invites a caution instead of applause. Just under two hundred percent sounds comfortable, and in a business whose inventory is priced off a feedstock that moves week to week, a comfortable current ratio can shrink without anybody doing anything wrong. That is a property of what sits inside that total, and I did not break the current asset total into its components beyond the cash line, so I cannot tell you how much of the 1,010.25 is inventory carried at a cost that has since moved.
The cash line doubled and one line beside it emptied
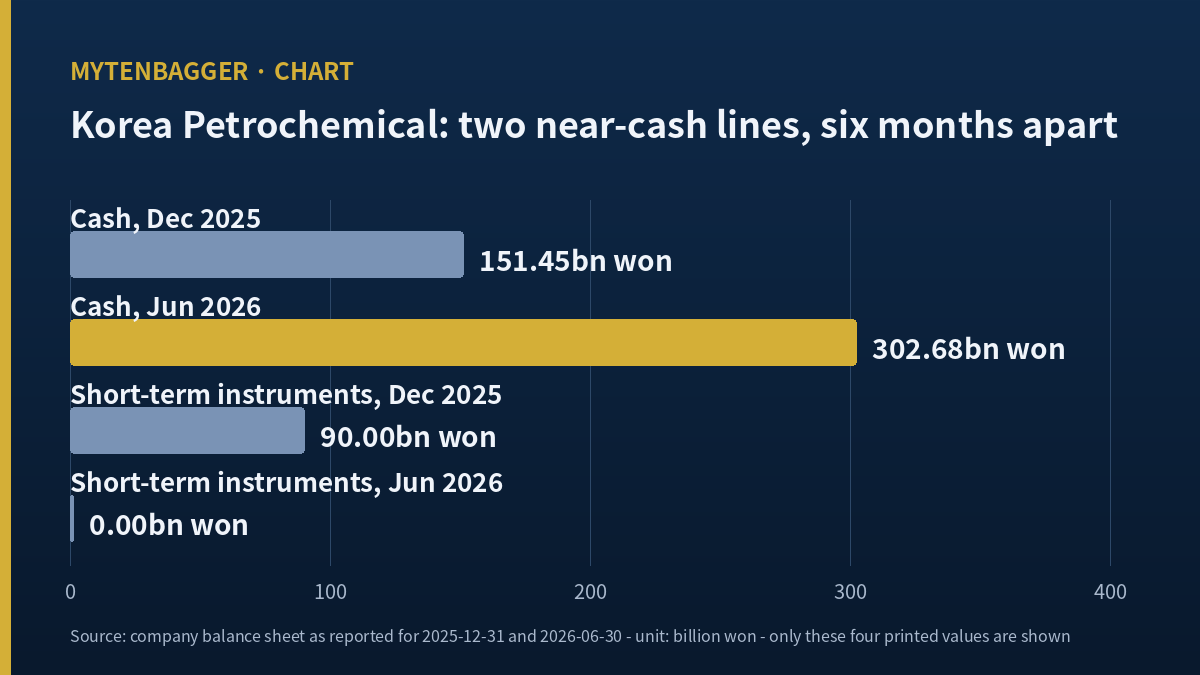
Six months earlier, at the end of December 2025, cash and cash equivalents were 151.45 billion won. By June 30 they were 302.68 billion won, an increase of 99.8547 percent. Doubling a cash position in two quarters is the kind of thing that makes me sit up, so I looked at what sat next to it.
Short-term financial instruments were 90.00 billion won at the end of December and 0.00 at the end of June. Taken together, cash plus short-term instruments went from 241.45 billion won to 302.68 billion won, a rise of 25.3593 percent. So a large part of what looks like a doubling is a move from one near-cash line into another. I would not have caught that if I had read only the headline cash figure, and I nearly did read only the headline cash figure.
Over the same six months property, plant and equipment fell 1.7564 percent while total assets rose 6.9858 percent. A company whose fixed asset base contracts slightly while its total balance sheet grows is, on the face of it, putting the growth somewhere other than into plant. Where exactly, I did not determine. The notes would say and I did not open them.
Why I trust these lines more than the ones above them
One cross-check passed and one did not
I take balance sheet data seriously only after testing it against a second source, and this time the test split. An overseas data service and a Korean balance sheet screen agree to the won on total assets, total liabilities and total equity for the December 2025 year end. They disagree on property, plant and equipment. Going up to the income statement, they agree to the won on revenue and disagree on the operating result.
That pattern matters more to me than either number. A table where some rows reconcile exactly and others do not is a table I cannot use wholesale, because the rows that reconcile give me false confidence about the rows that do not. So I took every ratio in this piece from the Korean screen, which carries the June 30 column the overseas service does not have yet, and I have not used any operating profit figure from the overseas source anywhere in this piece.
There is a cost to that decision and I want it visible. I could have built a five year table of operating results and margins, which would have made this a longer and more conventional article. I did not build it. A table with one row I know to be constructed differently is a table that misleads the person reading it, and the person reading it first is me.
What survives the cut is the cash position, and holding cash is a choice with two obvious alternatives. I have written about both. For what a company does when it needs cash it does not have, there is a Korean materials maker that raised a fraction of what it had consumed. For the opposite, a refiner committing an enormous sum to a unit that was losing money, there is my account of that decision. This company has taken neither road so far, and the taking of neither is itself the observation.
The treasury stake I inferred and could not confirm
The treasury stake is where I got ahead of my evidence. Dividing reported equity by the per share book values on two different screens produced two different share counts, 6,500,000 and 6,176,000, and the 324,000 share gap is almost exactly the size a treasury holding would be. I wrote that down as a finding, then recognized that I had turned a subtraction into a claim about the share register without ever opening a document that says so.
So I backed it out. None of the six ratios above divides by 6,176,000. All of them use 6,500,000, which appears on three separate screens as the listed share count. The correction I am writing down for myself: when two share counts disagree, the arithmetic can tell me that a gap exists, and it can never tell me what the gap is made of. That second question needs a document, and a calculator will happily answer it wrongly if I let it.
A peer whose sign I used and whose amounts I did not
My peer this time is LyondellBasell Industries (NYSE: LYB), and I picked it on a narrow basis: it runs the same category of cracker and reports in a different currency, so its accounting sits outside the Korean framework I have been checking. For a company whose scale, product mix and customer geography all differ, that is the only axis on which I wanted a comparison at all.
Having picked it, I then declined to print a single amount from it. What I take is the sign. In its 2025 fiscal year that company’s operating line was positive while its bottom line was negative. The company I am writing about had both positive in the same year and both negative in its most recent quarter. Three arrangements of two signs, across two currencies, in one industry, over roughly the same stretch of a cycle.
The reason I stopped at signs is the cross-check that failed two sections ago. The operating result on my company came out differently on the overseas service than on Korean sources, and the peer’s figures come from that same overseas service. If I cannot verify how the line is built for a company whose Korean disclosures I can read, I have no business quoting the same line for a company whose disclosures I have not read at all. A sign survives that objection because a sign is robust to a definitional difference of a few percent. An amount is not.
What the three arrangements tell me is modest and I will not inflate it. They tell me that in this industry, in this window, the distance between an operating line and a bottom line is large enough and variable enough that neither one predicts the other. That is a reason to look at a balance sheet, which is roughly how I ended up writing this particular article instead of the one I set out to write.
I have handled peer sets the opposite way before, laying nine names in one table and watching a single row move the middle, which I wrote up in a piece on how one row swings a nine name median. This is the far end of the same problem, and I am not sure which end is more honest.
What the sell side put on Korea Petrochemical stock
On July 20, 2026 an analyst at DB Financial Investment kept a buy rating and cut the valuation he attaches to the shares to 180,000 won, down from 270,000 won on April 30. The average across houses covering the name stood at 194,167 won on that date. Earlier in the year the published valuations ran from 180,000 to 220,000 won, with one house at neutral.
Two things about that set are worth holding onto. The first is that a rating and a number moved in opposite directions on the same day from the same desk, which happens often enough but still means two signals disagree. The second is that the same note put the second quarter operating result at a small loss, and the company subsequently disclosed a loss several times that size. Being directionally right and materially wrong in one sentence is an ordinary outcome for quarterly modeling, and it is also a reason to avoid leaning on any single forward figure.
I have not read any of those notes in the original. Everything in this section comes through secondary coverage, and I would rather say so than present it as though I had the documents in hand. It also means the coverage I am describing is two months old at the time I am writing, and two months is long enough in this industry for a view to have changed without my hearing about it.
Twenty one objections to what I just wrote about Korea Petrochemical stock
- The assets are dated June 30 and the price is dated September 18. Eighty days of events sit between them.
- A current asset that cannot be turned into cash at book value is worth less than book value.
- Inventory in a petrochemical business is priced off feedstock, and feedstock prices move.
- I did not break current assets into their components beyond the cash line.
- Receivables quality is unexamined.
- Total liabilities include items whose timing I did not look at.
- The residual after subtracting liabilities is an arithmetic result and carries no liquidation claim.
- Property, plant and equipment at book value says nothing about what a cracker would fetch.
- Korean chemical capacity is under discussion for reduction, which cuts against asset values.
- Press coverage in June reported that this company had not moved decisively in those discussions.
- An ethylene spread well under the level the industry treats as breakeven was reported for mid June.
- The company draws its main feedstock from a nearby refiner, and I do not know those contract terms.
- One assessment in June noted the company’s financial safety score has been sliding since 2021.
- A balance sheet can stay cheap for years without anything forcing a revaluation.
- Book value is a historical cost record in most of these lines.
- I did not open the equity composition note.
- I did not open the fixed asset note, so impairment history is unknown to me.
- The move I found between two near-cash lines may have an explanation I did not seek.
- Two data sources disagreed on one asset line and I used the one I judged closer to the source.
- The share count is consistent across screens and I never opened the register.
- A company can hold a large cash position because it expects to need it.
Where I stand on Korea Petrochemical stock, and what would move me
I hold none of it. I placed no order while writing this and I have none resting. By my own rule a company this far down the Korean market by value sits in the watch column, and nothing in the ratios above changes that, because a low ratio of price to assets is a starting question and never an answer.
What I find genuinely interesting is narrower than the headline. The cash line doubled, a near-cash line beside it emptied, and the fixed asset base contracted slightly while total assets grew. Those three movements happened in the same two quarters and they point in different directions. I would like to know why before I decide anything, and the honest version of my position is that I am waiting on a document and not on a price.
How I see the next two quarters splitting
These are my own weightings and nobody else’s, and I put them in writing so that I can be held to them later. The path I consider most likely, at around 44 percent, is that the balance sheet stays roughly where it is: cash somewhere near the June level, fixed assets flat to slightly lower, and the ratio I built moving mostly because the price moves while the assets stay where they are. In that world the arithmetic in this piece stays true and stays uninteresting.
At around 34 percent I see the assets themselves moving in a way that closes the gap from the wrong end. Inventory written down toward a lower feedstock price, receivables slower, current assets falling while liabilities hold. The ratio improves for the shareholder in appearance and worsens in substance, and the residual I computed narrows.
The remaining 22 percent splits into two tails. About 16 percent of it is a capacity outcome, where the reduction talks reach a conclusion that assigns a value to plant nobody is currently paying for, and the comparison I refused to build becomes the one that matters. The last 6 percent is the reverse: a decision to commit the cash into new plant at the bottom of a cycle, which would convert the line I leaned on into the line I said tells you nothing.
- 449. If the third quarter balance sheet shows cash below the June level with no corresponding rise beside it, the doubling was working capital timing and I read it wrong.
- 450. If short-term financial instruments reappear at a similar size, the June reading was a classification effect and the combined figure is the one to track.
- 451. If property, plant and equipment resumes rising, the story stops being about a balance sheet standing still.
- 452. If total liabilities grow faster than current assets for two consecutive quarters, the residual I computed narrows and the central ratio loses its point.
- 453. If the equity composition note explains the minority interest that appeared during 2025, the bottom of two of my six divisions changes.
- 454. If 450 and 453 are answered in the same report, I will have to rebuild the whole comparison instead of adjusting it.
The hypothesis I dropped last
I started this piece intending to write about how much plant the market was getting for free. Property, plant and equipment is 2.5502 times the market value, and that is a striking sentence to build an article around. I kept it until quite late and then let it go, for a reason I want on the record.
Fixed assets in a business like this are worth what they can earn, and the most recent quarter says what they earned was less than nothing. Current assets do not carry that problem to the same degree, because cash is cash whatever a spread does. So the ratio I could most safely stand on was the one against current assets, and the more dramatic ratio is the one I had to set down. I have printed both, and I want the distance between them visible instead of tidied away.
There is a second thing I set down, quieter than the first. I wanted to say that the market is handing you the plant for nothing and charging you only for the working capital, which is the sort of line that travels well and survives scrutiny badly. It survives badly because the subtraction it implies, market value minus current assets, produces a negative number, and a negative number is not a price anybody is quoting for a cracker.
One document answers half of the six conditions above: the third quarter report, due under Korean law by November 16, 2026. Until it arrives I am reading a balance sheet dated June 30 and a price dated September 18, and pretending they belong to one moment would be the easiest mistake available to me here.
Prices reflect the September 18, 2026 close of 98,700 won. Market capitalization is my own multiplication of that close by 6,500,000 shares and is approximate at the rounding shown. Dollar figures use 1,383.3 won per dollar, the Seoul market close on the same date: roughly 463.78 million dollars of market value, 730.32 million dollars of current assets, 218.81 million dollars of cash, and a share price of about 71.35 dollars. Balance sheet figures are as reported at June 30, 2026 and December 31, 2025.
Sources: year by year balance sheet summary · second quarter results disclosure · brokerage note summary of July 20, 2026 · financial safety assessment and feedstock supply structure · ethylene spread and capacity reduction talks · LyondellBasell income statement · daily price history · Seoul foreign exchange close