Hyosung TNC Stock and a Nine-Name Table One Row Can Swing
Contents
Nine fiber makers, one sheet, and where Hyosung TNC stock lands
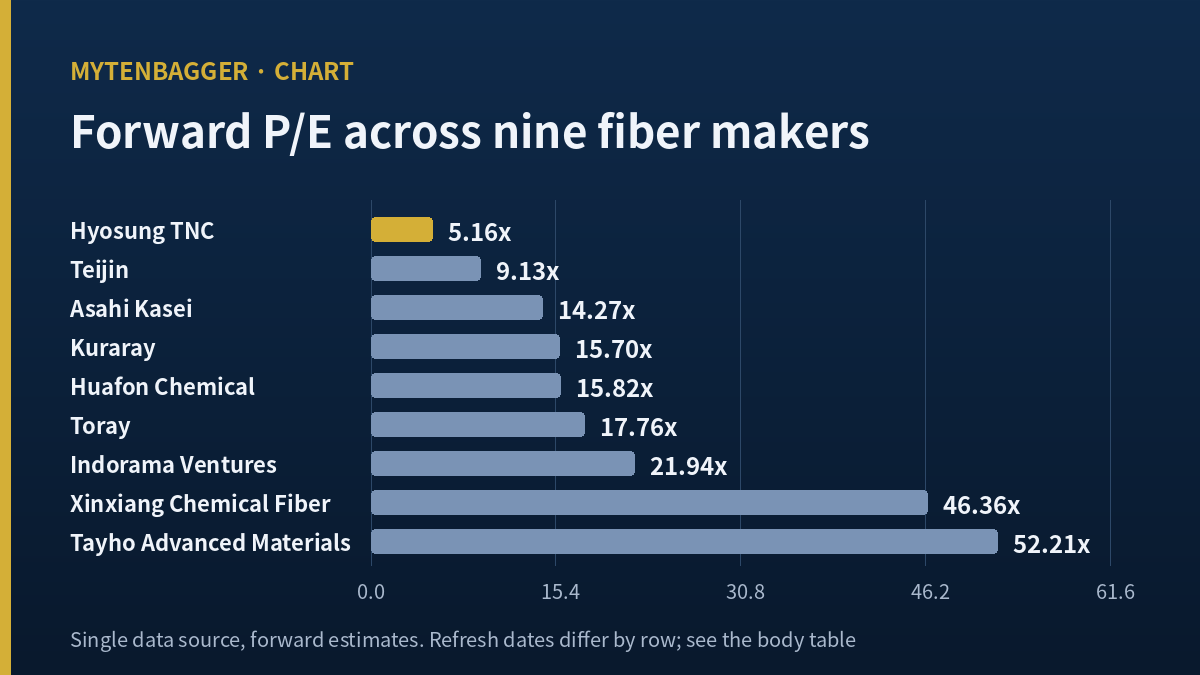
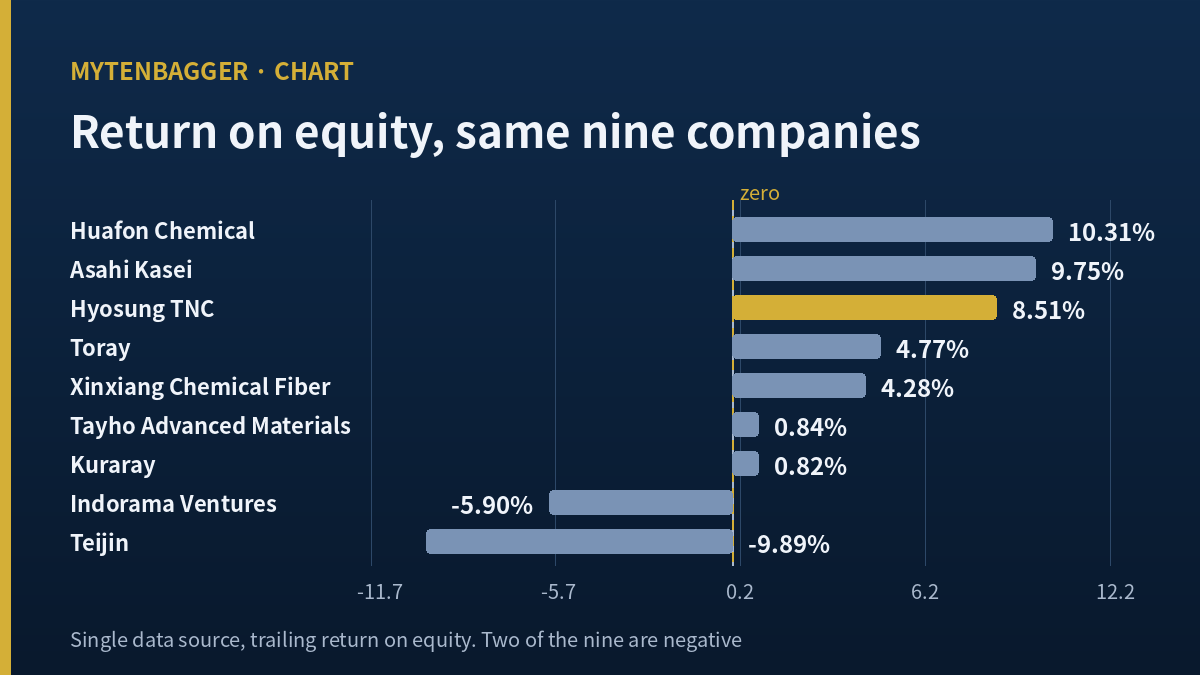
I built a table of nine fiber and spandex producers to see whether Hyosung TNC stock was cheap or merely small. The answer that came back was narrower than the question. On forward earnings estimates it carries the lowest multiple on the sheet, 5.16 times. On return on equity it posts 8.51 percent, and only two of the nine companies beat that. Those two facts usually do not sit in the same row.
Then I did something I had not planned. I pulled Hyosung TNC out of my own table and recalculated the group middle. With nine companies the median forward P/E is 15.82. With eight, after the cheapest member comes out, it is 16.79. One row moved the middle by 0.97, which is 6.13 percent of it by my calculation. When I put Reliance Industries back as a tenth name the median landed on 16.79 as well, from the opposite direction. A group middle that any single row can swing that far is not something I can value a company against, and that is the honest summary of what a nine-name sheet buys you.
| Company | Forward P/E | Return on equity | As of |
|---|---|---|---|
| Hyosung TNC (KRX: 298020) | 5.16 | 8.51% | Aug 22, 2026 |
| Teijin (TYO: 3401) | 9.13 | -9.89% | Aug 16, 2026 |
| Asahi Kasei (TYO: 3407) | 14.27 | 9.75% | Aug 16, 2026 |
| Kuraray (TYO: 3405) | 15.70 | 0.82% | Aug 17, 2026 |
| Huafon Chemical (SHE: 002064) | 15.82 | 10.31% | Aug 31, 2026 |
What KOSPI means for a reader outside Korea
KOSPI is the main board of the Korea Exchange in Seoul, the venue that lists the country’s large industrial and financial companies, with a separate junior board called KOSDAQ underneath it. Hyosung TNC trades on the main board. Korean listings quote in won, settle on a T+2 basis, and are closed to foreign retail brokers unless the account is set up for direct market access.
The price and the date I am working from
Every figure I calculate myself uses the close of Monday, August 31, 2026, at 355,500 won. I am writing before the Tuesday session opens, so the prior trading day is the last observation available to me. Market capitalization at that close is 1.5385 trillion won on 4,327,707 shares outstanding, which works out to roughly 1.12 billion US dollars at about 1,368.6 won per dollar, the Seoul market close on the same date. Korean won is the reference currency throughout, and the dollar figure is a rounded convenience.
The full nine, and why I let a stale row stay
One source for every cell
All nine rows come from the same statistics pages at stockanalysis.com, because mixing providers is how a peer sheet stops meaning anything. Korean sell-side coverage and Korean press supplied the operating background further down, and where they did I say so. The cost of the single-source rule is that each row carries whatever date stockanalysis.com last refreshed it, and those dates are not the same. One more limit belongs here: I did not confirm which fiscal period sits behind the forward column on each page, and for companies on different reporting calendars that column may not be measuring the same twelve months across every row.
| Company | Trailing P/E | Forward P/E | P/B | ROE | As of |
|---|---|---|---|---|---|
| Hyosung TNC | 11.90 | 5.16 | 0.61 | 8.51% | Aug 22 |
| Teijin | n/a | 9.13 | 0.81 | -9.89% | Aug 16 |
| Asahi Kasei | 11.97 | 14.27 | 1.04 | 9.75% | Aug 16 |
| Kuraray | 75.30 | 15.70 | 0.74 | 0.82% | Aug 17 |
| Huafon Chemical | 20.88 | 15.82 | 2.05 | 10.31% | Aug 31 |
| Toray Industries | 22.00 | 17.76 | 0.88 | 4.77% | Jul 29 |
| Indorama Ventures | n/a | 21.94 | 0.90 | -5.90% | Jul 30 |
| Xinxiang Chemical Fiber | 37.56 | 46.36 | 1.58 | 4.28% | Jun 21 |
| Tayho Advanced Materials | 156.86 | 52.21 | 1.37 | 0.84% | Aug 31 |
All dates are 2026. Teijin and Indorama Ventures show no trailing P/E because both carry negative returns on equity on the same pages. Their forward figures assume a move back to profit, which is a different kind of number from the others in that column.
The oldest row is two months behind
Xinxiang Chemical Fiber was last refreshed on June 21, seventy-one days before the close I am using. I kept it in and flagged it, because dropping a company for being stale changes the group median, and I would then be reporting a median I had shaped by hand. Toray at July 29 and Indorama at July 30 are also older than a month. The two Chinese rows dated August 31 are the only ones that share my own price date.
Correcting my own row makes the finding stronger
The Hyosung TNC row is dated August 22, eight sessions before the close I quote everywhere else. On that date the page showed a market value near 1.34 trillion won, which implies a price around 309,600 won against the 355,500 won I am using. Scaling the three multiples by that 1.148 price ratio gives a forward P/E near 5.92, a P/B near 0.70 and a trailing P/E near 13.66.
I checked the scaled trailing figure against my own arithmetic. Adding the four reported quarters through June 2026 gives controlling net income of 112.545 billion won, and 1.5385 trillion divided by that is 13.67. The two agree to within a hundredth, which tells me the scaling is sound. And the point survives it: at 5.92 the corrected forward figure is still the cheapest on the sheet, with the next one up at 9.13.
Two names I left off the sheet
Reliance Industries had complete cells and I still left it out. stockanalysis.com shows it at a trailing 21.16, a forward 19.82, a P/B of 1.57 and a return on equity of 9.14 percent, dated June 9, 2026. My reason was business mix: a refining, petrochemical and telecom group is not a fiber comparison, whatever its polyester volumes. Adding it back would push the group median forward figure from 15.82 to 16.79, which is the same landing point I get by removing Hyosung TNC instead. A reader who disagrees with my exclusion can see exactly what it bought me and reverse it.
The second omission was involuntary. No aggregated Korean consensus service was reachable in this research, so the sheet carries no domestic Korean estimate compilation at all. What I have instead is three individual houses, quoted separately further down, and a foreign compilation drawn from three contributing analysts. Neither of those is the Korean consensus a Seoul desk would quote, and I do not call either one that.
What the operating year looks like behind Hyosung TNC stock
A recovering first half, reported by Korean press
The company posted second quarter revenue up 27.9 percent and operating profit up 157.5 percent against the same quarter a year earlier, with the textile segment carrying an operating margin of 17.0 percent, as SAT Economy reported on August 27, 2026. Those are Korean press figures drawn from the company’s own filing, translated here for an English reader. The half-year filing landed on August 13, 2026, and the preliminary release came ahead of it on July 31.
Where the share price has been
Against the August 31, 2026 close, the stock is up 19.10 percent over twenty-one trading sessions from 298,500 won on July 30, and up 57.30 percent over two hundred fifty-two sessions from 226,000 won on August 18, 2025. Its twenty-session average sits at 329,100 won and its sixty-session average at 309,958 won, both below the current price, while the hundred-twenty-session average of 368,512 won is above it. A stock trading above its short averages and below its long one is in the middle of an unfinished argument.
China price cycle in dated observations
Spandex pricing is set in China, so I want the Chinese numbers with their dates attached. In early April 2026 the domestic Chinese price stood at 26,500 yuan per tonne, up roughly 15 percent from the start of that year, with the processing spread up about 17 percent, according to Shinhan analyst Lee Jin-myung as reported by BizTribune on April 6, 2026. Supply was tightening from the other side over the same stretch: AlchemPro put 2025 closures of older Chinese lines at roughly 80,000 to 90,000 tonnes, with a further 50,000 tonnes or more slated to shut during 2026.
What I do not have is a Chinese price observation from June 2026 onward. The most recent characterization I could source is qualitative, an expected seasonal decline in the second half, and I will not convert a direction into a number. So the pricing evidence behind the first-half recovery is firm through April and thin after it.
What the interim balance sheet says about inventory
Inventory stood at 898.345 billion won on June 30, 2026, against 792.342 billion won at the end of 2025, an increase of 13.38 percent by my calculation. Measured against single-quarter revenue that is 33.8 days of stock, down from 39.1 days at the December 2025 balance date. For a yarn producer in a rising price environment, inventory growing more slowly than sales is the reading I would want, and that is what these two figures show. Both come from the company regulatory filings and not from the peer data source.
Korean sell-side, quoted for inputs and never averaged
Three named Korean houses published 2026 operating profit estimates during 2026, and I use those estimates as raw inputs while leaving each firm’s own valuation conclusion alone. Hana Securities analysts Yoon Jae-sung and Kim Hyung-jun raised 2026 to 529.3 billion won and 2027 to 632.5 billion won in a July 20, 2026 note reported by SisaJournal-e, then carried 2026 to 589.4 billion won on August 3. Shinhan Securities moved from 407.5 billion in April to 596.3 billion later that month and back to 520.0 billion by June 2. NH Investment Securities analyst Choi Young-kwang cut the firm’s 2026 estimate by 10.6 percent on June 18, citing an expected second-half decline in spandex prices.
I did not average those three. No aggregated Korean consensus was reachable in this research, and building a mean out of three houses would amount to manufacturing a consensus that does not exist. The spread itself is the information: the high 2026 figure is 1.58 times the low one. When named professionals disagree that widely about the same twelve months, no single one of their numbers can anchor my view.
What the balance sheet flags look like on the same page
The risk cells stockanalysis.com carries for Hyosung TNC, dated August 22, 2026, read debt to equity 1.08, current ratio 0.84, enterprise value to EBITDA 5.68 and an Altman Z-score of 1.83, with the page noting that scores under 3 point to elevated bankruptcy risk. I treat the Z-score as a screening flag and nothing more, since it was calibrated on US manufacturers decades ago and travels badly to a Korean chemical group. Still, a current ratio under 1 belongs in the same paragraph as a cheap forward earnings figure. Korean filings put the group liabilities at roughly 1.9 times equity as of June 2026, which is the same story told on a different scale.
The case against my own Hyosung TNC stock table
Six things weigh against the reading above, and I put them in the order in which they would actually break it.
One. The nine-name group is not a set of like companies. Toray, Asahi Kasei, Kuraray and Indorama Ventures are diversified materials groups where fiber is one business among several, so a gap in multiples may be describing breadth of business where I read cheapness.
Two. The forward column is the market accepting somebody’s forecast, and for Teijin and Indorama that forecast is a return to profit from a loss. A low figure built on a recovery assumption is not the same object as a low figure built on trailing earnings.
Three. Chinese capacity sets the price, and this company does not sit at the top of it. AlchemPro reported on July 31, 2026 that China held roughly 1.2 million tonnes of spandex capacity at the end of 2025, with the top five producers accounting for about 60 percent of it, and Huafon larger inside China than the Korean group’s local operation.
Four. The recovery is not exclusive. Huafon Chemical reported first-half 2026 net profit up 101.64 percent year on year on stronger sales and margin recovery, according to a summary of its interim filing, and its capacity additions completed during the same stretch.
Five. One prop under the early-2026 rally has already been removed. The Lycra Company filed for Chapter 11 on March 18, 2026 to cut about 1.2 billion dollars of debt, and NH noted in June that the completed restructuring was the reason it stripped out the valuation premium it had been applying.
Six. The most exposed piece of my own reasoning is the median exercise itself. A middle built on nine observations, four of them refreshed more than a month away from the price I use, is a rough statistic, and I showed above that pulling one row swings it by 0.97. A week of price action on two of the stale rows could move it again by a similar amount and in either direction. I would not build a position on a middle that loose. I built a question on it.
Figures I checked and then left out
Four numbers made it into my working file and not into the argument. The dividend yield of 3.13 percent shown on that same statistics page is calculated on its own August 22 price, so it does not belong beside a market value I take from August 31. Enterprise value to EBITDA of 5.68 carries the same date problem plus a depreciation input I could not verify separately. A three-year revenue growth rate is reproducible from the filings but starts in the group largest revenue year, so its sign depends entirely on where the window opens. And I could not retrieve a credit rating from any of the three Korean agencies, which means the debt discussion above has no external assessment standing behind it.
Listing them is not throat-clearing. Each of the four would have made the case look sharper in one direction or another, and the reason none of them is in the argument is that I could not put a date and a basis on all three parts of each one.
Reaching Hyosung TNC stock from a US account
There is no American depositary receipt for this company.
What a Korea fund would and would not give you
That gap matters more here than it does for a semiconductor or shipbuilding name. American investors get indirect exposure to Korean chip capital spending through their own equipment suppliers. There is no equivalent western-listed proxy for Korean spandex, because the buyers of this yarn are fabric mills in Asia, and the companies that own those mills are mostly private.
My position is nothing. I hold no shares and placed no order. I am writing this to keep the sheet, and I want to be exact about what would change my mind. The Hyosung TNC stock case here rests on one row of a table that a data vendor refreshes on its own timetable, and my thesis dies when the return on equity cell for this company moves below 4.28 percent, the level at which four of the nine would then sit above it and the pairing of a cheap forward figure with a respectable return would stop existing.
Here is what being wrong costs, priced out instead of gestured at. If the cheap forward figure is right and I stay out, I miss the distance between the corrected 5.92 and a group middle that sits somewhere between 15.82 and 16.79 depending on who is in the table, and I watch that gap close from outside. If it is wrong, what I avoided paying is the difference between a company earning 8.51 percent on equity and one earning the 0.82 percent that a same-sheet neighbor posts, which is what a fiber maker looks like when the cycle turns before the multiple does. I judge the second cost larger, because it arrives with a balance sheet carrying a current ratio of 0.84 attached to it. So I wait for one more quarter of filings and let the vendor refresh its own row.
Related reading: refusing to project one strong quarter forward at Kumho Petrochemical, Hyosung Heavy Industries sits in the same group but on a completely different demand cycle, a Korean apparel maker’s cash statements
Prices and multiples reflect the August 31, 2026 close as checked at the time of writing. Peer cells carry the individual refresh dates shown in the tables above and were not adjusted except where the text says so. USD conversions are approximate, at roughly 1,368.6 won per dollar on the same date. Korean won is the reference currency throughout.
Related reading