TSE Stock’s Six-Month Asset Build: 54.5% Is Working Capital
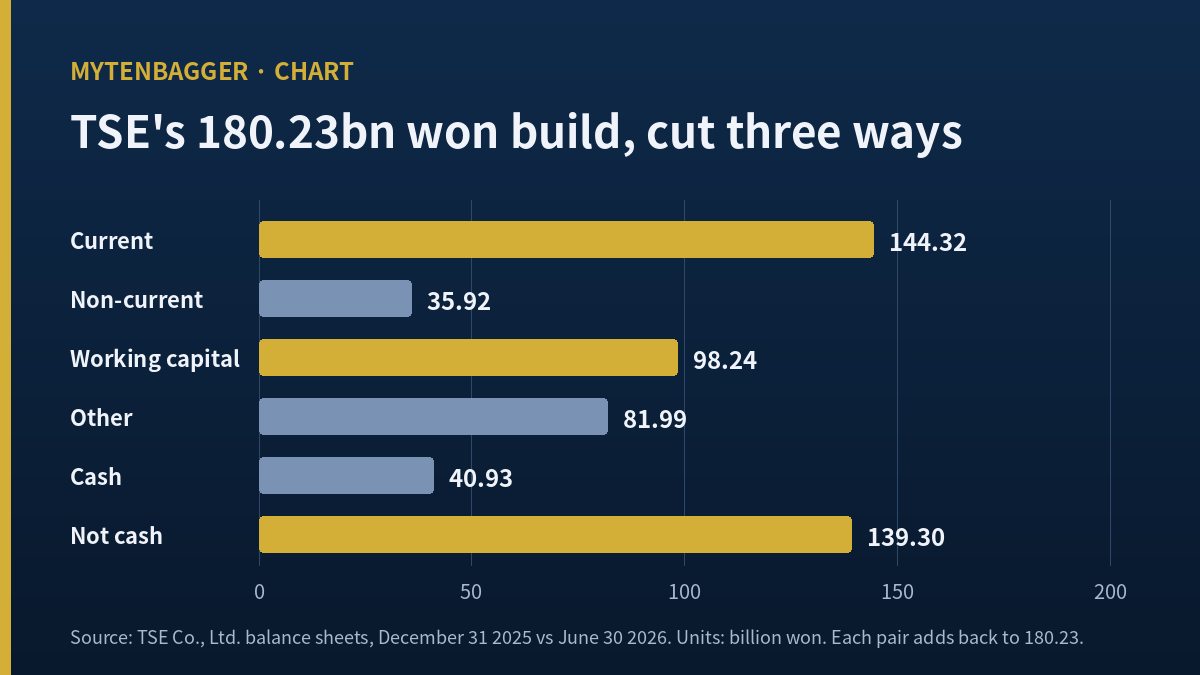
- By maturity: 144.32 billion won current, 35.92 billion won non-current. TSE stock rests on a build that is 80.08 percent short-dated.
- By purpose: 98.24 billion won inventory and receivables, 81.99 billion won everything else. Working capital takes 54.51 percent.
- By liquidity: 40.93 billion won cash, 139.30 billion won not cash. Only 22.71 percent of the build is spendable.
144.32 and 35.92. 98.24 and 81.99. 40.93 and 139.30. Three pairs of numbers, and every pair adds to the same total: the 180.23 billion won of assets TSE Co., Ltd. put on its balance sheet between December 31, 2025 and June 30, 2026. I wrote those three pairs down before I wrote anything else about this company, because the single number they share tells me almost nothing and the three cuts tell me most of what I wanted to know.
TSE Co., Ltd. trades on the KOSDAQ market in Korea under the code 131290. It builds three families of parts used when finished silicon is tested: probe cards, which touch the wafer; test sockets, which hold the packaged device; and interface boards, which sit between the tester and the device under test. The KOSDAQ is Korea’s junior exchange, roughly analogous in role to the Nasdaq relative to the NYSE, and it is where most Korean semiconductor supply-chain names are listed.
I do not own this company and I have no order working in it. What follows is an observation entry, and the thing I observed is a balance sheet that grew 29.64 percent in six months without the plant line doing much of the work.
Contents
Where TSE Stock’s Balance Sheet Grew Between December and June
Start with the whole. Total assets went from 608.02 billion won at the end of December 2025 to 788.25 billion won at the end of June 2026. That is 180.23 billion won added, or 29.64 percent, in two reporting periods. At 1,381.0 won to the dollar, the close on September 21, 2026, the build is roughly 130.51 million dollars.
Thirty percent in half a year is the kind of number that gets quoted on its own. I do not find it useful on its own. A company can add thirty percent to its assets by finishing a factory, by hoarding parts, by getting paid late, or by raising money and sitting on it. Those four stories have opposite meanings, and the headline is identical in all four.
The Same Increase, Cut Three Ways
Each cut has to add back to 180.23
The first cut is by maturity. Current assets rose 144.32 billion won and non-current assets rose 35.92 billion won. The short-dated side takes 80.08 percent of the build. Whatever this company did in the first half of 2026, it mostly did it inside the operating cycle.
The second cut is by purpose. Inventory rose 42.69 billion won and trade receivables rose 55.55 billion won, which is 98.24 billion won between them, or 54.51 percent of everything added. The remaining 81.99 billion won is spread across cash, plant and the smaller lines.
The third cut is by liquidity. Cash and equivalents rose 40.93 billion won, which is 22.71 percent. The other 139.30 billion won, 77.29 percent of the build, is in forms the company cannot spend on Monday morning.
Three cuts, one total, and each one moves the emphasis. The first says short. The second says working capital. The third says illiquid. I find that more honest than any single framing of the same 180.23 billion won, and I kept all three in front of me for the rest of this entry.
TSE Stock and the 98.24 Billion Won That Went Into Inventory and Receivables
The working capital cut is the one I keep returning to. Inventory closed June 2026 at 133.85 billion won, roughly 96.92 million dollars. Receivables closed at 165.17 billion won. Together they are 299.02 billion won, which is 37.93 percent of total assets.
Inventory alone is 16.98 percent of everything this company owns. That is a high reading for a business whose product is assembled to order, and my first instinct was to read it as a warning. I want to be careful about that instinct, and I come back to it at the end of this entry.
The stretch matters more than the level. Against the December 2022 balance sheet, inventory is 3.11 times larger, receivables are 2.38 times larger, and plant and equipment are 1.51 times larger. Total assets over the same stretch are 1.81 times larger. So two lines grew faster than the company and one grew slower, and the two that ran ahead are both lines that turn into cash only if someone buys and then pays.
Five Balance Sheet Dates, One Table
What the five readings look like side by side
| Line, billion won | Dec 2022 | Dec 2023 | Dec 2024 | Dec 2025 | Jun 2026 |
|---|---|---|---|---|---|
| Total assets | 435.83 | 443.12 | 519.40 | 608.02 | 788.25 |
| Inventory | 43.05 | 51.56 | 62.39 | 91.16 | 133.85 |
| Trade receivables | 69.47 | 67.29 | 108.67 | 109.62 | 165.17 |
| Plant and equipment | 158.57 | 181.15 | 183.52 | 210.33 | 239.28 |
| Total liabilities | 105.06 | 95.29 | 119.70 | 143.46 | 207.36 |
| Total equity | 330.77 | 347.82 | 399.69 | 464.56 | 580.89 |
Source: Valueline balance sheet pages for KOSDAQ 131290, read September 22, 2026. Figures as published there in hundred-million won and restated here in billion won. Liabilities and equity add to total assets within 0.01 billion won at every date, with the gap being rounding in the published file.
The four intervals are not alike
Before the funding question, run the total assets row as four steps and not as five points. Across the 2023 financial year the balance sheet added 7.29 billion won, which is 1.67 percent. Through 2024 it added 76.28 billion won, 17.21 percent. Through 2025 it added 88.62 billion won, 17.06 percent. Then the six months to June 2026 added 180.23 billion won, 29.64 percent.
Two of those four intervals are almost identical at roughly seventeen percent, one is flat, and the last is a step change in half the elapsed time. So the six-month build I opened with is not the continuation of a trend line. It is the fourth interval behaving unlike the three before it, and that is a large part of why I wanted the cuts before the commentary.
The flat interval repays a second look. In that 2023 financial year, while the balance sheet barely moved, inventory still rose 8.51 billion won and receivables fell 2.18 billion won. A company whose sales year had gone backwards was still adding parts to the shelf. Equity in that same interval rose 17.05 billion won, more than the whole balance sheet grew, which means liabilities came down while the owners’ side went up.
I do not have a reading of why inventory grew in a year like that, and I am leaving it as an open question and not filling it in. It is the kind of gap that gets answered in an annual report footnote. A restated vendor file will never carry it.
Three and a half years, four lines
Widen the window to the whole file. Between December 2022 and June 2026 total assets went from 435.83 to 788.25 billion won, an increase of 352.42 billion won or 80.86 percent. Four lines carry almost all of it: inventory 90.80, receivables 95.70, plant and equipment 80.71, and cash 64.34. Those four add to 331.55 billion won, which is 94.08 percent of everything the balance sheet gained in three and a half years. The whole rest of the asset side contributed 20.87 billion won, which is 5.92 percent of the three and a half year gain and takes in every intangible, every financial holding and every other line the file carries.
That is a clean picture and I want to state what it does and does not say. It says this company’s growth lives in four ordinary places, with no large intangible, no acquisition block, and no financial asset pile doing quiet work in the background. It does not say the four are growing for the same reason, and the six-month cuts above show they are not.
Read the equity row and the liability row together and the funding question answers itself, which is the next thing I wanted to know.
TSE Stock’s Plant Grew the Slowest of Anything I Looked At
Plant and equipment added 28.95 billion won in the six months, which is 16.06 percent of the build. That is the smallest contribution of any line I have named, and it is the line most people reach for when a Korean component maker reports a bigger balance sheet.
The long view sharpens it. In December 2022 plant stood at 3.68 times inventory. In June 2026 it stands at 1.79 times inventory. The two lines have been closing on each other for three and a half years, and the closing happened because inventory ran while plant grew at a steadier speed of its own.
I have written before about a Korean equipment maker whose order book and whose reported business mix pointed in different directions, in an entry on an order book that did not match the business its name suggests. The pattern here is a cousin of that one. The headline asset number and the line doing the growing are two different stories, and only the second one is actionable.
Why three families put weight on the shelf
The three product families do not sit on a balance sheet the same way. A probe card is built to the pad layout of one customer’s device, so it is close to bespoke and it ages when that device generation ends. A test socket is a consumable that wears out and gets reordered. An interface board sits between tester and device and follows whatever tester fleet the customer runs.
The socket family is the one I have looked at closest elsewhere, in an entry on a single-family socket maker, where a single-family maker turns its shelf over on a replacement rhythm and not on a device generation. That entry is a buy entry and this one is an observation entry, and the difference between them is the filing I describe at the end of this one.
Read against those descriptions, a rising shelf can mean two opposite things. It can mean the company is staging material ahead of orders it already has, which is what a supplier does when a customer commits to a device ramp. Or it can mean cards built for a generation that did not scale. The balance sheet cannot tell those apart, and neither can I from where I am reading. What I can say is that the receivables line rose faster than the inventory line over the same six months, 55.55 against 42.69 billion won, and goods that never shipped do not create receivables.
That is the one piece of comfort I take from these two lines, and I want to be precise about how thin it is. It rules out the worst version, where product piles up and nothing leaves the building. It says nothing about whether what left the building gets paid for on time.
Where TSE Stock’s Funding Came From
Equity rose 116.33 billion won in the six months and liabilities rose 63.90 billion won. Equity therefore supplied 64.55 percent of the build and liabilities 35.45 percent. Within liabilities, the current side rose 64.87 billion won while the non-current side fell 0.98 billion won, so the funding that did arrive from creditors arrived short.
At June 2026 total liabilities against total equity work out to 35.70 percent, and current assets against current liabilities work out to 2.57 times. Both are comfortable readings by the standards of Korean component makers I have looked at this year. Neither tells me whether the inventory turns.
TSE Stock Beside a Company I Did Not Put in a Table
For an overseas comparison I picked Technoprobe S.p.A., listed in Milan. I chose it because it is a listed pure play in one of the three product families this company makes, the probe card, and my reason is that one sentence.
I am naming it as a competitor and not as a customer, and I have put none of its figures anywhere in this entry. The two companies report in different currencies, and I decided that translating one company’s balance sheet into the other’s money in order to line up two columns would manufacture a comparison where none was found. So there is no Technoprobe column below, above, or anywhere else here.
The pure play form is the right one here for a specific reason. This company tells the market that it is the only supplier anywhere that makes all three families under one roof, and I could not verify that claim because I found no public tally that brings all three together. What I can do is put a single-family listed company beside it and let the reader hold the difference in product breadth in mind. That is the whole job I am asking the comparison to do, and it does not need a number to do it.
Three Things I Had the Material For and Left Out
- Interest-bearing loans across five dates. I have the numbers and they barely move. I have used that exact structure in a recent entry on a different company, and repeating it here would be a template, so I left the line out of the argument entirely.
- One reporting period beating a full prior year on profit. The material is there. I have used that same structure before too.
- Two forecasts for the same year that differ by more than two times. Also available, and also a structure I have already spent.
Seventeen Places Where I Could Be Wrong About TSE Stock
- Two balance sheet dates six months apart cannot distinguish a build-up from a seasonal bulge.
- Receivables rising faster than inventory can mean strong shipments or slow collection, and I cannot tell which from a balance sheet alone.
- An aging profile for those receivables would settle it, and I did not find one I could read.
- Inventory at 16.98 percent of assets is high for an assemble-to-order business, but the threshold I am comparing it against is my own impression and not a published benchmark.
- The December 2022 base date I used for the multiples is the earliest one the file carries, and I did not choose it for any analytical reason.
- Every figure in the table is a vendor restatement of a filing, and I did not open the filings themselves.
- Liabilities and equity add to assets within 0.01 billion won, which means the published file is rounded and my differences inherit that rounding.
- A material event report on a convertible bond issuance was accepted on July 10, 2026. I could not open its body, so the future share count is unknown to me.
- If that bond funded part of the equity or cash movement I described, my funding split is incomplete.
- The company’s share price rose sharply on the day that filing was accepted, per one report. I could not establish a link between the two facts.
- The vendor file publishes these lines in hundred-million won and I restated them in billions, so a transcription slip on my side would run through every figure in the table.
- Two data services publish price-to-book readings that do not reconcile to the June equity line above, and I could not establish which equity base either one uses.
- Two data services publish different 2025 net income figures for this company, so I left net income out of this entry entirely.
- The 2023 net income line has one service showing a small positive and another a loss.
- The shareholder register is thin for a company of this size, so the price can move on small flow.
- Korea’s memory investment cycle drives demand for test consumables with a lag, and a turn in that cycle would show in these same two lines first.
- If the closing price I anchored the dollar figures to is wrong, every dollar number here moves with it.
Four Conditions That Break This Reading
What has to show up, and where
- Inventory keeps climbing while receivables flatten. That combination would say the goods are being built and not sold, and the working capital story turns from growth into congestion.
- The convertible bond body opens and the conversion shares are large. Then the equity line I used as the funding answer is partly borrowed, and the funding split has to be redone.
- The third interim report shows current liabilities growing faster than current assets. The 2.57 times cushion is what lets me treat the working capital build as a choice.
- Plant spending accelerates sharply from here. That would not break the reading so much as end it, because the entry is about a build that happened almost without plant.
The first two answer soonest. The statutory deadline for the third interim report is November 16, 2026, and the bond body is available to anyone who can reach the filing system directly, which I could not.
What I Am Doing About TSE Stock, Which Is Nothing
I hold none of it and I have no order working. My reason is narrow and I want it on the record as narrow. It is not the price and it is not the inventory line. It is that a decision to issue convertible debt was filed on July 10, 2026 and I could not read what it says. Every per-share figure I could build today sits on a share base I cannot confirm forward.
What I am doing is keeping the three cuts. When the next balance sheet arrives I will redo the same three splits on the new six-month change, and if the working capital share of the build falls while total assets keep climbing, that will be the first evidence that the build has started converting.
The Filing I Could Not Open and What It Would Cost This TSE Stock Reading
A correction I made while writing this
The July filing is where I caught myself. I read “convertible bond issuance decision” in a filing list and treated the dilution as something that had already happened, and I wrote a sentence on that basis before deleting it. A decision to issue is not an issuance. An issuance is not a conversion. Three separate events, and only the first one is on the record so far. The correction I am making is that I now write down which of those three stages a filing actually reports before I let it touch any per-share work.
What breaks first if the body opens
The receipt number is 20260710000416. If that body opens and the conversion terms are material, the first sentence in this entry to fall is the one in the funding section that reads “equity therefore supplied 64.55 percent of the build.” Convertible debt sitting inside either side of that split would change the number and the meaning at once.
What survives either way
The three cuts survive. Whatever funded it, the 180.23 billion won went 80.08 percent short-dated, 54.51 percent into working capital, and 77.29 percent into things that are not cash. Those shares come from the asset side alone, and no financing document moves them. That is the part of this entry I would still stand behind after reading the filing, and it is the only part.
Prices and the currency conversion reflect the September 21, 2026 close, with the won translated at roughly 1,381.0 to the dollar on the same date. Balance sheet figures are restated from a published file in hundred-million won and rounded to two decimals in billion won, so line differences carry that rounding.
Sources consulted: Valueline balance sheet, KOSDAQ 131290, Kokstock closing quote, Chickstock filing list, Alphasquare issue page, Hedgenaru issue page, Money Today won close.