
Taihan Fiberoptics Balance Sheet: Was Growth Bought With Debt?
- Total assets 2021: 235.9 billion won
- Total assets 2025: 219.0 billion won
- Total equity 2021: 103.3 billion won
- Total equity 2025: 66.65 billion won
- Current liabilities 2021: 72.36 billion won
- Current liabilities 2025: 130.49 billion won
Eighty-eight and a half percent, signed in January 2025. The last one and a half percent, closed on May 6, 2026.
Those are the two pieces of a US subsidiary that Taihan Fiberoptics stock now carries, and between the signing and the closing the company reported a June quarter in which North America went from 18 percent of revenue to 46 percent. I do not hold this KOSDAQ name and I have no order in. What I wanted to know was whether that 28 point move was a sale or a purchase, because the answer decides whether one quarter is worth anything to me.
Contents
What the balance sheet under Taihan Fiberoptics stock actually holds
Taihan Fiberoptics (KOSDAQ: 010170) draws optical fiber from the preform stage and sells optical cable, with power line composite cable behind it. KOSDAQ is Korea’s second exchange, closer to the Nasdaq in composition than the main KOSPI board, and this name sits around 27th to 28th by value among roughly 1,821 listings depending on which data service does the ranking.
At the September 23, 2026 close of 17,700 won, with 155,485,660 shares out, the market value is 2,752.1 billion won, or about $2.03 billion at 1,358.4 won per dollar. Korean markets were shut on September 24 and 25 for the autumn holiday, so this price stands until the September 28, 2026 open.
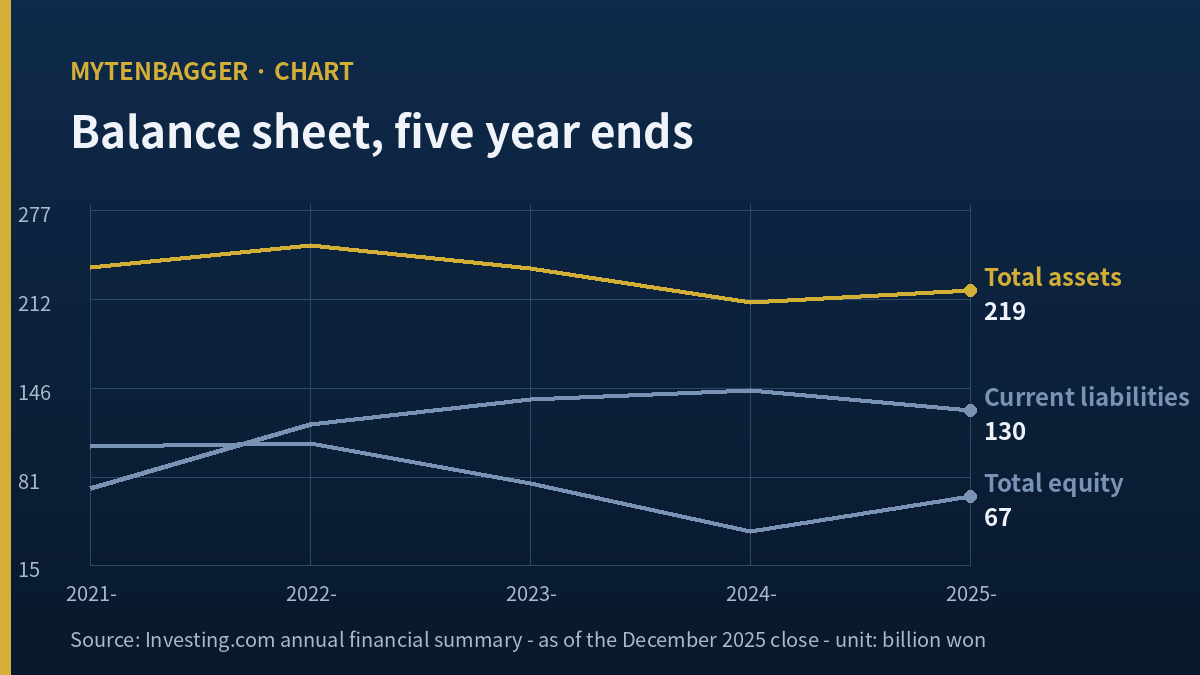
| Billion won | 2021 | 2022 | 2023 | 2024 | 2025 |
|---|---|---|---|---|---|
| Total assets | 235.87 | 252.08 | 234.80 | 209.66 | 219.02 |
| Current liabilities | 72.36 | 120.15 | 138.55 | 144.70 | 130.49 |
| Total equity | 103.35 | 105.53 | 76.02 | 40.83 | 66.65 |
Source: Investing.com annual financial data, figures printed in millions of won and carried here in billions | As of: fiscal 2025 year end (December)
Three rows, one window, three directions. The balance sheet total is 7.15 percent smaller than it was in 2021. Equity is 35.51 percent smaller. Current liabilities are 80.32 percent larger. I want to be exact about what I am and am not claiming here: I am not splitting the change in assets into a debt piece and an equity piece, because the data service does not print a total liabilities row and I refuse to invent one.
One check I ran before trusting two sources at once
The two numbers I lean on come from different places, so I tested whether they sit on the same basis. Korea Economic Daily prints a 2025 debt ratio of 228.60 percent. Applied to equity of 66.65 billion won, that implies total liabilities of 152.366 billion won. Subtracting equity from the top row of the table gives 152.364 billion won. The two land two million won apart, which is rounding. That tells me the Korean source and the international source are describing the same company on the same basis, and it is the only cross-check available to me here.
One further split follows from it. Current liabilities of 130.49 billion won are 85.65 percent of that total liabilities figure. Almost the entire debt load comes due inside a year, and the current ratio a data service prints for this name is 77 percent.
Equity behind Taihan Fiberoptics stock halved as a share of assets, then came partway back
The three rows in the table are more useful as proportions of each other than as levels, and this is the one extra row I built by hand. Equity divided by total assets runs 43.81 percent, 41.86 percent, 32.38 percent, 19.47 percent, 30.43 percent across the five year ends. Current liabilities divided by that same total run 30.68 percent, 47.67 percent, 59.01 percent, 69.02 percent, 59.58 percent. Both are my own division of the published rows, and no service I could reach prints either sequence.
Read together they say something the levels hide. Through 2024 the two lines crossed and kept going: owners held under a fifth of what the company owned while short dated creditors had a claim on better than two thirds of it. In dollar terms the 2024 year end showed roughly $30.1 million of equity under $154.3 million of assets. The 2025 year end pulled the first figure back to 30.43 percent, which is better than 2024 and still eleven points below where 2021 started.
What I take from the pair is that the low water mark is the 2024 column and not the 2025 one this business has to be measured against. Any read that starts from 2025 and calls the direction improvement is starting one year after the thing worth explaining.
Choosing a different starting year changes the size of the claim without changing its direction, and I think that is worth showing openly. Measured from the 2022 peak in place of 2021, assets are down 13.11 percent, equity is down 36.84 percent and current liabilities are up 8.60 percent. Measured from 2021, the same three figures are down 7.15 percent, down 35.51 percent and up 80.32 percent. The current liabilities line is where the two windows diverge most: against 2021 it has nearly doubled, against 2022 it has barely moved. So the growth in short dated debt happened in one step, in 2022, and has held roughly flat since. The equity erosion, by contrast, reads about the same from either starting point, which is the more durable of the two observations and the one I am relying on.
How the debt clock under Taihan Fiberoptics stock is set
Subtracting equity from assets gave me total liabilities of 152.36 billion won for 2025. Subtracting current liabilities from that leaves 21.87 billion won, or about $16.1 million, as the part that is not due inside a year. That is 14.35 percent of what the company owes. The other 85.65 percent has to be paid or rolled within twelve months.
The two proportions I computed close on the same footing, which is how I checked them. Equity at 30.43 percent plus current liabilities at 59.58 percent comes to 90.01 percent, and the remaining 9.99 percent is the non-current piece carried above. The three proportions cover what the company owns once and only once, which tells me no row got used twice while I moved between a Korean source and an international one.
Another Korean name in this industry gave me the adjacent lesson about a debt load that does not move. A telecom equipment maker whose interest bill stayed flat while sales halved showed a balance sheet holding still while the earnings lines fell away beneath it. Here the opposite happened: the earnings lines have started to move and the balance sheet is the part that has not caught up. Same industry, reversed order.
A current ratio of 77 percent, as one data service computes it, sits on top of that arithmetic. The company holds less in current assets than it owes inside the year, which is a normal enough condition for a manufacturer carrying short term credit lines and an uncomfortable one for a business that spent four of five years losing money. I am not treating it as a solvency call. I am treating it as the reason the March 2026 offering existed at all, and as the reason a single profitable quarter does not move me much.
Taihan Fiberoptics stock trades at forty-one times the book it stands on
Market value 2,752.1 billion won. Equity 66.65 billion won. The first is 41.29 times the second, or put the other way, the book equity is 2.42 percent of what the market pays. Accumulated losses carried forward run to about $33.5 million by one data service’s reading, so the equity line is not the product of retained profit.
I am deliberately not turning that 41.29 into a per share book multiple. The reason is mechanical and I set it out in the section on numbers I left alone. For now the useful form of it is the plain one: a company whose own filings show $49.1 million of equity is priced at $2.03 billion.
The 46 percent, and why I cannot take it apart
Two sources covered the same results on the same day and between them they gave three causes, not two. The order in which I read them changed what I thought the quarter meant.
What the company said
For the June 2026 quarter the company named two causes: optical fiber selling prices rose, and North American sales expanded. North America came to 46 percent of quarterly revenue against 18 percent a year earlier. A company official said pricing above the June quarter’s level would show up in revenue from the September quarter onward, and the company expects revenue from 864-core high density optical cable to widen over the closing six months as large cloud operators keep building.
What a second report added
A trade outlet covering the same results named a third thing: the group had acquired Incab America LLC, an optical cable maker in Grapevine, Texas, and now produces and sells locally through it. The stake history is the part that matters to my problem. A share purchase agreement in January 2025 took 88.5 percent. The final 1.5 percent closed on May 6, 2026, bringing the total to 90 percent. The unit makes optical ground wire, all dielectric self supporting cable and specialty cable for utilities, telecom carriers, railways and industrial users. The purchase price was not disclosed.
A stake signed sixteen months before it closed does not tell me which quarter its revenue started arriving in.
That is the whole of my difficulty. If 88.5 percent was already in the group’s numbers through 2025, then the jump from 18 to 46 percent is mostly price and volume and the company’s own two causes are sufficient. If the closing in May 2026 changed how the unit enters the group’s revenue, part of the 28 points is a purchase. Published rows do not separate the two, and I am not willing to guess which.
It is worth being specific about what would settle it, because not every filing would. A geographic revenue note alone does not help: it would confirm the 46 percent and say nothing about where the goods were made. What I need is the acquired unit’s revenue shown on its own line, or a year earlier comparative restated on the same perimeter. Neither of those is guaranteed to appear, and the purchase price was never disclosed, so there is no consideration figure to work backward from either. That is why I am treating this as a question I may simply have to carry unanswered for two more quarters and not just one. A journal entry that admits which questions it cannot close is more useful to me later than one that quietly picks a side.
There is a Korean comparison worth setting beside this. In a cable maker whose price covers two businesses at once the problem was that one share price stood over an operating segment and a venture with no revenue yet. Here the two things are not two businesses but two possible explanations for one number. The difficulty differs in kind: there, I could not divide a price; here, I cannot divide a percentage.
A global peer I will name but not measure against
The company that actually moves the world price of what this business sells is Corning Incorporated (NYSE: GLW). Its market value on September 24, 2026 was $133.69 billion. I am printing that one line and nothing else about it.
The reason is arithmetic. $133.69 billion against $2.03 billion is 66.0 times, and at that distance a multiple comparison or a profitability comparison would not be a comparison at all. I picked this peer to establish who sets the price the Korean company is reporting as a tailwind; ranking the two is no part of it. Corning has publicly tied multi year fiber supply to a US carrier and to AI infrastructure work with chip and optical partners. If the price of optical fiber is rising, it is rising in a market that company sets the terms of. That is the only thing I wanted from the name.
What a US reader should hold onto about Taihan Fiberoptics stock
Two pieces of context travel badly across the Pacific, so let me set them down plainly. The first is the market. KOSPI is Korea’s main board, the one that carries the large exporters. KOSDAQ, where this company trades, is the second board, and it holds a heavier concentration of component makers, biotech and equipment names. A position around 27th to 28th by value on KOSDAQ does not correspond to 27th to 28th in Korea overall; at $2.03 billion this is a mid cap by Korean convention and a small cap by US convention.
The second is what the price band implies. A 52 week low of 1,219 won and a high of 31,500 won means the share changed hands across a factor of 25.8 inside a single year, and the September 23 close of 17,700 won sits between them with no obvious claim to either end. A US reader used to fiber exposure through a large diversified supplier should understand that this is a different kind of instrument: one product line, one board, and a valuation that moved further in twelve months than the underlying revenue did in five years.
Neither of those two facts is a reason to buy or avoid anything. They are the reason I insist on the balance sheet before the story. When the float is this volatile and the equity behind it is this thin, the published rows are the only part of the picture that holds still long enough to read.
The numbers behind Taihan Fiberoptics stock that I left alone

Book value per share, and why the printed multiple is on two clocks
One data service prints a per share equity figure and a multiple built on it. A second prints a multiple for the same company on the same day that is roughly nine times smaller, which would require a per share figure almost ten times larger. A third stopped printing the line after 2023 and leaves the cell empty. Dividing 2025 equity by the shares now outstanding reproduces the first service’s figure exactly, so that one is at least internally consistent. I am deliberately not carrying any of those three printed values into this piece.
But that division puts a share tally from March 2026 over an equity figure from December 2025, and a rights offering settled in between. What I divided by is after the new shares and what I divided is before the money they brought in. Two clocks, one ratio. So the per share equity figure and every multiple built on it are out of this piece. The offering itself, its size and its dates, belongs to the Korean side of my own records and I am not repeating the amounts here.
The row I did not build
I could have made an equity to loss comparison for 2025, since equity rose while the year was loss making. I left it alone on purpose. That structure belongs to another Korean name I have already worked through, and running it again here would be the same sentence with a different ticker. One check, once, is enough.
Nine ways I could be wrong about Taihan Fiberoptics stock
- The balance sheet rows come from one international data service. My only cross-check was a Korean debt ratio, and it only covers the 2025 column.
- That same service’s operating profit row disagrees with the Korean source in three of five years, so its accuracy is not uniform across the table.
- There is no total liabilities row in the source. For four of the five years I have total holdings, current liabilities and equity and nothing else.
- The current ratio of 77 percent and the accumulated loss figure each come from a single service, unverified elsewhere.
- The 46 percent and the 18 percent are reported figures from press coverage of the results and not lines I read in a filing.
- The acquired unit’s own revenue, capacity and purchase price are all undisclosed, which is precisely why the 28 point move cannot be split.
- The earnings multiple prints at two services with the same sign and sizes an order of magnitude apart. Neither is usable while the company is loss making anyway.
- The 52 week band runs 1,219 won to 31,500 won, a factor of 25.8. Any price inside that band is a weak anchor, and the September close sits near the middle of it.
- Not one named brokerage forward estimate could be found. The consensus aggregator is robots blocked, and four pages that do print an objective figure read as machine assembled, so I treated them as tier four and carried nothing from them. This piece has no per share objective in it, and that is a choice; it is not an absence.
Eight conditions that would change my read
These are mine, weighted by me, and the percentages are my own judgment and not a calculation. They sum to 100.
- (25%) The Q3 filing, legally due November 16, 2026, breaks out the North American contribution by unit. That single disclosure answers the whole piece.
- (20%) North America stays within a couple of points of its June level for a second straight quarter. Two quarters is harder to explain by a closing date than one.
- (15%) Current liabilities fall below 120 billion won. With 85.65 percent of debt inside a year, the maturity profile is the first thing I would want relieved.
- (10%) Equity is restated with the new share tally and the offering proceeds together, which would put that per share figure back inside my reach.
- (10%) The 864-core cable supply turns into a disclosed contract value and no longer an expectation.
- (8%) A named brokerage publishes a forward estimate, giving me something above tier four to test my own arithmetic against.
- (7%) Optical fiber pricing reverses, which would take the company’s own stated cause away and leave only the acquired unit.
- (5%) The acquired unit’s revenue is disclosed separately, at which point the 28 points divide themselves and I do not have to.
Where Taihan Fiberoptics stock leaves me now

Assets have shrunk a little, equity has shrunk a lot, and short dated debt has grown by four fifths since 2021. Against that, the market pays forty one times the remaining book, and the reason offered is a quarter in which North America more than doubled its share of revenue. I am not holding and I have no order in, because I cannot tell whether that quarter is a sale or a settlement date.
What reopens this for me is not something anyone has to publish. Two reported figures, the North American share and the total revenue, are all I need to build the row myself, so this condition does not wait on anyone’s announcement. If the September quarter arrives with a North American share near its June level, the closing date explanation gets much weaker on its own.
The two figures I will divide next are these: North American revenue share for the September 2026 quarter, and total revenue for the same three months. Whichever way that pair falls decides the next entry.
A stake is the thing I misread here, and it is worth writing down. I have always treated an ownership percentage as a fact with one date on it, the date it was announced. This one had two dates sixteen months apart, and the gap between them is exactly where my question lives. From now on, when a subsidiary shows up in a revenue mix explanation, I look for the closing date before I look at the percentage.
Prices and multiples reflect the September 23, 2026 close. Dollar conversions are approximate, at roughly 1,358.4 won per dollar on the same date. Annual balance sheet rows come from Investing.com’s annual figures and the debt ratio cross-check from Korea Economic Daily. Quarterly results and the regional share are from Digital Daily, August 18, 2026 and Newspim the same day. The subsidiary closing is from Asia Economy, May 6, 2026, and the peer figure from Stock Analysis.
Related reading