Samsung E&A Stock: The Unrevised Target Implies a 6.61% Half
There is one subtraction in this piece and everything after it is commentary. I take the full-year target Samsung E&A has published, I remove the half-year it has already delivered, and I look at what is left. That leftover is the part of 2026 the company has not yet been paid for by reality, and the margin buried inside it is why I opened a file on Samsung E&A stock at all.
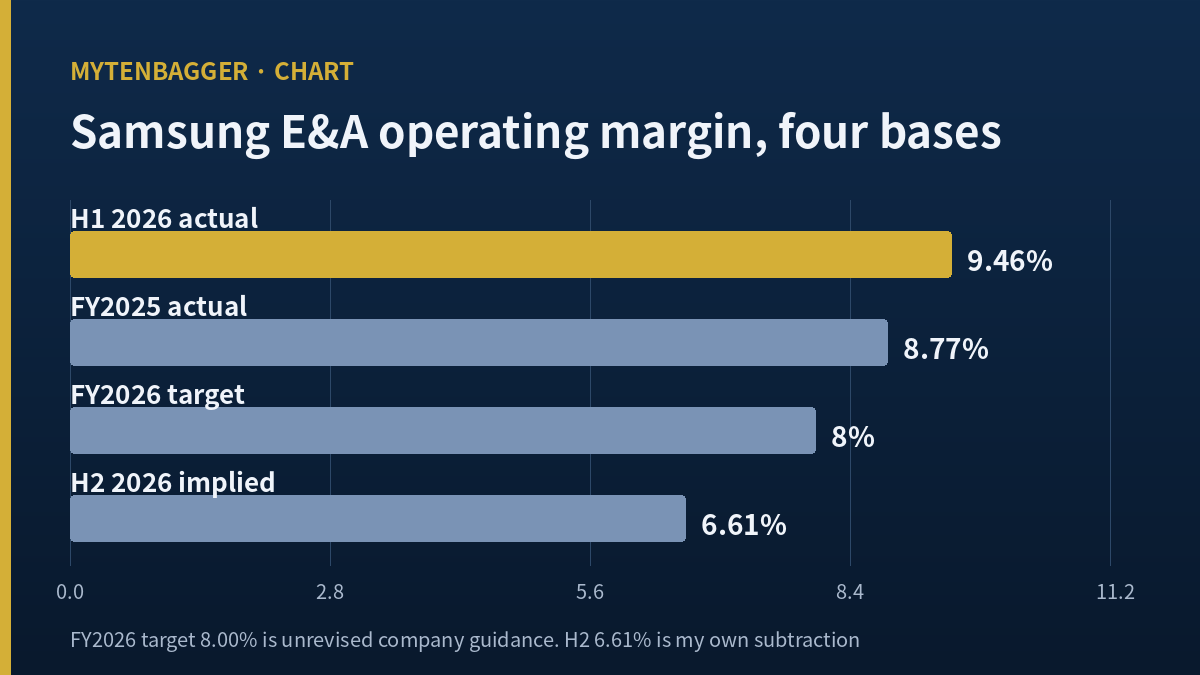
1. Full-year target: revenue 10.0tn won, operating profit 800bn won. Implied margin 8.00%.
2. First half actual: revenue 4,876.7bn won, operating profit 461.3bn won. Margin 9.46% (my calculation).
3. What remains for the second half: revenue 5,123.3bn won, operating profit 338.7bn won (my calculation).
4. Divide line 3: 6.61%. That is 2.85 points below the half just reported and 2.16 points below full-year 2025.
Contents
Why Samsung E&A stock is a margin question before it is an order question
Samsung E&A trades on the KOSPI under 028050. The KOSPI is South Korea’s main board, the venue where the country’s large industrials list, and it runs a daily price limit of plus or minus 30% per stock, which matters later. Until 2024 this company was called Samsung Engineering. It designs and builds process plants: refineries, petrochemical complexes, gas processing, water treatment, and increasingly the fabrication buildings that semiconductor and battery makers need. It does not build apartments, and it is not the chip maker. It is the contractor that puts up the buildings the chip maker fills.
For 2026 the company told the market it intended to book 12tn won of new orders, 10tn won of revenue, and 800bn won of operating profit. It repeated those figures when it reported second-quarter results on Thursday, 23 July 2026. That is the document I keep coming back to, because the first half already ran ahead of it.
Revenue in the second quarter came in at 2,609.3bn won, up 19.8% year on year, with operating profit of 273.1bn won, up 51.0%, and net profit of 182.5bn won, up 28.8% (Korean business press, 23 July 2026). Operating profit grew at more than two and a half times the pace of revenue. Management attributed that to large-project revenue recognition and to cost optimisation on projects in progress.
The step up happened in one quarter, not two
Splitting the halves apart is what made this interesting to me. First-quarter revenue was 2,270bn won with operating profit of 188.2bn won, an 8.29% margin (my calculation, and consistent with the 8.3% the company reported). The second quarter ran at 10.47% (my calculation). That is 2.18 points added in a single quarter.
The two quarters reconcile cleanly. First-half operating profit of 461.3bn won less the first quarter’s 188.2bn won leaves exactly 273.1bn won, which is the reported second-quarter figure to the last digit. When a subtraction lands on the nose like that, I stop worrying that I have mixed two reporting bases.
A reorganisation that changed what the numbers are called
In January 2026 the company replaced its old two-way split, chemical and non-chemical, with three divisions: chemicals, advanced industry, and new energy (Korean press coverage of the Q2 release). First-half revenue by division came to 2,203.1bn won for chemicals, 1,412.2bn won for advanced industry, and 1,261.4bn won for new energy.
I ran those three through a calculator before using them, and I am glad I did. They sum to 4,876.7bn won, which is the first-half total exactly. One Korean report presented the same three figures as second-quarter numbers, and the second quarter was 2,609.3bn won, so the three would have added to roughly 1.87 times the quarter they were attached to. Addition settled it, not the masthead on the article. I have carried the trio as half-year cumulative throughout.
New energy is worth a note beyond the accounting. Giving it a name of its own put 1,261.4bn won under that heading in six months, and a Korean summary of sell-side views cited an estimate that the division grows from 1,350bn won in 2025 to 2,550bn won in 2027 (Korean re-rating round-up; I could not confirm the originating outlet from the syndicated page). A reorganisation is also a statement about what a company wants to be valued on.
The case against Samsung E&A stock starts with the order book cooling
If I only wrote the margin paragraphs I would be writing an advertisement. Orders point the other way. First-quarter new awards were 4,627.7bn won, up 91.4% year on year, split as 3,173.6bn won chemicals, 861.8bn won advanced industry, and 592.3bn won new energy, which sums to the total exactly. First-half cumulative awards were 7.6tn won. Subtract, and the second quarter brought in roughly 2,970bn won (my calculation), around two thirds of the first quarter’s pace.
Against the 12tn won annual goal that is 63.3% booked by mid-year (my calculation), which is ahead of a straight-line run rate. But the first quarter built that cushion, not the second. The headline second-quarter award was an $800m water treatment plant in the Middle East signed in June; converted at this piece’s reference rate that is about 1,144bn won (my calculation, using my reference date rather than the contract date).
What 22.7tn won of backlog does and does not tell me
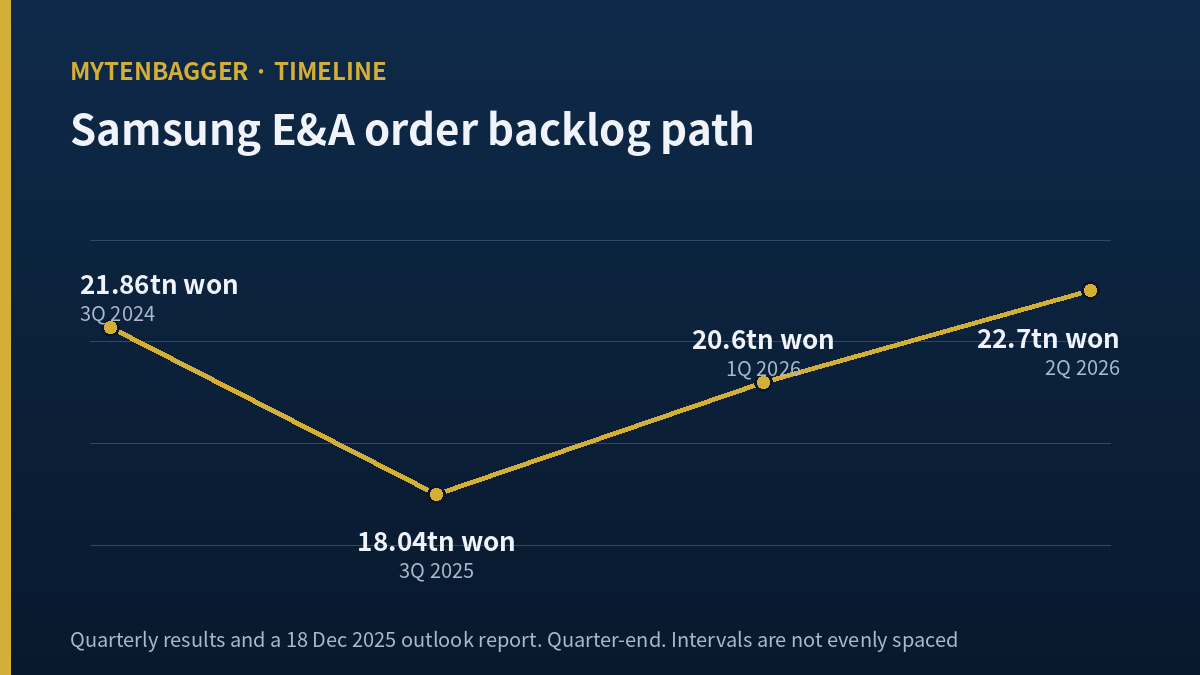
Backlog stood at 22.7tn won at the end of the second quarter, up from 20.6tn won three months earlier. Divided by 2025 revenue of 9,028.8bn won that is 2.51 years of work (my calculation). Laid out in sequence the trajectory is the clearest thing about this company: 21.86tn won at the end of the third quarter of 2024, 18.04tn won a year later (Korean sector outlook published 18 December 2025), 20.6tn won at the end of the first quarter of 2026, and 22.7tn won now. It bottomed and refilled.
The rest of the bear case does not live in the backlog. First-half net profit grew 15.7% while operating profit grew 36.4%, and in the second quarter alone the split was 28.8% against 51.0%. Improvement made at the operating line is not arriving intact at the bottom line, and I could not determine from this round of disclosure whether the leak sits in financial items or in tax. I would rather leave that open than guess at it. Separately, the same Korean sector outlook flagged competition from Chinese and Indian contractors as a source of unease, and low-price bidding in chemicals is a hole this industry has fallen into more than once.
It is also worth being precise about what backlog coverage of 2.51 years does and does not buy. It buys revenue visibility, not margin visibility. Every one of those years was priced at a bid date that has already passed, on cost assumptions made before the labour and materials of the delivery years were known. A backlog that refills at good prices and a backlog that refills at any price look identical in the headline figure, and the only place the difference surfaces is the margin line, which is precisely the line the company’s own unrevised target implies will fall. That is not a contradiction I can resolve from outside. It is the reason I want a third data point rather than two.
The pipeline list, and how old it is
A Korean sector piece published on 18 December 2025 listed the projects the company was chasing: a Saudi gas development around $2bn, a Qatari chemical award near $4bn, a Middle East petrochemical bid at $2.5bn, blue methanol in Mexico near $2bn, blue ammonia in Saudi Arabia at $3.5bn, and a sustainable aviation fuel project in the United States that had started as a $15.7m front-end study with a roughly $3bn build behind it. The Korean re-rating round-up later cited a similar set including Saudi water treatment and Qatari urea.
I am reproducing that list with a warning attached rather than as a forecast. It is more than seven months old at the time I am writing, several of those items were flagged as year-end 2025 decisions, and I have not been able to confirm which converted, which slipped, and which went elsewhere. What the list is good for is scale and shape: individual awards in this business run from hundreds of millions to several billion dollars, they are lumpy, and a single decision by a single ministry can move a quarter’s order total by a third. That lumpiness is why I treat the second quarter’s slower award pace as one observation rather than a trend, and it cuts against my own bearish reading of that number as much as for it.
One customer, and what NH is actually underwriting
The most quoted forward number attached to this company is NH’s estimate that Samsung Electronics fab construction alone could run near 7tn won a year from 2027, tied to build-outs at Pyeongtaek, Gwangju and Yongin. Set against 2025 revenue of 9,028.8bn won, awards of that size would equal roughly three quarters of the company’s most recent annual revenue (my calculation). The two figures are not the same kind of number, since awards are booked when signed and revenue is recognised as work proceeds, so this is a sense of scale rather than a forecast of customer mix. Even read loosely it says something, because the same sentence supports the bull case and the bear case without changing a word.
On the bull side it is the most creditworthy counterparty in Korea committing to a multi-year construction programme, which is a far better order book than chasing petrochemical tenders against Chinese bidders. On the bear side it is a concentration that no US-listed peer in the table above carries. Fluor, KBR and Jacobs all sell into diversified government and industrial customer bases; none of them would have a quarter of forward revenue keyed to one affiliate’s capital budget. Concentration of that kind does not show up in a price-to-book ratio. It shows up on the day the customer defers a fab, and the decision to defer will be made for reasons that have nothing to do with this contractor’s execution.
Capital return has been moving in the shareholder’s direction meanwhile, from a low base. The payout ratio went from zero in 2023 to 25.1% for 2025, with the dividend raised 19.7% to 790 won per share. On the 4 August close that is a yield of about 1.65% (my calculation), which is not why anyone would own this, but a company that pays nothing and a company that pays a quarter of earnings are run by boards with different ideas about who the cash belongs to.
What the sell-side is paying for in Samsung E&A stock
The day after results, on Friday, 24 July 2026, nine Korean houses lifted their valuations at once, into a reported band of 65,000 to 80,000 won (Korean market press, 25 July 2026). The named recent work I could verify looks like this.
| House and author | Date | Valuation | Stated basis |
|---|---|---|---|
| NH Investment & Securities, Lee Eun-sang | 24 Jul 2026 | 80,000 won | 2026 awards of 14tn won, up 121%; Samsung Electronics fab work near 7tn won a year from 2027 |
| Kyobo Securities, Lee Sang-ho | 22 Jun 2026 | 66,000 won | 2026 revenue 10,151bn won and operating profit 888bn won; entry into US LNG modules |
| KB Securities | 7 May 2026 | 73,500 won | Average awards of 16tn won across 2026 to 2028, backlog reaching 30tn won |
| Kiwoom Securities | 7 Apr 2026 | 56,000 won | Return of the semiconductor capital spending cycle |
| BNK Investment & Securities | 27 Jan 2026 | 36,000 won | Emphasis on awards and new businesses |
The column I actually read is the one on the right. Four of the five rest on awards: 14tn won of them, 16tn won a year, a 30tn won backlog, a capital spending cycle. The one item that genuinely improved in the second quarter, the operating margin, appears in none of those five rationales. The market is pricing what this company will win. The company just demonstrated what it can keep. Those are two different axes and right now they are not pointing the same way.
One cross-check gave me more confidence in the Kyobo numbers than I expected. Reversing the growth rates in that estimate, 888bn won of 2026 operating profit at plus 12.1% implies 792.1bn won for 2025, and 10,151bn won of revenue at plus 12.4% implies 9,031bn won (both my calculation). The vendor data screen I use carries 792.1bn won and 9,028.8bn won for 2025. The profit line matches to the last digit and revenue differs by 0.03%. Two sources arriving at the same place from opposite directions is worth more to me than either one alone (Korean coverage of the Kyobo estimate; the NH work was reported here).
Samsung E&A stock against three US-listed engineers
| Metric | Samsung E&A | Fluor | KBR | Jacobs |
|---|---|---|---|---|
| P/E | 15.16 | 22.82 | 11.18 | 39.33 |
| P/B | 1.97 | 2.47 | 2.82 | 4.84 |
| P/S | 1.04 | 0.46 | 0.60 | 1.24 |
| Operating margin | 8.77% | −2.76% | 7.25% | 6.12% |
| Market cap | $6.55bn | $7.01bn | $4.68bn | $16.38bn |
The three American figures come from stockanalysis.com at the 3 August 2026 US close, one session away from the Korean close I am using, so these are not values to compare to two decimal places. Fluor’s 22.82 P/E sits on top of a negative operating margin, meaning items below the operating line are carrying its net income, so I only put Fluor to work in the price-to-book and margin rows.
On price to book, the Korean name is the cheapest of the four. On operating margin it is the richest. In Seoul a construction-sector P/B near 2.0 reads as expensive; measured against companies doing the same work in dollars, it reads as the discount in the group. Which yardstick is correct depends on which cycle this company’s profit ends up tracking, and with 28.96% of first-half revenue sitting in the advanced industry division (my calculation), a division fed by Korean semiconductor, battery and biologics construction, I do not think that question has resolved yet.
The domestic capital spending angle is why I file this alongside my notes on KEPCO, where I separated the tariff axis from the volume axis and on whether Korea can physically build the grid its data centre plans assume. It sits opposite my note on Hanmi Semiconductor’s eroding tool share in one specific way: Hanmi sells equipment that goes inside the building, and this company sells the building.
Where I stand, and what would change it
In the sources I worked through I did not come across a US-listed line for this company; the Korean listing is the one that prices and settles in won. One share at the 4 August close is about $33.39, against the roughly $93 a single share of the last Korean name I wrote up would have cost. The other thing that shapes the tape is the daily limit. The KOSPI stops any single stock at plus or minus 30% in a session, which sounds like protection and behaves like a trap door: an order resting at the limit can sit unfilled while the price is pinned there.
There is a version of this company I carried in my head for years that was simply wrong. I had it filed as a Korean builder, and Korean builders are a sector I avoid on principle because of the housing cycle. This one does not build housing at all. That mislabelling is the reason I ignored the backlog when it was bottoming at 18tn won during 2025, a year when revenue fell 9.41% and operating profit fell 18.48% and I looked no further than those two minus signs.
I have not bought a single share. The margin improvement is confirmed and the backlog recovery is confirmed, but I am holding a view that differs from the market’s, and I would rather not fund that view before it is tested. The market is paying for future awards. What I would want to buy is the durability of the margin. Those two meet on the same page for the first time at the third-quarter report.
So my trigger is not a price. It is a document. At the third-quarter results, does the company raise its full-year target? If it does, the 800bn won figure was a stale number that the first half had already outrun, and the raise is the company saying in its own hand that it does not plan to let the second half fall back to 6.61%. That is when I would start, small. If it leaves the target alone after beating the implied margin by 1.46 points at the halfway mark, I read that as management seeing something in second-half cost or revenue recognition that I cannot see, and I keep waiting until divisional cost ratios are published.
My thesis breaks at a specific number. If the third-quarter operating margin prints below 8%, then the 10.47% of the second quarter was one large project passing through and not a level, the structural read is wrong, and I take the file off the watchlist and concede the point to everyone valuing this on awards.
Price context, and the one number I am waiting on
The last two weeks have been violent. The stock touched 49,700 won intraday on results day, 23 July 2026, fell to 38,500 won intraday on Wednesday, 29 July 2026, a drop of 22.54% across four sessions (my calculation), and closed at 47,750 won on Tuesday, 4 August 2026, recovering 24.03% off that low (my calculation). It fell after good results and recovered without a filing to explain either leg, and I have not worked out why. Calling it flows would be naming the gap rather than closing it.
Over longer windows: up 88.74% in twelve months, up 58.11% in six, down 10.58% in three, down 1.24% in one. It sits 29.05% below the 250-day intraday high of 67,300 won and 106.26% above the 23,150 won low. The close is 0.09% above the 60-day moving average of 47,706 won and 10.3% above the 20-day at 43,290 won.
For balance sheet and payout: price to book 1.97, return on equity 13.8%, debt ratio 126.53%, foreign ownership 38.65%. The dividend was 790 won per share for 2025, about $0.55, up 19.7% from 660 won, a payout ratio of 25.1%. Book value per share is 24,187 won, which puts total equity near 4,740.7bn won when multiplied by the 196.0m shares outstanding (my calculation).
All of which I will read again in October in one order, and the order matters because reading it backwards flatters the conclusion. Backlog first makes everything downstream look generous. So: the target, then the margin, then the awards, then the backlog. And if I am allowed only one figure out of that entire report, I want the third-quarter operating margin, because 8.29% and then 10.47% is not yet a line, and the third print is what turns two points into one.
Prices and multiples reflect the 4 August 2026 Korean close as checked at the time of writing; this note may reach a reader later, so live quotes will differ. The Korean won is the reference currency here and dollar figures are approximate conversions at roughly 1,430 won per dollar on that date, quoted for scale rather than for arithmetic (see Korean currency market coverage of 4 August 2026). Company results are the preliminary figures released on 23 July 2026 and may move when the audited filing lands. Anything labelled “my calculation” was derived by me from figures in the sources and does not appear in them directly. Valuations from Korean brokerages are reported as facts about what those houses published on those dates and are not figures I have adopted. Vendor fundamental and price data are from Kiwoom via my data screen, on the same 4 August basis; further Korean reporting consulted at Newspim.
Related reading
- GS E&C Stock Has Booked 1.54x Revenue Three Years Running
- Samsung Life Stock: I’m Buying a Discounted Samsung Proxy