Chunbo Earnings: Revenue Up a Third, Operating Margin Negative
Chunbo stock is priced on a company whose first-half revenue grew 33.70 percent year on year. Over the same six months its operating margin went from positive 8.31 percent to negative 7.87 percent. Both numbers come out of the same filing, submitted to Korea’s Financial Supervisory Service on August 14, 2026 (Fri).
I have spent a fair amount of time this year on Korean battery-materials names, and the usual explanation for a margin like that is a demand problem. Chunbo does not fit the usual explanation. Demand, measured as revenue, went up by a third. The margin still inverted. This piece is my attempt to find out where the sixteen percentage points went, and whether the answer is about the industry or about this one company.
Six months against six months (consolidated, KRW billion)
| Line | H1 2025 | H1 2026 | Change |
|---|---|---|---|
| Revenue | 68.64 | 91.77 | +33.70% |
| Operating profit | +5.71 | −7.23 | sign flip |
| Operating margin | 8.31% | −7.87% | −16.19pp |
| Capital expenditure | 11.16 | 19.36 | +73.50% |
Source: Chunbo half-year reports filed with Korea’s Financial Supervisory Service, consolidated basis. Margins and percentage changes are my own division of the filed figures.
Contents
What Chunbo stock is priced on, in one paragraph
Chunbo Co., Ltd. trades on KOSDAQ under the code 278280. KOSDAQ is the smaller of Korea’s two main boards, roughly comparable in role to the Nasdaq of the early 2000s: it lists growth and technology companies, it is more volatile than the main KOSPI board, and its constituents are less likely to have any US-listed line attached to them. Chunbo makes electrolyte additives for lithium-ion batteries, principally fluorinated salts such as LiFSI, which go into the electrolyte that sits between a cell’s anode and cathode. Its customers are cell manufacturers.
At the close on August 21, 2026 (Fri) the shares were at KRW 33,850, which puts the market value at KRW 414.8 billion, or roughly USD 299 million at the exchange rate noted at the end of this piece. That is small. For an American reader the size matters, because it decides what can and cannot be done with a name like this, and I come back to that near the end.
Chunbo stock and a revenue line that fell 59 percent first
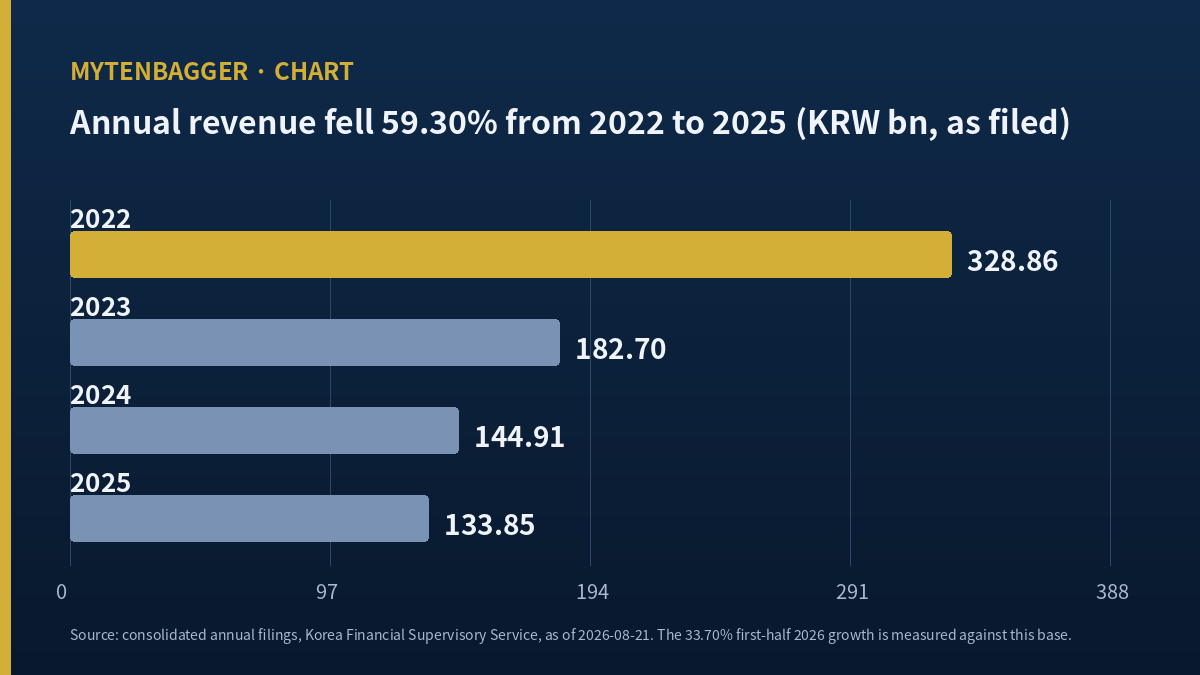
The 33.70 percent increase needs a base to stand on, and the base is the part I nearly skipped. Annual revenue, consolidated and as filed, ran KRW 328.86 billion in 2022, KRW 182.70 billion in 2023, KRW 144.91 billion in 2024 and KRW 133.85 billion in 2025. From the 2022 figure to the 2025 figure that is a decline of 59.30 percent, a compound rate of negative 25.89 percent a year, both by my calculation from the filed numbers. Operating margin over the same four years went 17.17 percent, negative 4.40, negative 15.70, and back to positive 2.77.
So the first half of 2026 is a rebound, and it comes off a floor. It continues nothing. Set the six most recent quarters side by side, each one standing alone and not cumulative, and the pattern reads straight off the page: revenue of KRW 35.56 billion, 33.09, 30.63, 34.58, 40.77 and 51.00 billion from the first quarter of 2025 through the second quarter of 2026. The most recent quarter is the largest of the six and 66.53 percent above the smallest, which was the third quarter of 2025.
That trajectory is the strongest thing in this company’s filings right now, and it is why I keep watching. A materials business whose quarterly revenue rises 66 percent off a trough is doing something its customers want. The trouble is only that the margin went the other way while it happened, and a rising volume line with a falling margin line is the exact signature of a plant running below the rate it was costed at.
Where Chunbo stock lost sixteen points of margin
The sixteen percentage points did not go to selling expenses. Korean sell-side commentary on the first quarter, summarized by Wisereport in its earnings note, put the swing at the cost line: gross profit itself turned negative on rising input costs, and the operating loss widened from there. That is a different diagnosis from a demand shortfall, and it is the one the numbers support.
Three things are pushing on that cost line, and I can source all three.
First, a new plant that is not yet earning. Chunbo committed to a Saemangeum industrial complex project that Electronic Times reported in April 2022 at a total of KRW 512.5 billion across 200,000 square meters. Korean coverage collected by Daily Invest on January 6, 2026 (Tue) put the start of operations at the first half of 2026, pushed back from a fourth-quarter-2025 plan, and quoted analysts at four Korean brokerages describing early-stage running costs and a higher fixed-cost burden as making a first-quarter loss unavoidable. They were correct.
Second, depreciation on capital spending that has already happened. Between 2022 and 2025 Chunbo spent KRW 655.5 billion on plant while generating KRW 153.2 billion of operating cash flow. Depreciation on that base runs through the cost line whether or not the lines are loaded.
The fourth row of the table at the top belongs with those three. Capital expenditure in the first half of 2026 was KRW 19.36 billion against KRW 11.16 billion a year earlier, up 73.50 percent by my calculation, which is more than twice the rate at which revenue grew. Inventory days went the same direction: 82.2 days at the end of 2025 against 96.8 days at the end of June 2026, on my vendor’s calculation of closing inventory against single-quarter revenue. A company still building and still stocking is a company whose fixed costs are ahead of its output, and both of those lines say the build is not finished.
Third, input prices. Lithium hexafluorophosphate, the salt Chunbo buys, moved sharply. SNE Research put the average price at CNY 160,500 per tonne as of November 25, 2025, against a July low of CNY 49,300, a rise of 226 percent. A materials maker facing that with contracted selling prices absorbs the difference for at least a quarter or two.
Seven filings, one column, and the bottom three
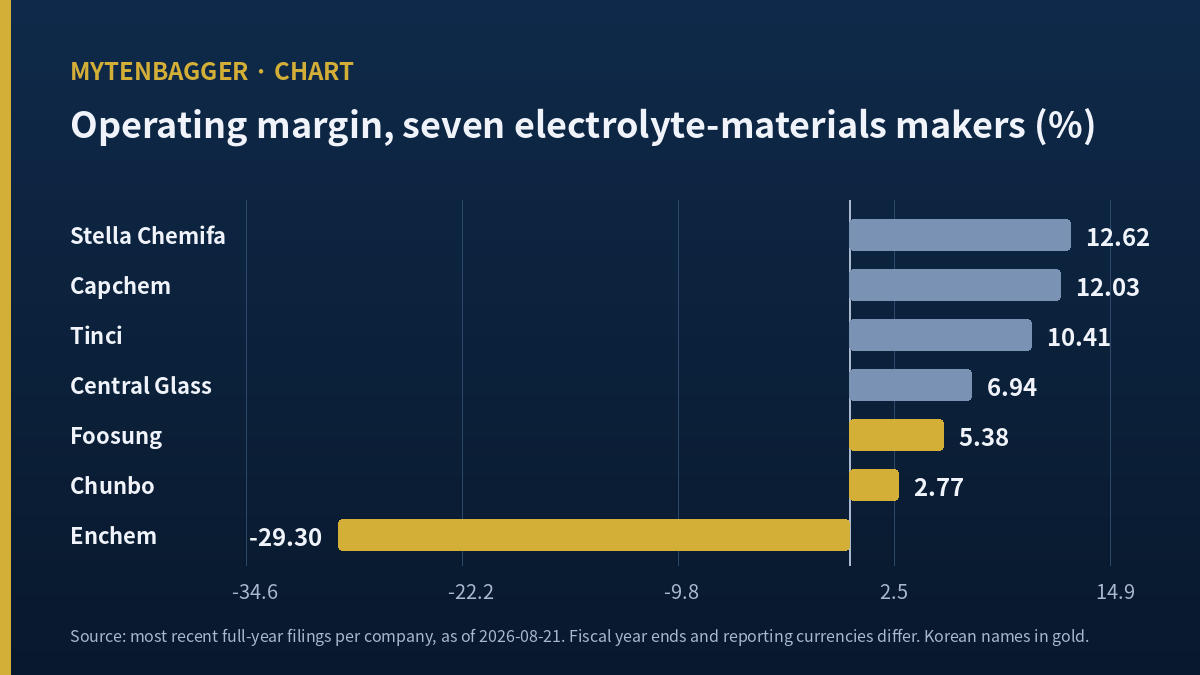
The question I could not settle from Korean sources alone was whether this is an industry condition or a company condition. So I pulled operating margins from the most recent full-year filings of six other listed companies that make electrolytes, electrolyte salts or the fluorochemicals that go into them, and put Chunbo’s own figures alongside.
| Company | Listing | Period | Operating margin |
|---|---|---|---|
| Stella Chemifa | Tokyo 4109 | FY to Mar 2026 | 12.62% |
| Capchem | Shenzhen 300037 | FY to Dec 2025 | 12.03% |
| Tinci Materials | Shenzhen 002709 | FY to Dec 2025 | 10.41% |
| Central Glass | Tokyo 4044 | FY to Mar 2026 | 6.94% |
| Foosung | KOSDAQ 093370 | FY to Dec 2025 | 5.38% |
| Chunbo | KOSDAQ 278280 | FY to Dec 2025 | 2.77% |
| Enchem | KOSDAQ 348370 | FY to Dec 2025 | −29.30% |
| Chunbo, H1 2026 | KOSDAQ 278280 | 6M to Jun 2026 | −7.87% |
Margins are operating profit divided by revenue as filed, calculated by me from figures on StockAnalysis and from Korean regulatory filings. Fiscal year ends and reporting currencies differ across the table, and the last row covers six months while every other row covers twelve. I have not converted anything; these are ratios of each company’s own numbers in its own currency.
The three shaded rows are the bottom three, and all three are Korean. That is the finding I did not expect. Two Chinese producers and two Japanese ones sit in a band between roughly 7 and 13 percent. The Korean companies sit at 5.38, 2.77 and negative 29.30. Whatever is happening to electrolyte margins is not happening evenly across the region.
There is corroboration from the other direction. Shanghai Metals Market reviewed listed-company half-year results on August 17, 2026 (Mon) and reported Tinci Materials posting net profit growth above 900 percent for the first half of 2026, with Do-Fluoride up several times over. That is the same six months in which Chunbo’s operating margin went negative.
Chunbo stock against its own market and its own industry
Over the 244 trading days from August 21, 2025 to August 21, 2026 (Fri), Chunbo fell 23.24 percent. KOSDAQ rose 3.18 percent. The electrical-equipment sector index I use, equal-weighted across 65 constituents with Chunbo itself excluded, rose 2.75 percent. So the shares trailed the market by 26.42 percentage points and the industry by 25.99 percentage points.
Splitting that first figure is the part worth keeping. Of the 26.42 points of underperformance against the market, the industry accounts for 0.43 points. The company accounts for 25.99. In proportional terms the industry explains 1.6 percent of the gap. Within the sector Chunbo ranked 40th of 65 names, in the 61.5th percentile, against a sector median of negative 13.64 percent, with 25 constituents ahead of it. Beta against the market was 0.991 and correlation 0.642.
I want to be careful about what that does and does not say. It says the drawdown was company-specific. A sector move would not split this way, and that is consistent with the margin table above. It does not say the company is worse than its peers on any operating measure; a percentile rank measures returns; it does not measure earnings. But when the sector explains 1.6 percent of a 26-point gap, the industry-condition explanation gets harder to hold.
The demand side did not break
If this were a demand story, the cell makers would show it. They do not. Korea JoongAng Daily reported on July 30, 2026 (Thu) that all three Korean cell manufacturers turned an operating profit in the second quarter, with SK On profitable for the first time since the third quarter of 2024, on a shift from electric vehicles toward energy storage. LG Energy Solution guided to energy-storage volumes up more than 50 percent in the third quarter.
The materials end of that supply chain looks nothing like the cell end. The Elec counted on August 19, 2026 (Wed) that of 17 listed Korean battery-materials companies, 10 posted operating losses in the second quarter of 2026, with separator and copper-foil makers loss-making across the board and most electrolyte companies in the same position. So the Korean materials end is under pressure as a group. What the peer table adds is that the group under pressure is a national one and not a global one.
Depreciation is the part of this I have been slow to take seriously. For most of the time I have followed materials companies I have treated a margin inversion as a message about demand, because that is what it usually is in the businesses I came up on. It took lining up a rising revenue line against a falling margin line in the same six months to make me accept that a cost base can invert a margin entirely on its own, with the order book untouched. I had the arithmetic available all along and I was reading it for the wrong signal.
What Chunbo stock has been valued at by people who cover it
Coverage is not thin, which makes a change from most of the small caps I look at. In May 2025 the published valuations sat between KRW 40,000 and KRW 70,000; by January 2026 the band had narrowed to KRW 50,000 to KRW 56,000. Individually: Samsung Securities’ Jang Jung-hoon and Suh Ji-hyun moved to KRW 40,000 from KRW 49,000 on May 19, 2025; Shinyoung Securities’ Park Jin-soo moved to KRW 45,000 from KRW 83,000 and Eugene Investment’s Han Byung-hwa to KRW 70,000 from KRW 100,000, both on May 28, 2025; Park raised his figure 33 percent to KRW 60,000 on December 9, 2025; Kiwoom Securities’ Kwon Jun-soo opened 2026 at KRW 52,000 on January 2, 2026 (Fri); iM Securities’ Jung Won-seok and Samsung’s Jang were carried at KRW 50,000 and KRW 56,000 in early-January tallies; and Mirae Asset’s Kim Chul-joong and Jung Se-hoon went the other way in mid-April 2026, to KRW 79,000 from KRW 68,000.
The current KRW 33,850 is 15.38 percent below the lowest figure in that list and 57.15 percent below the highest, both by my calculation. Of the eight items where I could confirm a number, I read one original report, the Samsung Securities note of May 19, 2025, and took the other seven from Korean press coverage. Two further reports, from Samsung on August 14, 2026 (Fri) and Shinyoung on August 18, 2026 (Tue), appear in the filing index without figures I could verify. Those are the two I most wanted, since they follow the half-year report.
Where I think I could be wrong about Chunbo stock
Five things, hardest first.
- A margin comparison across different fiscal years is a blunt test. Two of my seven rows close in March and five in December, and the last row is six months long while the rest are twelve. If the Japanese companies’ March 2026 years captured a better stretch of input pricing than the December 2025 years did, part of my ordering is calendar and not performance. I could not remove that effect without quarterly filings I do not have for all seven.
- The plant is the whole argument on the other side. Saemangeum was supposed to be running in late 2025 and started in the first half of 2026. A line that is depreciating without producing is the textbook temporary margin problem. If utilisation climbs, the cost line moves back on its own and none of this needed explaining.
- I never saw a utilisation figure. Not one. Everything above about fixed-cost absorption is inference from the timing of the capital spending and from what Korean analysts said in January 2026. The company has not published a rate I could cite, and I did not find one.
- Input prices cut both ways. Mirae Asset’s April 2026 work expected roughly 20 percent of the raw-material increase to pass into selling prices in the second half. If that happens on schedule, the same cost line that inverted the margin reverses it.
- The Enchem row makes my national grouping look worse than it is. Negative 29.30 percent is an outlier by any measure, and putting it in the same shaded block as Chunbo’s 2.77 percent implies a similarity I have not demonstrated. Foosung at 5.38 percent is closer to Central Glass at 6.94 than it is to Chunbo. The bottom three are Korean, and that is a real fact, but the three are not one thing.
Numbers on my screen that I left out
Book value per share of KRW 36,568 would not reconcile. Dividing owners’ equity of KRW 451.97 billion at the end of June 2026 by 12,254,062 shares gives KRW 36,883, and multiplying the screen figure by the share count gives KRW 448.11 billion, off by 0.86 percent. So I dropped the 0.93 price-to-book that derives from it. The dividend fields are stale in a way that matters: the last declared payment was KRW 500 per share for the 2022 fiscal year, yet the screen still carries a three-year growth streak. And an interest-expense line for 2025 implies an effective rate above 20 percent against the company’s total liabilities, which does not fit a structure built on zero-coupon paper, so I left it out of the argument entirely and flagged it for checking.
Here is where I land. Chunbo grew revenue by a third and lost sixteen points of operating margin in the same six months, and when I put seven electrolyte-materials filings in one column the three at the bottom were all Korean. That combination reads to me as a cost problem specific to a plant that is depreciating before it is producing. It does not read as a market that stopped wanting the product. But every part of that sentence rests on inference, because the one number that would settle it is a utilisation rate, and Chunbo has not published one.
So I am not going to pretend I have a view I can defend. What I have is a measurement I cannot complete. The day this company publishes an operating rate for the Saemangeum lines, or reports a quarterly gross margin above zero, the gap in this piece closes and the argument stops being an inference. It becomes a measurement. Until one of those two things is on a filing, I am watching, and I am writing down what I could not find so that the next version of this can be scored against it.
Prices and market value reflect the August 21, 2026 close as I checked them at the time of writing, on the morning of August 24, 2026 (Mon) in Seoul, using the prior trading day because the Korean market had not opened. Korean won is the reference currency throughout; the single USD conversion used above is approximate, at roughly KRW 1,386.5 per dollar on the same August 21 date. Financial figures are consolidated as filed with Korea’s Financial Supervisory Service. Share count is 12,254,062 per my data vendor; Korean press reported 12,253,025 in early July 2026, and the difference is consistent with continuing convertible-bond conversions in between.
Related entries in the same materials chain: Foosung, which makes the LiPF6 salt Chunbo buys, turned over 30 percent of its shares in a single session. ENF Technology beat the index and lost to its own industry over the same window.