Cuckoo Homesys Dividend: One Payout, Three Different Yields
I started with a narrow question about the Cuckoo Homesys dividend. The payout is 1,200 won a share, or USD 0.89 at the September 30, 2026 Seoul close of 1,352.8 won to the dollar. Every screen I opened agreed on that figure. Yet the yields disagreed: 5.04 percent on one, 4.94 percent on a second page of the same vendor, 5.02 percent on a third. One payout cannot produce three yields unless the prices underneath them differ, so I worked backward from each percentage to the price it implies.
Dividing 1,200 by 0.0504 gives 23,809 won. The September 23 close was 23,800 won, and 1,200 divided by that is 5.0420 percent, which rounds to the printed figure. Dividing by 0.0494 gives 24,291 won, and the same vendor prints 24,300 won in a field named current price. Only the third value, 5.02 percent, used the September 30 confirmed close of 23,900 won, or USD 17.67. That finding sent me through the rest of the screen. I opened twelve named figures, asked what each name promises, and checked what each field actually carries. Four names matched. Eight did not.
Twelve named figures, opened one at a time
Four names that matched their contents
Payout ratio 22.51 percent. Cash dividends of KRW 26.907bn divided by KRW 119.513bn of profit attributable to owners gives 22.5139 percent.
Paid-in capital KRW 2.244bn. A face value of 100 won times 22,436,214 shares comes to KRW 2.2436bn.
Interest coverage 51.17 times. First-half operating profit of KRW 95.276bn over interest expense of KRW 1.862bn gives 51.1686 times.
The 250-session low of 20,150 won, which two outside screens print as their 52-week low to the won.
Eight names that did not
Current price 24,300 won is the September 30 intraday high. The confirmed close was 23,900 won.
Market capitalization KRW 545.2bn is that high times the share total. On the close it is KRW 536.2bn.
A close of 24,000 won on an outside screen, whose own market cap, P/E, P/B and yield all reconcile to 23,900 won instead.
Precise EPS 5,328.95 won is the 24,300 won high divided by a rounded P/E of 4.56 times.
Free float 22,437,000 shares exceeds the 22,436,214 shares outstanding by 786.
Enterprise value 0.46 cannot be the enterprise value of a KRW 536.2bn company. I could not identify what it carries.
A dividend page printing a current price of 0 won and a debt-to-equity ratio of 0.0 percent, when the real ratio is 23.2883 percent.
Raw payout ratio 29.8 percent would need KRW 90.292bn of profit under the KRW 26.907bn of dividends, and no filed profit figure equals that.
Where I stand: watching, no position. The payout has risen six years running and the 22.51 percent payout ratio leaves room. Against that, first-half overseas revenue fell 9.179 percent to KRW 196.9bn from KRW 216.8bn, and I found no named 2026 full-year sell-side estimate for this company. I reassess when the third-quarter filing lands, due November 16, 2026.
Contents
What the Cuckoo Homesys Dividend Actually Pays
Cuckoo Homesys trades on the KOSPI under 284740. The KOSPI is the senior board of the Korea Exchange, where the larger and longer-listed Korean companies sit, while the KOSDAQ is the growth board below it. At 23,900 won a share and 22,436,214 shares, this company is worth KRW 536.2bn, or about USD 396m. That places it well outside the hundred largest Korean listings, which is the reason my stance on it is fixed at watching before I open a single line of the financials.
The payout history is clean. Per-share dividends went 650 won, 700 won, 800 won, 1,000 won and 1,200 won across the 2021 through 2025 fiscal years, a compound rise of 16.5647 percent a year over those four steps. Total cash paid out moved with it, from KRW 14.575bn to KRW 26.907bn. That matters more than the per-share path on its own: when the per-share figure and the total move by the same percentage, the share total did not change, so the increases were dividend decisions and not the arithmetic side effect of a split or a buyback.
A Korean year-end dividend is decided months after the year it belongs to
One feature of the Korean calendar matters for every yield on this page. A year-end dividend here carries a December record month, but the board sets the amount and the shareholders approve it the following March. So the 1,200 won attached to the 2025 fiscal year was settled in the first quarter of 2026 and will be compared against prices for the rest of 2026. A screen that prints a yield is therefore always pairing a payout fixed in March with a price from whenever that screen last refreshed. The gap I found is not exotic. It is what happens when the refresh dates are not written down beside the percentage.
| Fiscal year | Dividend per share | Total cash dividend | Payout ratio | Yield as filed |
|---|---|---|---|---|
| 2021 | 650 won | 14,575 | 12.78% | 1.68% |
| 2022 | 700 won | 15,696 | 13.68% | 2.20% |
| 2023 | 800 won | 17,938 | 14.49% | 3.70% |
| 2024 | 1,000 won | 22,422 | 17.65% | 4.80% |
| 2025 | 1,200 won | 26,907 | 22.51% | 4.70% |
Three Yields for One Cuckoo Homesys Dividend
The spread between the highest and lowest yield I collected is small in absolute terms. From 5.04 percent down to the 4.70 percent that the annual filing reports for the 2025 fiscal year, the gap is 0.34 percentage points, which is 7.234 percent of the smaller figure. I want to be clear that I am not treating this as a scandal. What interests me is that the three current yields point to three different trading days, and none of the screens says which day it used.
I ran the same test on a peer to see whether this is particular to one Korean mid-cap. De’Longhi, the Italian-listed appliance maker, pays twice a year. One screen gives its dividend yield as 3.24 percent and another as 2.22 percent, a gap of 1.02 percentage points or 45.9459 percent of the smaller value. Their annual dividend figures differ the same way, 1.25 euros against 0.85 euros, a 47.0588 percent gap that looks like one screen annualizing a single semiannual payment while the other adds both. Their payout ratios, by contrast, agree almost exactly at 58.16 percent and 58.162 percent. I did not compare multiples, scale or growth between the two companies. I used De’Longhi for one purpose only: to see how many values one metric name can carry elsewhere. On that single test, 7.234 percent is the narrower spread.
A Korean price feed disagreeing with itself is something I have run into before, and the gap is usually narrow enough to survive a quick glance.
A Cuckoo Homesys Dividend Yield Priced Off the Day’s High
The larger problem sits one level up from the yield. The indicator screen prints a current price of 24,300 won and a market capitalization of KRW 545.2bn. Dividing that market cap by 22,436,214 shares returns exactly 24,300 won, so the market cap is built on the current price. The confirmed daily bar for September 30, 2026 reads open 23,800 won, high 24,300 won, low 23,750 won, close 23,900 won. The current price is the high of the session.
Rebuilding on the close puts market capitalization at KRW 536.2bn, which is KRW 8.97bn or 1.6737 percent lower. The size of that error is not the point. The number of figures carrying it is. P/E falls from 4.56 times to 4.4866 times, P/B from 0.5024 times to 0.4941 times, precise EPS loses its basis entirely because it was the high divided by the rounded P/E, and the 4.94 percent dividend yield turns out to be 1,200 won over the same high. Five published figures inherit one wrong price.
The screen that printed 24,000 won argues against itself
Two outside hosts print a September 30 close of 24,000 won, up 200 won or 0.84 percent. Their close, change and session low match to the character, so I treated them as one source and not two. What decided the question was the rest of one of those pages. Its market capitalization of KRW 536.3bn divided by the share total gives 23,903 won. Its P/E of 3.95 times against its own EPS of 6,057 won works out at 23,900 won. Its P/B of 0.49 times against its own BPS of 48,340 won works out at 23,900 won. Its yield of 5.02 percent is 1,200 won over 23,900 won. Four figures on that page point to 23,900 won and only the field named close points to 24,000 won.
So I adopted 23,900 won. An outside market cap and three outside multiples, each divided back by inputs I built myself, all converged on it, and the confirmed exchange bar carried the same value with a single market scope and no provisional rows. Every percentage in this piece uses 23,900 won. Picking one close out of four candidates is a routine I have had to run before, including on the Coway share purchase window that closed on September 8, where a single price moved the stake percentage in a filing.
Where the Cuckoo Homesys Dividend Earns Its Money
Six straight raises can make a reader stop asking where the cash comes from, so I went looking. Korean interim filings report flow items as year-to-date cumulative figures, which means the first-half numbers below cover January through June and are not a single three-month period. Consolidated first-half revenue was KRW 591.312bn against KRW 565.149bn a year earlier, up 4.6294 percent. Operating profit rose to KRW 95.276bn from KRW 84.252bn, up 13.0846 percent, lifting the margin from 14.9079 percent to 16.1126 percent. By those three lines it was a good half.
Split by geography it reads differently. Overseas revenue in the same half fell to KRW 196.9bn from KRW 216.8bn, down 9.179 percent, and the overseas share of the group dropped from 38.3616 percent to 33.2988 percent. Malaysia accounts for most of the decline, falling 10.3325 percent to KRW 175.3bn from KRW 195.5bn, although Malaysian net profit rose 7.4 percent to KRW 19.5bn from KRW 18.2bn. Revenue there shrank while profitability improved.
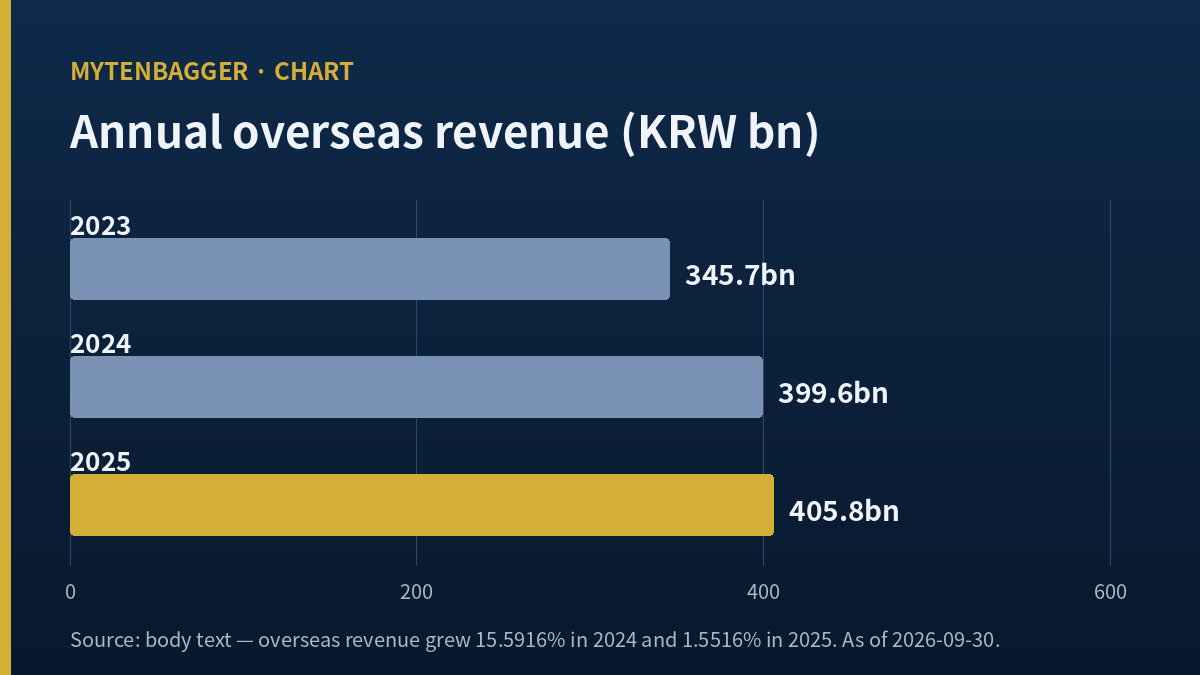
The United States and India are small and losing more. The US unit turned over KRW 17.1bn in the half with a net loss of KRW 2.0bn, widened from a KRW 0.3bn loss a year earlier. India turned over KRW 0.7bn with a KRW 0.7bn net loss. Together the two are 3.0103 percent of first-half consolidated revenue of KRW 591.312bn, too small to threaten the 2025 payout of KRW 26.907bn. The trend behind them is what I noted: annual overseas revenue grew 15.5916 percent in 2024, then 1.5516 percent in 2025, then turned negative in the first half of 2026. A capital structure that quietly changes while the headline improves is the pattern I tracked in how borrowed cash built Shinsung Delta Tech’s new plants, another company in the same Korean sector bucket.
| Line | H1 2025 | H1 2026 | Change |
|---|---|---|---|
| Consolidated revenue | 565.149 | 591.312 | up 4.6294% |
| Consolidated operating profit | 84.252 | 95.276 | up 13.0846% |
| Overseas revenue | 216.8 | 196.9 | down 9.179% |
| Malaysia revenue | 195.5 | 175.3 | down 10.3325% |
| United States revenue | 17.9 | 17.1 | down 4.5% |
| India revenue | 0.4 | 0.7 | up 75.0% |
Which Names Kept Their Promise and Which Broke It
Four of the twelve matched, and I listed them at the top. Three of the four I verified by doing the division myself to four decimal places. The fourth, the 250-session low of 20,150 won, I verified against two outside screens that print the same 52-week low to the won. That is the strongest confirmation of a basis string I have had on this kind of audit, because a stated window and an outside window agreeing exactly is hard to produce by accident.
The highs do not agree. The 250-session high reads 27,950 won, one outside screen gives a 52-week high of 27,300 won and another gives 28,950 won. Three values. I did not score this as a broken name, because 250 trading sessions and 52 calendar weeks cover different stretches and a high is far more sensitive to window length than a low. I record the three figures and leave the discrepancy attributed to window length alone.
Free float above shares outstanding, by 786 shares
The simplest break is the free float. A free float of 22,437,000 shares sits above 22,436,214 shares outstanding by 786 shares, and a float cannot exceed the total issued. Rounding 22,436,214 up to the nearest thousand gives exactly 22,437,000, so I tested that rule on another company in the same sector bucket. That one shows 27,482,815 shares outstanding and a float of 27,484,000, while rounding up gives 27,483,000. One rule does not explain both, so I used the field for nothing.
A field named precise gave me nothing extra
A multiple built on the wrong input is the trap I worked through in why Kyungdong Navien fell 11.3 percent on its beat day, where the P/E on the screen belonged to a fiscal year the market had already moved past. Here the fiscal year is right and the trading day is wrong, which is the smaller error and the harder one to see.
Precise EPS of 5,328.95 won is 24,300 won divided by a P/E of 4.56 times, and the vendor states that basis in an adjacent field, so nothing is concealed. The difficulty is circularity: a figure derived from a P/E cannot test that P/E. The same screen marks its P/E as cross-verified, and arithmetically it is, since 24,300 won over the integer EPS of 5,327 won gives 4.5617 times, within 0.04 percent of the printed 4.56 times. Both sides of that check came from the same price, so it is not an independent test of anything. For reference, the figure in the annual filing is 5,330 won per share, three won from the integer EPS.
Book value per share was built from equity six months old
The two screens give BPS of 48,367 won and 48,340 won. Owners’ equity at December 31, 2025 was KRW 1,084.631bn, and dividing that by the current share total gives 48,342.87 won, so both figures were built from that date. Owners’ equity at June 30, 2026 had risen to KRW 1,142.709bn, which gives 50,931.45 won. On the adopted close, P/B is 0.4941 times by the screens and 0.4693 times by my own arithmetic, so the screens run 5.3021 percent higher. In a company whose equity is growing, stale equity makes the stock look dearer than it is.
Figures Behind the Cuckoo Homesys Dividend That I Set Aside
Writing down what I collected and discarded keeps me honest. First, the field named enterprise value, carrying 0.46. A company worth KRW 536.2bn cannot have an enterprise value of 0.46, and multiplying 0.46 by trailing revenue of KRW 1,121.342bn gives a plausible KRW 515.8bn, but the same calculation on the sector peer produces a figure in the tens of trillions, so no rule survives. Unused.
Second, the raw payout ratio of 29.8 percent. Reversing KRW 26.907bn of dividends through that percentage requires KRW 90.292bn of profit. Consolidated net profit was KRW 134.319bn, profit attributable to owners was KRW 119.513bn and separate-entity net profit was KRW 118.740bn. None is KRW 90.292bn. Reversing through the 1,200 won per share instead gives 4,026.8 won, which matches no EPS I can find. Unused.
Third, both return-on-equity figures. One screen says 11.7 percent and the other 12.5 percent. The second reconciles to an EPS of 6,057 won and an ROE of 12.5 percent sharing a single profit figure of KRW 135.896bn, and that profit appears in no filing. The first, 11.7 percent, I could not reproduce on either a consolidated or an owners’ basis. So I use only what I derived: profit attributable to owners of KRW 119.513bn for 2025 over the average of owners’ equity at the two year-ends, KRW 1,013.307bn, gives 11.794 percent. That is my figure with my basis stated, and it is the only ROE in this piece.
Fourth, full-year estimates. I could not find a named analyst with a published 2026 revenue or operating profit estimate for this company. What exists is coverage from 2020 and 2021, and estimates that far across fiscal boundaries are not usable. The closest named 2026 document is a June 29, 2026 report on the listed holding company, which treats Cuckoo Homesys as an investment asset and notes a change of the appliance-sector multiple reference to 8.7 times on 2027. I am recording this coverage gap as a gap, and it is the single largest hole in this piece.
The Cuckoo Homesys Dividend Scored 7 of 7, and I Still Watch
One more figure deserves its own section because it is the first of its kind I have recorded. The seven-metric screening checklist on my data source returned 7 of 7, a score of 100, with zero items marked unresolvable. Revenue scale of KRW 1,121.342bn clears its threshold, operating margin of 15.11 percent clears 5 percent, EPS of 5,327 won is positive, ROE of 11.7 percent clears 10 percent, P/E of 4.56 times sits inside the 0 to 15 band, P/B of 0.50 times sits inside the 0 to 1.5 band, and operating profit of KRW 169.362bn is positive. Across the companies I have run through this screen, every previous one left at least one item short.
Two of those seven inputs came from the 24,300 won high, so I rebuilt them: 4.4866 times and 0.4941 times, both still inside their bands. The score is therefore real and survives the price correction, and I want to say so plainly instead of discounting a result that happens to disagree with my stance. What the score cannot carry is a direction. It reads one moment of one balance sheet and one trailing income statement. It has no field for overseas revenue falling 9.179 percent in a half year, no field for an absent 2026 estimate, and no field for an operating cash flow of KRW 7.466bn against dividends of KRW 26.907bn. My stance rests on the three things the score does not look at.
Five Objections and the Smallest Check for Each
Here are the five ways I could be wrong, each with the smallest observation that would settle it against me.
One. A 1.67 percent price error is not worth a piece. The gap between 24,300 won and 23,900 won is 1.6737 percent, which is small. The check is how many figures hang on it: market cap, P/E, P/B, precise EPS and the 4.94 percent yield all came from that price, so one small error is published five times in the same direction.
Two. A 22.51 percent payout ratio means 1,200 won is safe. On profit it is. The check is cash. First-half operating cash flow was KRW 7.466bn and full-year 2025 operating cash flow was KRW 8.710bn, against total dividends of KRW 26.907bn. A rental company lays out equipment first and collects fees over years, so thin operating cash is structural here. Still, if cumulative operating cash flow in the third-quarter filing does not reach half of KRW 26.907bn, this objection weakens.
Three. Domestic growth can cover a shrinking overseas business. In the first half of 2026 it did. Overseas fell KRW 19.9bn while consolidated revenue rose KRW 26.163bn, implying domestic revenue rose more than KRW 46bn. The check is where that came from. If the third-quarter filing shows the domestic rental account total flat or lower while domestic revenue rises, the gain came from pricing, and pricing works once.
Four. Broken names belong to the vendor and never to the company. Correct for seven of the eight. The check is the remaining one: the profit figure behind the 29.8 percent raw payout ratio appears in no company filing I examined, so if someone shows me the filed table it came from, this objection gets stronger and my list of eight becomes a list of seven.
Five. At KRW 536.2bn and a 4.49 times P/E this is simply cheap. The seven-metric checklist on my data screen scored 7 of 7, which is the first perfect score I have recorded on this corpus. The check is the inputs. The P/E of 4.56 times and P/B of 0.5024 times came from the 24,300 won high, and rebuilding them on the close gives 4.4866 times and 0.4941 times, both still inside the thresholds. The score survives the price correction, so I am not disputing it. I am noting what the score does not contain, which is the direction of overseas revenue.
My Position on the Cuckoo Homesys Dividend and Three Checks for November 16, 2026
I hold no position and I am watching. The statutory deadline for the third-quarter report is November 16, 2026, and Korea publishes no separate fourth-quarter report at all, so this filing is the last scheduled disclosure before the annual one and the next time these figures move. Three things I will take from it.
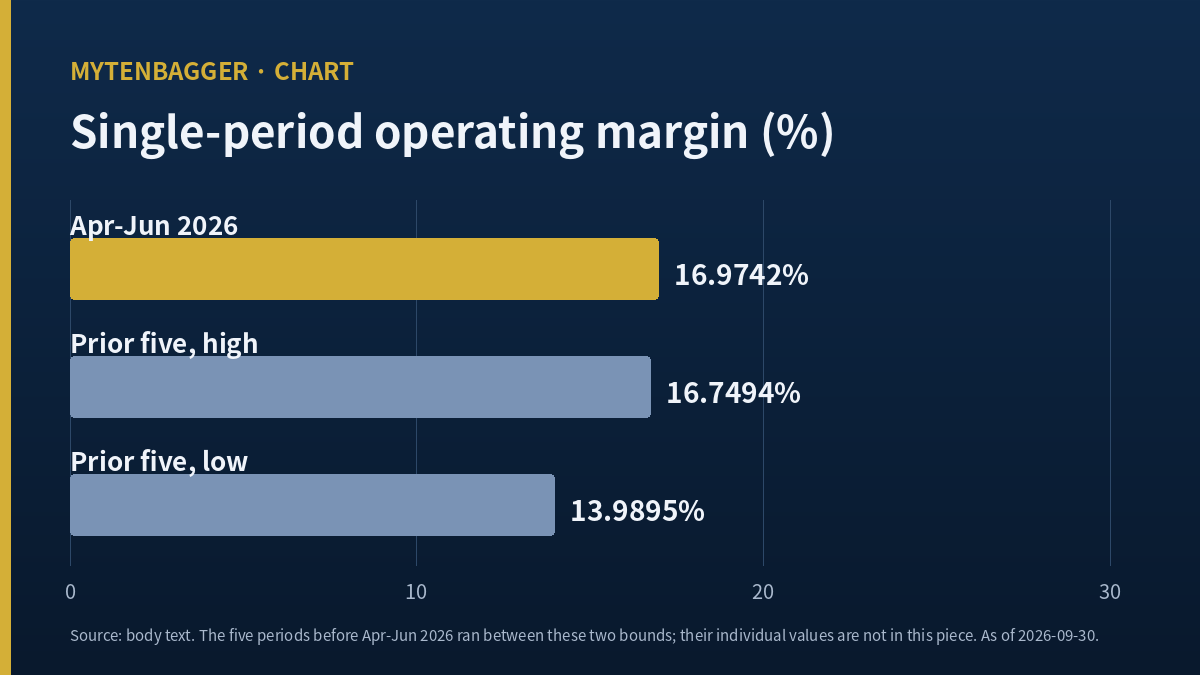
First, whether the single-period operating margin for July through September clears 16.9742 percent. April through June reached that level, and the five periods before it ran between 13.9895 percent and 16.7494 percent. Second, whether cumulative overseas revenue closes the gap against the prior year. The first half was 9.179 percent behind, and the direction of that gap is the direction of dividend capacity. Third, whether cumulative operating cash flow passes half of the KRW 26.907bn paid out for 2025.
Which single field would delete half of this piece
Half of what I wrote above disappears the moment one vendor puts a closing price into the field named current price. Market capitalization, P/E, P/B, precise EPS and the 4.94 percent yield would all reclaim their names at once, and five of my reverse calculations would become unnecessary. One field name was generating more than half of the eight breaks.
What survives that fix is the part that belongs to the company. First-half overseas revenue of KRW 196.9bn is below the KRW 216.8bn of a year earlier no matter which screen is corrected. The 1,200 won per share rising for six straight years survives too, and so does the fact that a third of the revenue paying for it comes from outside Korea. All three of the checks I set for November 16 sit on that side of the line. Fixing a screen is the vendor’s work. Lifting KRW 196.9bn back above KRW 216.8bn is the company’s.
Sources
- Cuckoo Homesys interim report for the first half of 2026 and annual reports for 2022 through 2025, filed with Korea’s Financial Supervisory Service (consolidated income, equity and dividend schedules).
- Chickstock, Cuckoo Homesys quote page, as of September 30, 2026 (close, market cap, P/E, P/B, EPS, BPS, dividend yield).
- Hankyung Markets, Cuckoo Homesys quote, September 30, 2026 session close (close, session high and low, volume, 52-week range).
- Datanews, September 18, 2026, on Cuckoo Homesys overseas revenue and its US and India units (Korean press).
- Newspim, June 29, 2026, NH Investment and Securities analyst Lee Seung-young on the listed holding company (Korean sell-side, cited for the appliance-sector multiple reference).
- Google Finance, Cuckoo Homesys, as of August 18, 2026, used only to cross-check the 52-week range.
- Stock Analysis, De’Longhi dividend page (last updated May 18, 2026) and Investing.com, De’Longhi dividends, for the two peer yield values.
- Luxrix indicator and daily-bar queries, Kiwoom data, priced on the September 30, 2026 close. Indicator screen refreshed September 30, 2026 at 17:08 KST.
- Money Today, September 30, 2026: all dollar figures here use the Seoul foreign exchange market daytime close of USD/KRW 1,352.8 on September 30, 2026, reported identically by three Korean outlets.