Shinsung Delta Tech Stock Built Its Plants On Borrowed Cash
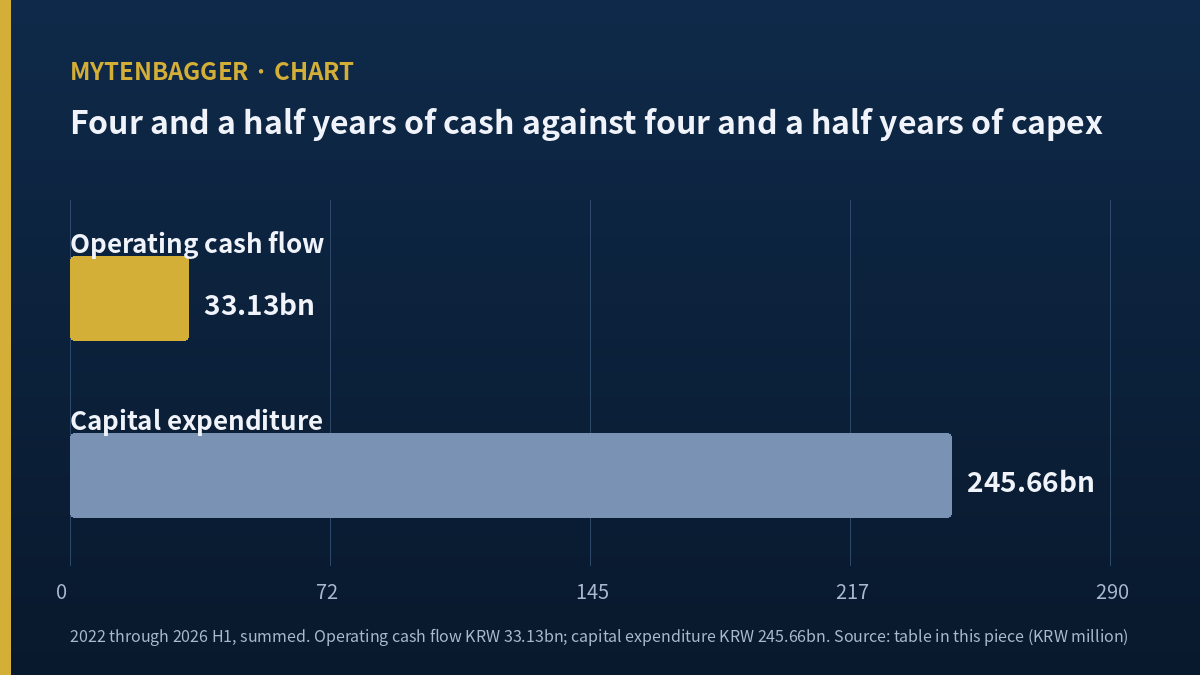
I do not own Shinsung Delta Tech stock and I have no order working in it. What pulled me into the filings was one number that no annual report prints: between 2022 and the first half of 2026, this Korean parts maker took in KRW 33.13 billion of operating cash, roughly USD 24.37 million, and spent KRW 245.66 billion, roughly USD 180.71 million, on plant and equipment. The gap runs to KRW 212.53 billion, about USD 156.34 million, and it sits beside a balance sheet where total liabilities grew by KRW 296.95 billion, about USD 218.44 million, over the same stretch.
Every one of those annual figures looks ordinary on its own. That is the part worth reading. I had to stack four and a half reporting periods on top of each other before the pattern showed up at all.
Contents
What Shinsung Delta Tech stock is attached to
The company trades on KOSDAQ under the code 065350. KOSDAQ is the junior board of the Korea Exchange, separate from the main KOSPI board, and it carries the country’s smaller industrial and technology names. Liquidity there is thinner than on KOSPI and research coverage is thinner still, which becomes the central problem of this write up further down.
The business has three legs. Home appliance components are the oldest and largest, feeding washing machines, dryers, refrigerators and vacuum cleaners. A second leg makes parts for electric vehicle batteries and energy storage through subsidiaries with operations in Poland and China. A third leg runs logistics services. Korean trade press described that mix in 2023 and the structure has held since. I had filed this company mentally under appliance components for a long time, and that filing is exactly what kept me from looking at the cash flow statement.
My price basis is the confirmed regular session close of KRW 31,100 on 2026-09-15 (Tuesday), which is USD 22.88 at the exchange rate used throughout this piece. Multiplied by 27,484,800 shares outstanding, market capitalization comes to KRW 854.78 billion, or USD 628.79 million. All currency conversions here use KRW 1,359.40 per USD, the Seoul close reported by Korean press for 2026-09-15, and I use that one fixing everywhere.
Shinsung Delta Tech stock and a peer that covers interest just as thinly
I picked the global comparison first this time, before I had finished the Korean arithmetic, and I picked it on one criterion only: a company attached to the same end demand whose interest coverage is published. Whirlpool qualifies.
| Measure | Whirlpool | This company |
|---|---|---|
| Interest coverage | 1.19 | 1.2110 |
| Operating margin | 2.75 percent | 2.9289 percent |
| Price to book | 0.56 | 3.4331 |
| Price to earnings | 11.86 | 39.55 |
Whirlpool figures come from a stock statistics page refreshed 2026-09-15 (Tuesday). The Korean interest coverage is the first half of 2026 and the operating margin is full year 2025. The two multiples come from a Kiwoom data screen.
The same measure means something else here
Take Whirlpool’s coverage of 1.19 on its own terms first. A company with USD 14.92 billion of trailing revenue earns 1.19 times its interest bill from operations. Now apply the same measure to a Korean supplier with revenue of KRW 945.36 billion, about USD 695.43 million, and the answer is 1.2110. The two land on top of each other. Operating margins land close too, 2.75 percent against 2.9289 percent.
Then the valuations separate. Price to book runs 0.56 against 3.4331, a factor of 6.13. Price to earnings runs 11.86 against 39.55, a factor of 3.33. Two companies whose income statements wear almost the same proportions carry prices that differ by six times on assets. That divergence is the whole reason I kept reading.
On the Whirlpool numbers I reproduced two and failed on two, and I am naming both. Share price of USD 34.00 times 65.20 million shares gives USD 2,216.80 million against a screen reading of USD 2.22 billion, and USD 34.00 over book value per share of USD 60.49 gives 0.56207. Net margin and return on equity did not come back. Net income of USD 170.00 million over revenue of USD 14.92 billion works out to 1.1394 percent while the page prints 1.25 percent, and return on equity comes to 4.3104 percent against a printed 5.93 percent. Neither of those two entered the table above.
Adding the columns behind Shinsung Delta Tech stock
Here is the Korean arithmetic, laid out by period. Amounts are in millions of Korean won. The last row covers six months, not a full twelve.
| Period | Operating cash flow | Capital spending | Difference |
|---|---|---|---|
| FY2022 | -2,907 | 47,589 | -50,496 |
| FY2023 | 36,100 | 33,334 | 2,766 |
| FY2024 | 922 | 31,445 | -30,523 |
| FY2025 | 14,375 | 94,458 | -80,083 |
| First half 2026 | -15,356 | 38,837 | -54,193 |
Consolidated, taken from the half year report filed 2026-08-14 and the annual report filed 2026-03-17 with the Korean regulator. Units are millions of Korean won.
The left column sums to 33,134. The middle column sums to 245,663. The difference is 212,529, which means 86.5124 percent of what went into plant did not come out of operations. I ran that division myself and the inputs are the ten cells above.
I resisted one temptation while doing this. The final row is half a year, and doubling it to build a clean annual figure would have made the table tidier. I did not, because capital spending here moves within a single year. First quarter 2026 spending was 18,038 and second quarter was 20,799, and operating cash flow swung from negative 13,732 in the first quarter to negative 1,624 in the second quarter alone. Doubling six months would magnify that unevenness instead of smoothing it. So the total stays labeled four and a half years everywhere it appears.
Where the money behind Shinsung Delta Tech stock is visible instead
An income statement will not say where KRW 212.53 billion came from. Two dated balance sheets will. Total liabilities went from KRW 413.36 billion at the end of 2022 to KRW 710.30 billion at 2026-06-30, an increase of KRW 296.95 billion or USD 218.44 million. Total assets rose by KRW 464.14 billion, about USD 341.43 million, and total equity rose by KRW 167.19 billion, about USD 122.99 million.
The liability increase is 139.7202 percent of the cash shortfall. There is no reason those two should match exactly, and they do not. Working capital absorbed money too, with inventory alone climbing from KRW 70.85 billion at the end of 2022 to KRW 130.08 billion at the half year mark. My claim is narrower than a match. It is that borrowings of the right order of magnitude actually arrived on the balance sheet during the same window. Without them, the plant spending would have had to be smaller.
One more line from the same filings belongs here, because it shows how far the consolidated picture can sit from the shareholder’s picture. In FY2024 consolidated net income was 7,449 million won, a positive number. Profit attributable to the owners of the parent that year was negative 995 million won. The subsidiaries earned; the parent’s shareholders did not. Non controlling interests held 34.5423 percent of consolidated equity at that point, and in that particular year they took more than all of the profit. I am not building an argument on this, because it reverses in the next period, with owners taking 84.3476 percent of first half 2026 profit while holding 70.2448 percent of equity. It is simply a reminder that on this balance sheet the consolidated line and the owners’ line can point opposite ways.
What the neighbors on this board taught me first
Three earlier entries in this journal set the habits I bring to a Korean appliance name. In the Coway entry I divided two numbers out of a single filing and found that what I would be paying for had an end date written into it. In the Kyungdong Navien entry a 64.60 percent profit increase met an 11.30 percent single session decline, and I had to put down a rule I had been carrying. In the Daejoo Electronic Materials entry forecasters nailed revenue to within 0.02 percent and missed operating profit by 19 percent.
All three turned on something the income statement failed to explain. This entry does something the other three did not: it takes the income statement out of the explanation entirely and works only with cumulative cash flow against two dated balance sheets. Each of those single year statements is unremarkable, which is precisely why stacking them was the only move available.
Shinsung Delta Tech stock and three years under a coverage ratio of one
Borrowing carries interest, and interest shows up against operating profit. Dividing one by the other across the same five periods produces this.
| Period | Operating profit | Interest expense | Coverage |
|---|---|---|---|
| FY2022 | 32,055 | 27,113 | 1.1823 |
| FY2023 | 29,867 | 31,451 | 0.9496 |
| FY2024 | 27,176 | 46,304 | 0.5869 |
| FY2025 | 27,689 | 34,154 | 0.8107 |
| First half 2026 | 22,741 | 18,778 | 1.2110 |
Millions of Korean won. The coverage column is my own division, and the 1.2110 for the first half of 2026 agrees to two decimals with the 1.21 a Kiwoom data screen carried on 2026-09-16 (Wednesday).
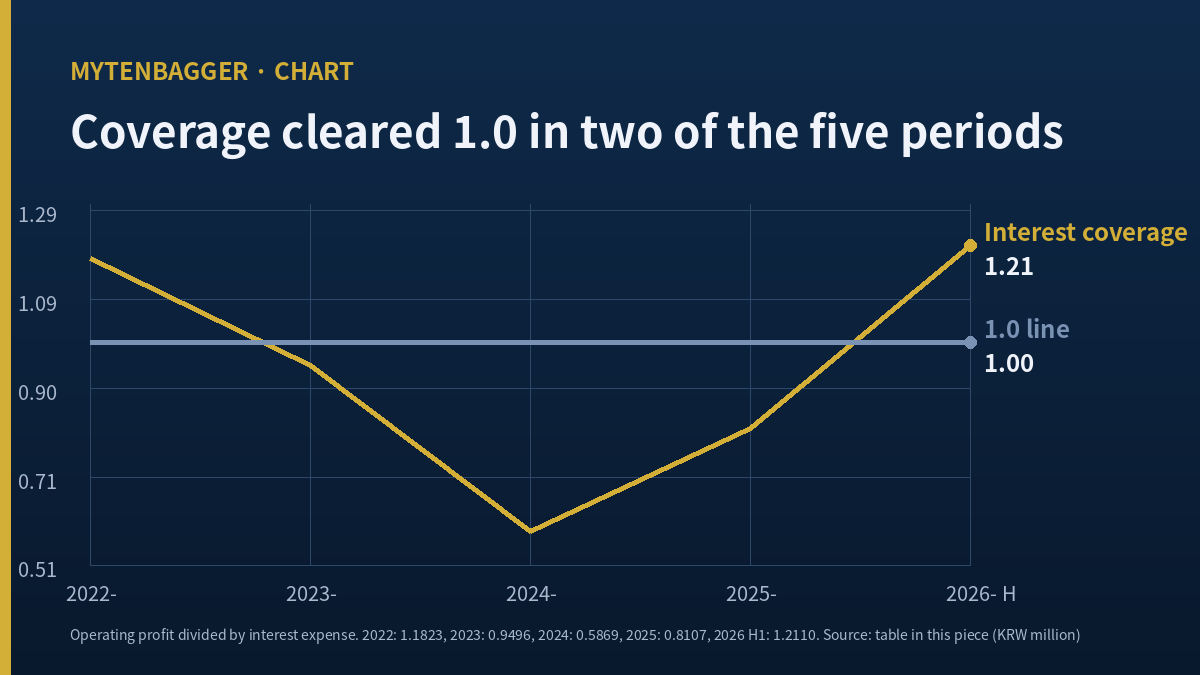
Three of the four completed years sit below one. Through those three years operating profit alone did not cover the interest bill, which means something else did, and the liability growth in the previous section is the visible candidate. FY2024 is the sharpest of them. Interest expense of 46,304 was 1.7038 times operating profit of 27,176 that year.
The half year that turned the ratio around
The direction changes in the most recent filing. First half 2026 revenue of 575,808 is 19.8958 percent above the 480,257 of a year earlier, and operating profit of 22,741 is 33.347 percent above 17,054. Interest expense moved the other way in the same window, falling 15.1047 percent from 22,119 to 18,778. Rising profit met falling interest and the ratio crossed back above one.
Margin recovered with it. The first half operating margin of 3.9494 percent stands 1.0205 points above the 2.9289 percent of full year 2025, and it interrupts a four year slide from 4.0401 percent. What recovered, though, is six months of reporting, and I already explained why six months does not get doubled in this name.
Not one sell side estimate is attached to Shinsung Delta Tech stock
This is the largest hole in the piece and I want it stated plainly, up front, with nothing built around it. A Korean consensus aggregation screen says in plain text that no opinion has been issued on this name within the past three months. The forecast earnings field is empty and the contributing house count field is empty. I could not find a single forward estimate from a named brokerage for this company.
Before writing that sentence I loosened four constraints. I dropped the date filter and went back to 2023. I widened past the financial dailies into industry press and English language outlets. I searched the Korean name, the romanized name and the ticker separately. And I checked whether a report on the listed subsidiary carried a parent comment, which produced one Korean brokerage note dated 2026-04-06 (Monday) covering the subsidiary alone with nothing on the parent. After those four passes I am recording a coverage gap.
The gap cuts both ways. Nobody publishing an estimate does not mean the company is bad; it more likely means a KOSDAQ mid cap draws thin attention. It does also mean every number in this write up is backward looking. There is not one forward tense sentence anywhere in this piece, and that is why.
Screen values I left out of Shinsung Delta Tech stock coverage
An indicator screen hands over more fields than any article should use. My rule is that a field I cannot rebuild from primary data does not enter the text. Here is what I dropped.
An enterprise value field printed 20.72, which is not a magnitude this company can produce, so I read it as a decimal place collapse and dropped it. Fields for operating profit before depreciation, total equity and retained earnings ratio were empty. The dividend picture is subtler. Two tools on the same server give 15.2 and 13.6 for the same fiscal year and both rebuild cleanly from filings. The 15.2 is the KRW 3.30 billion dividend total over KRW 21.72 billion of profit attributable to owners, or 15.1885 percent, and the 13.6 is the same total over consolidated profit of KRW 24.21 billion, or 13.6249 percent. Neither is wrong. Only the basis differs, so no percentage from that field appears in the text.
Book value per share of KRW 9,059 did rebuild. Owners’ equity of KRW 248.99 billion at the end of 2025 divided by 27,484,800 shares gives 9,059.04. Running the same division on owners’ equity of KRW 268.11 billion as of 2026-06-30 gives 9,754.85 instead, a difference of KRW 695.81 per share, which is why the price to book multiple appears only in the peer table and never in my argument.
The price itself split three ways. A screen current price field read KRW 31,250, a price trend field read KRW 31,000, and the most recent row in the daily series was an intraday row for 2026-09-16 (Wednesday) also at KRW 31,000, carrying volume of 12,282 shares against 100,373 the prior session, which is 12.236 percent, with no exchange scope recorded. That last row is not a confirmed close. I fixed the price at the confirmed KRW 31,100 from the prior session. A consensus screen separately printed KRW 30,100 as its prior close, which disagrees with my series for that date; since I cannot settle either as a primary source, both appear here and neither enters a calculation.
Share count splits too. The indicator screen says 27,484,800 and a company profile screen says 27,483,948, a difference of 852 shares. The 2025 dividend total of KRW 3,298,176,000 divided by the per share dividend of KRW 120 returns 27,484,800 exactly, so the first figure governs anything dividend related. At this market capitalization the 852 shares are worth about KRW 26.5 million, which changes no judgment in this piece.
My stance and the four objections that would kill it
My stance is watch and no position. This name sits outside the top hundred Korean companies by market capitalization, and I do not take an ownership stance on names in that band. I watch them. Two conditions would end the watching. Full year 2026 operating cash flow turning positive sends me back to recompute the premise of this article. Full year 2026 interest coverage falling under one again moves me from watching to avoiding.
Below are four arguments against my reading. Next to each I have written which sentence of mine dies first if that argument turns out to be right.
Four objections and the sentence each one kills
First, first half 2026 revenue rose 19.8958 percent and operating profit rose 33.347 percent. The borrowed plant may simply have started running. If that holds, what dies is not my sentence about liabilities filling the gap but the disapproving tone I hung on it. Debt that builds capacity which then earns is a decision that worked.
Second, total assets grew by KRW 464.14 billion across the same window and equity grew by KRW 167.19 billion. Liabilities were not the only line moving. If that holds, what dies is my 139.7202 percent figure as a measure of strain; with assets growing alongside, it reads as a measure of how fast the company got bigger.
Third, non controlling interests rose from KRW 50.53 billion at the end of 2022 to KRW 113.57 billion at 2026-06-30, an increase of KRW 63.04 billion or USD 46.38 million. Outside capital entered at the subsidiary level and that is not borrowing. If that holds, the sentence that dies is my claim that without borrowings the plant spending would have had to be smaller, because a third funding route existed.
Fourth, Whirlpool covers interest 1.19 times. One of the largest appliance companies in the world stands in the same place. If that holds, what dies is the weight I attached to three years under one; an industry clustered near one tells you about the industry and not about this company. I checked exactly one peer and I hold no data on the distribution across the sector. Of these four, the fourth is the cheapest for anyone to verify.
Where this reading of Shinsung Delta Tech stock goes stale first
The conclusions here expire on their own. Writing down which part expires first means whoever updates it later knows what to change. There are three places.
The first is 2026-11-16 (Monday), the statutory deadline for the third quarter report. On that day the last row of the coverage table stops being six months and becomes nine, and whichever way 1.2110 moves is the first number here to age. The second is the annual report due in March 2027, when my cumulative total stretches from four and a half years to five and a half and full year 2026 operating cash flow lands on a single line for the first time. The third has no date at all: the day any named brokerage publishes an estimate, the coverage gap section dies whole.
Whichever arrives first, the two columns I will add again are the same two. Operating cash flow and capital spending.
Sources
- Half year report filed 2026-08-14 (Friday), Korean regulatory filing system
- Annual report filed 2026-03-17 (Tuesday), Korean regulatory filing system
- Company profile and consensus aggregation screen, retrieved 2026-09-16 (Wednesday)
- Whirlpool statistics page, refreshed 2026-09-15 (Tuesday)
- Korean trade press profile of the business mix, 2023-08-15 (Tuesday), reporter Lee Seung yong, paraphrased from Korean
- Seoul foreign exchange close for 2026-09-15, Korean financial press
- Second independent report of the same 2026-09-15 fixing, Korean industry daily