KCC Corporation Stock: Half the Revenue Is Silicones
The Korean company behind KCC Corporation stock is filed, described and discussed as a building-materials group. Its name sits next to cement and construction names on every Korean screen I use. When I opened the segment split in the company’s own first-quarter report, the largest line was neither paint nor building materials. It was silicones, at roughly 49 percent of revenue.
I want to be careful about what that number is. It comes from the first-quarter filing as relayed by Korean press on August 6, 2026, and I am applying a quarterly mix to a company I am otherwise describing on full-year figures. The four lines were silicones 49 percent, paint 28 percent, building materials 14 percent and other 7 percent. Those add to 98, so there is rounding in there that I did not resolve.
KCC Corporation stock closed at KRW 482,000 (about USD 357) on Friday, September 4, 2026. I am writing this early on Sunday, September 6, so Friday is the most recent trading day available to me. The market capitalization at that close is KRW 4,141.8bn, about USD 3.07bn.
| What the label says | A KOSPI-listed building-materials group. Paint, insulation, interior board, gypsum. Sector screens file it next to cement. |
|---|---|
| What the revenue says | Silicones are the single largest line at about 49 percent. Paint is 28. The business it is named for is smaller than the business it acquired. |
Contents
How KCC Corporation stock came to be a silicones company
The gap between the label and the revenue has a date attached to it. In 2018 and 2019 the company bought Momentive Performance Materials, the American silicones producer, in a consortium deal. Korean coverage at the time of the acquisition described the combined business as the world’s number two in silicones. I am quoting that as a 2018 statement and not as a present-tense fact, because the market has moved a great deal since then and I did not find a 2026 source that restates it.
The most recent Korean ranking I could locate is from a trade publication dated August 2, 2024, which placed Momentive third in global silicones at roughly 15 percent share, behind Dow-DuPont and Germany’s Wacker. Two later Korean articles I read, from November 2025 and January 2026, both refer back to the acquisition-era description instead of giving a current number. So the honest version is this: the last ranking I can point to is two years old, and I could not confirm where the business sits in 2026.
The two companies ranked above KCC Corporation stock are both losing money
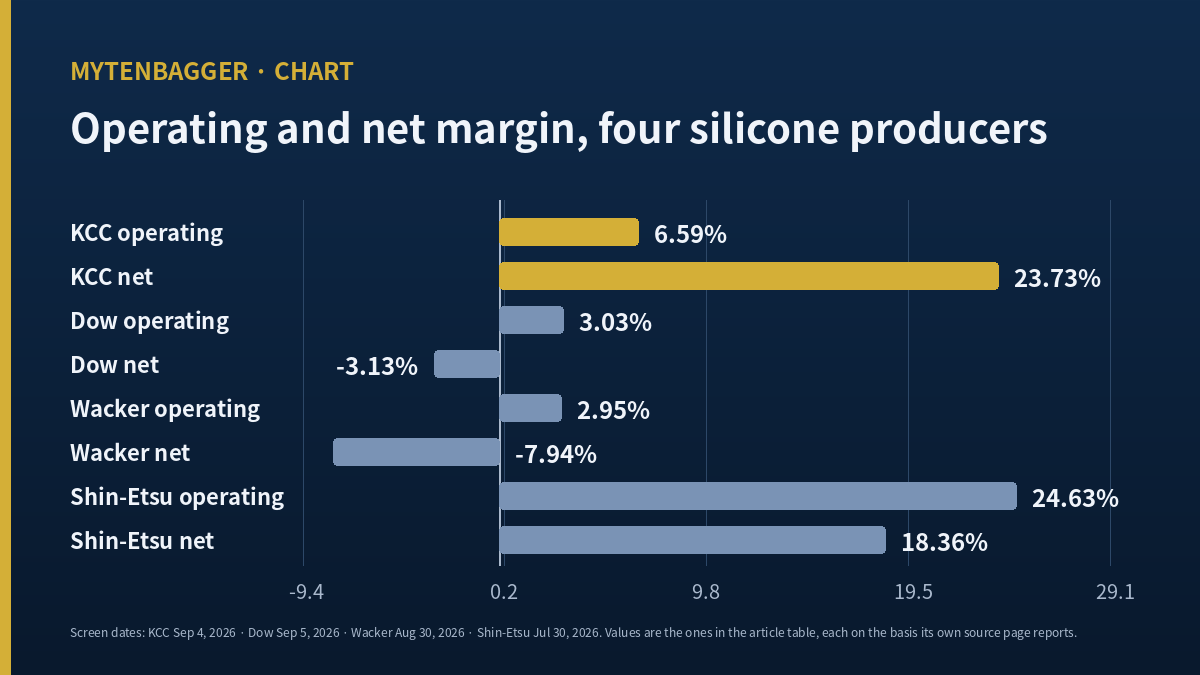
If a 2024 ranking put this business third behind Dow and Wacker, then those two are the natural comparison. I pulled all three from the same public data service and kept every figure in the currency each page reports, so there is no conversion of my own anywhere in this table.
| Company | Revenue (TTM) | Operating margin | Net margin | Screen date |
|---|---|---|---|---|
| KCC Corporation (KOSPI 002380) | KRW 6,483.8bn (FY2025) | 6.59% | 23.73% | Sep 4, 2026 |
| Dow Inc (NYSE: DOW) | USD 41.32bn | 3.03% | −3.13% | Sep 5, 2026 |
| Wacker Chemie (ETR: WCH) | EUR 5.52bn | 2.95% | −7.94% | Aug 30, 2026 |
| Shin-Etsu Chemical (TYO: 4063) | JPY 2.61tn | 24.63% | 18.36% | Jul 30, 2026 |
Why the screen dates are in the table
Two of those rows carry a stale timestamp and I put the dates in the table instead of hiding them. The Wacker page last refreshed on August 30, 2026 and the Shin-Etsu page on July 30, 2026, and I retried each three times through alternate paths without getting a newer one. Worse, the values themselves moved between cached versions: Wacker’s operating margin came back as 1.02 percent on one retrieval and 2.95 percent on another, and its market capitalization moved across a range of about 5 percent. Every Wacker figure above comes from the single most recent retrieval, because mixing values from different cache generations would break the arithmetic inside the row.
The comparison I built and then declined to use
Looking at that table, the obvious move is to put price multiples next to those margins. I did not. Three of the four companies report under different accounting regimes, two of them are posting net losses so a price-to-earnings figure would be meaningless or negative, and the Korean company’s net margin is doing something the others are not doing at all. Its net margin of 23.73 percent is 3.60 times its operating margin of 6.59 percent (my calculation). For Dow and Wacker the net figure sits below the operating figure, which is the ordinary direction. Putting a multiple on top of four numbers that behave that differently would produce a comparison that looks rigorous and means nothing.
An earnings table I read too quickly once
An earnings table taught me this the slow way, several years ago, with a different Korean company. I saw a net margin far above the operating margin, decided it meant the business had unusually low financing costs, and built a position on that reading. What it actually meant was that a one-time revaluation had passed through the income statement. The following year the two margins lined up in the ordinary order and the multiple I had been so pleased with tripled without the price moving at all.
Since then, when the bottom line runs ahead of the operating line, I treat the gap as a question and not as a finding. In this company’s case I have the question and I do not have the answer. I would need the notes to the financial statements to see what produced it, and I did not open them for this piece. That single omission is why nothing in this article rests on the earnings multiple.
What the silicones half of KCC Corporation stock did last quarter
A quarter that changed direction
For a business that is roughly half of revenue, the silicones unit had a very thin first quarter of 2026, with operating profit that Korean coverage described as under KRW 10bn. In the second quarter it came in around KRW 37bn. Hana Securities analyst Yoon Jae-sung put the recovery down to cost increases from the previous quarter being carried into selling prices, together with higher sales of specialty grades into personal care and electronics. Shinhan Investment analyst Lee Jin-myung wrote that selling prices went up 10 to 15 percent in April and that the segment’s EBITDA margin reached 14 percent in the quarter.
The target the company set for itself
The company has put a number on where it wants this unit to end up: operating profit of KRW 95bn for 2026 and more than KRW 100bn for 2027. I find the 2027 figure more interesting than the 2026 one. Getting to KRW 95bn this year is mostly a question of whether the second-quarter run rate holds for two more quarters. Getting past KRW 100bn next year requires the pricing to stick after the input-cost shock that caused it has passed.
Meanwhile the business it is named for went the other way
Group operating profit for the second quarter of 2026 was KRW 128.8bn, down 13.1 percent from the same quarter a year earlier, on revenue up 7.2 percent. The company pointed to weak Korean construction demand and to raw-material costs driven higher by disruption around the Strait of Hormuz, both hitting the paint business. So the quarter contains two opposite stories: the segment nobody names the company after recovered sharply, and the segment the company is named for got worse. I read the same demand picture from the interiors side in Hanssem, where gross profit fell in a quarter operating profit rose.
The margin the company is aiming at is the margin its peers already have
There is one arithmetic exercise in this article that I think is worth more than the rest of it, and it uses only numbers already on this page.
Take FY2025 revenue of KRW 6,483.8bn and apply the 49 percent silicones share. That implies silicones revenue of roughly KRW 3,177bn (my calculation). Now set the company’s own 2026 operating profit target for that unit, KRW 95bn, against it. The implied target operating margin is 2.99 percent (my calculation).
Put that next to the table above. Wacker is running at 2.95 percent. Dow is running at 3.03 percent. The margin this company has publicly set as its 2026 goal for its largest business sits between the two producers that are currently posting net losses, and it is roughly an eighth of what Shin-Etsu earns at 24.63 percent.
What that calculation is and is not
Those figures come from three different periods. Revenue is FY2025, the segment share is from a first-quarter 2026 filing, and the profit target is for full-year 2026. Mixing them gives an approximation and not a reported figure, and I would not defend the second decimal place. What survives the imprecision is the order of magnitude: the target is a low-single-digit margin, and low single digits is exactly where the loss-making end of this industry currently lives.
Why that reads to me as clarifying and not as an indictment
A company that had told the market it was chasing Shin-Etsu economics would be making a claim I could not check for years. A company that has told the market it wants roughly three percent on its largest business is telling me something much more specific: it is treating silicones as a volume commodity that has specialty pockets inside it, and it is not claiming to run a specialty business that happens to sell some commodity grades. That is a describable position, and it is one I can test each quarter against the KRW 37bn the unit earned in the second quarter of 2026. Four quarters at that level would clear the KRW 95bn target comfortably; one quarter at the sub-KRW 10bn level of the first quarter would not.
Where KCC Corporation stock sits against its own year
Over the 250 trading days ending Friday, September 4, 2026, I measured the range myself instead of taking the screen figures, because the screen’s stated basis and its actual values did not agree.
- Highest close: KRW 680,000 on Thursday, February 26, 2026. Highest intraday print: KRW 692,000 on Wednesday, February 25, 2026.
- Lowest close: KRW 352,500 on Wednesday, July 29, 2026. Lowest intraday print: KRW 336,000 on the same day.
- From the closing high, Friday’s close is down 29.12 percent (my calculation). The screen says 30.3 percent, because it is using the intraday prints.
The screen labels its own high and low as being drawn from adjusted closing prices over 250 sessions, and both values are intraday. On the high side even the date moves by one session. I have now seen this on eight consecutive companies, and this is the first time the high and the low behaved differently from each other: the high disagreed on both date and value, the low agreed on date and disagreed on value.
The case against how I am reading KCC Corporation stock
- The 49 percent silicones share comes from a first-quarter filing, and I applied it as a description of the whole business. Segment mix moves with the cycle, and paint’s share rises when construction recovers.
- The ranking that anchors my peer selection is dated August 2, 2024. Two years is long enough for a position in a consolidating industry to change, and I found no 2026 source that confirms it.
- Two of the three peer rows carry screen dates that are days or weeks old. Anyone reading this later should re-pull them before relying on the comparison.
- A label being wrong is not by itself an investment case. Plenty of misfiled companies stay misfiled and stay cheap for years.
- Being unlike loss-making peers is not automatically good. The 23.73 percent net margin is the number I explicitly declined to explain, so the difference could be a sign of quality or a sign of an accounting item I have not identified.
- The silicones recovery leaned on an April price increase. Selling-price gains taken during an input-cost spike are the first thing competitors reverse when the input cost falls back.
- Korean sell-side price objectives for this company span KRW 650,000 to KRW 750,000 across three houses. That is a wide band, and I read none of the underlying reports in full.
- My implied target margin of 2.99 percent stacks three periods on top of each other, and if the silicones share of revenue is materially higher or lower than 49 percent for the full year, that figure moves with it.
- The most consequential thing about this company in 2026 may have nothing to do with silicones at all. It holds a large listed stake in another Korean company and has written a policy into its own disclosure of passing a share of any special dividend from that stake through to its own holders. I deliberately left that thread out of this article, and if it dominates the next twelve months then I wrote about the wrong half of the business.
Numbers I checked and left out of KCC Corporation stock
The book multiple, which has four answers
Price to book comes out at 0.53 on the vendor screen, 0.39 against a 2026 estimated book value from a Korean consensus service, and 0.376 against second-quarter controlling-interest equity divided by shares outstanding (my calculation). A sell-side note used 0.38. All four are defensible; what separates them is which balance-sheet date they use. I do not give this company a single book multiple.
Share counts that do not reconcile
Paid-in capital of KRW 48.1bn divided by the KRW 5,000 par value implies 9,620,000 shares, while common shares outstanding are 8,592,946. The difference of 1,027,054 shares (my calculation) is most likely preferred stock, but I did not confirm it, so no figure in this article uses paid-in capital as an input. Separately, two screens report shares outstanding as 8,592,946 and 8,592,896, a 50-share gap that changes nothing at the market-capitalization level.
One thing I did check, and it held
Market capitalization reconciles exactly. KRW 482,000 multiplied by 8,592,946 shares gives KRW 4,141,799,972,000, which matches the reported figure of KRW 4,141.8bn to the won. The three moving averages on the price screen also reproduced from the raw daily closes without any rounding drift.
Fields I set aside
The interest-coverage field reads 0.46 with its basis marked unknown, and while I could verify it against first-half operating profit and interest expense, I could not establish whether the figure it divides by is pure interest cost or total finance costs, so I left the ratio out. The free-float field simply repeats shares outstanding rounded to the nearest thousand. The financial database carries an as-of date of August 20, 2026, seventeen days before I wrote this.
My position and what would prove me wrong
I do not own this and I have no order in. I am watching. The seven-metric checklist I run gives this company a perfect score, and the earnings multiple is 2.78 against a sector figure of 21.72, which is 12.80 percent of it (my calculation). I am still watching, because the profit that produced both of those numbers is the one figure in this article I chose not to explain.
Five contributing houses put the consensus objective at KRW 681,800, which is 41.45 percent above Friday’s close (my calculation). I am reporting that figure. I have not adopted it.
Three conditions would tell me this reading was wrong. First, if the third-quarter report due after Monday, November 16, 2026 shows the silicones unit giving back the second-quarter recovery, then the pricing did not stick and the more interesting half of this company is not more interesting after all. Second, if a 2026 industry source places the business outside the global top five in silicones, then the peer table I built is comparing it against the wrong companies. Third, if segment mix in the full-year filing puts silicones materially below 49 percent, the premise of this article weakens at its first sentence.
One more thing about those conditions. The second one depends on a source existing that I could not find while writing this, and I have no way to make it appear. I am keeping it on the list anyway, but marked as a condition I cannot test on my own schedule. A list of conditions that quietly includes untestable ones is a list that will always seem to pass.
USD conversions are approximate, at roughly KRW 1,350.4 per dollar on that same date, and the Korean won is the reference currency throughout. Peer figures are shown in each company’s own reporting currency with no conversion applied, and each row carries the date its source page was last refreshed. The three Korean sell-side views cited here were read through secondary Korean press coverage and a consensus screen; I did not obtain the original reports. See also my notes on the order book behind a Korean construction name and on a Korean chemical producer’s quarterly swing, neither of whose arguments I have carried into this piece.
Sources: Newspim, August 6, 2026, on the silicones segment · Newspim, August 5, 2026, on second-quarter results · Shinhan Investment view via Infostock Daily, September 1, 2026 · Korea Economic Daily, August 21, 2026, on the Hana Securities scenario · The Value News, August 2, 2024, on global silicones share · Dow Inc statistics · Wacker Chemie statistics · Shin-Etsu Chemical statistics