PharmaResearch Q2 2026 Earnings: Profit Grew Slower Than Sales
PharmaResearch stock closed at KRW 391,000 on August 19, 2026, which works out to about USD 280 at the exchange rate that day. The company had just reported the largest quarter in its history. Revenue of KRW 178.7 billion (USD 127.9 million) for the three months to June, operating profit of KRW 66.5 billion (USD 47.6 million), and an operating margin of 37.20 percent that most listed manufacturers anywhere would take without argument.
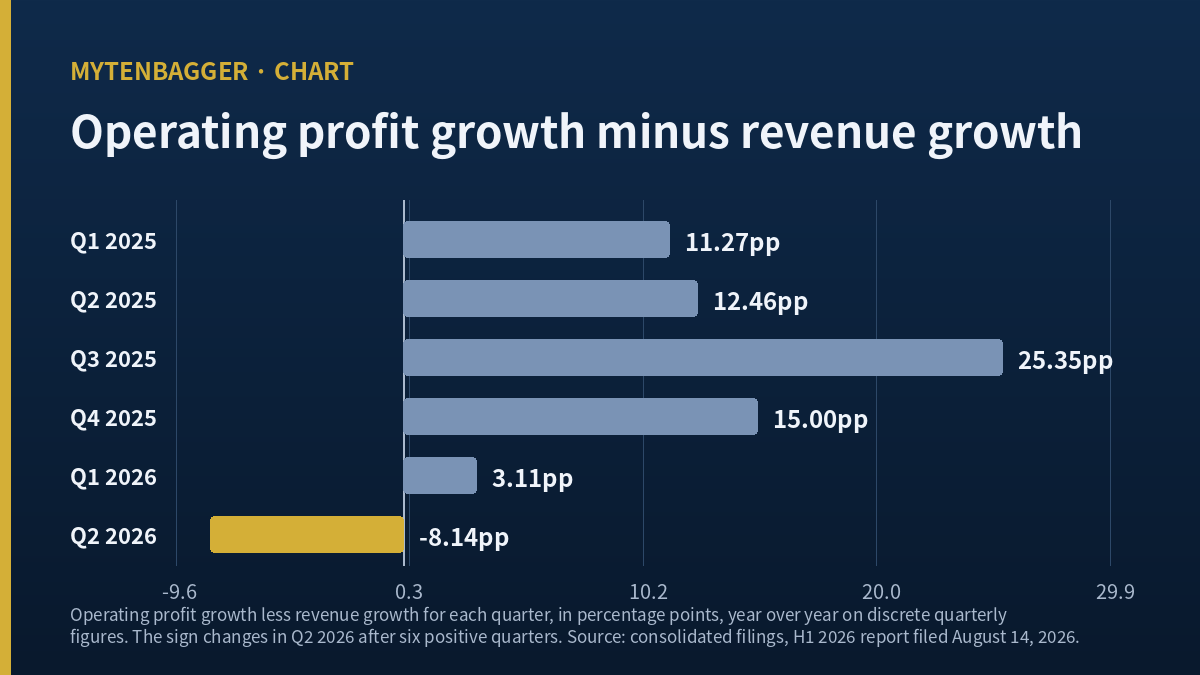
I still ended up writing this piece about a subtraction. Revenue in that quarter grew 27.09 percent against the same period a year earlier. Operating profit grew 18.96 percent. Take one from the other and you get minus 8.14 percentage points, and for the six quarters before it that figure had been positive every single time.
|
+27.09%
Q2 2026 revenue growth
|
+18.96%
Q2 2026 operating profit growth
|
-8.14pp
the difference, first negative after six positive quarters
|
Year-over-year comparisons of discrete quarterly figures, derived by me from the consolidated filings.
Contents
The company that makes Rejuran, and why it sits on KOSDAQ
PharmaResearch Co., Ltd. trades under the ticker 214450 on KOSDAQ, the smaller and more growth-weighted of Korea’s two main boards. KOSPI holds the shipbuilders, the carmakers, and the memory giants; KOSDAQ holds biotech, components, and consumer names that would sit on the Nasdaq if they were American. A company with a KRW 4.06 trillion market value, roughly USD 2.91 billion, is a large one by that board’s standards.
Its main product is Rejuran, an injectable skin booster built on polynucleotide extracted from salmon DNA. Aesthetic clinics use it the way an American clinic might use a hyaluronic acid filler, though the mechanism and the claim are different. The company also sells Conjuran, an injection for osteoarthritic knees, a pharmaceutical line, and a fast-growing cosmetics range that borrows the Rejuran name. Two-thirds of consolidated revenue comes from medical devices and cosmetics combined.
Eighteen quarters of PharmaResearch stock earnings, laid end to end
Before deciding whether one quarter meant anything, I wanted the whole series. The filings give me consolidated quarterly figures back to the first quarter of 2022, which is eighteen quarters, and year-over-year comparisons for fourteen of them.
Profit has beaten the year-ago quarter fourteen times running
Every one of those fourteen comparisons is positive. Not a single quarter in the window I can see shows operating profit below the same quarter a year earlier. On an annual basis the pattern is even cleaner.
| Fiscal year | Revenue (KRW bn) | Operating profit (KRW bn) | Margin | Debt to equity |
|---|---|---|---|---|
| 2022 | 194.8 | 65.9 | 33.85% | 28.63% |
| 2023 | 261.0 | 92.3 | 35.35% | 15.81% |
| 2024 | 350.1 | 126.1 | 36.00% | 50.27% |
| 2025 | 536.3 | 214.4 | 39.98% | 44.21% |
Revenue compounded at 40.16 percent a year over those three years and operating profit at 48.16 percent, both derived by me from the endpoints. Full-year 2025 revenue of KRW 536.3 billion converts to about USD 383.7 million.
The growth rate has been stepping down since the third quarter of 2025
Isolate the year-over-year change in discrete quarterly operating profit and the picture develops a slope. Q2 2025 came in at 81.65 percent, Q3 at 77.16 percent, Q4 at 54.06 percent, Q1 2026 at 28.08 percent, and Q2 2026 at 18.96 percent. Four consecutive declines. Every figure is still positive; the rate of climb is what keeps easing.
Base effects explain most of that on their own. The comparison year keeps getting bigger, so an identical won of extra profit produces a smaller percentage. A Korean broker made exactly this point in a note picked up on July 18, 2026 (Saturday), putting the slowdown down to the surge in device revenue during the prior year. Had I stopped there, my note for this company would read “arithmetic” and I would have moved on.
Why PharmaResearch stock met a different question in Q2
If base effects were doing all the work, revenue growth and profit growth would fall together. I put both series side by side and subtracted.
| Quarter | Revenue growth | Operating profit growth | Gap | Margin |
|---|---|---|---|---|
| Q1 2025 | 56.47% | 67.74% | +11.27pp | 38.26% |
| Q2 2025 | 69.19% | 81.65% | +12.46pp | 39.74% |
| Q3 2025 | 51.81% | 77.16% | +25.35pp | 45.69% |
| Q4 2025 | 39.06% | 54.06% | +15.00pp | 36.22% |
| Q1 2026 | 24.97% | 28.08% | +3.11pp | 39.21% |
| Q2 2026 | 27.09% | 18.96% | -8.14pp | 37.20% |
Revenue growth went up in Q2 2026, from 24.97 percent to 27.09 percent. Profit growth went down, from 28.08 percent to 18.96 percent. The two series moved in opposite directions and the gap changed sign. That is the whole finding. Sales are holding; the share of each incremental sale reaching the operating line has thinned, and what shows up on the page is a 37.20 percent margin against 39.98 percent for full-year 2025.
PharmaResearch stock has crossed this line three times before
Here is where I have to cut into my own argument. The inversion is not new. Of the fourteen comparable quarters, the gap has been negative four times: Q4 2023 at minus 9.00 points, Q1 2024 at minus 6.18 points, Q3 2024 at minus 2.64 points, and now Q2 2026 at minus 8.14 points. This one is the fourth, and it is not even the largest.
The uncomfortable part sits one step further along. Four quarters after that worst reading, in Q4 2024, the gap reached plus 18.04 points, and that is the widest positive number anywhere in the series. So the company has already demonstrated that it can invert and then recover harder than before. I have established that the reversal happened. I have established nothing about where it goes.
The listed company that already made this turn
Global peer selection for a Korean skin booster maker is awkward. The two manufacturers whose products define the adjacent categories are a private German firm and a group that left public markets years ago, so neither offers a price. What I found instead was a company at almost exactly the same revenue scale that is already on the far side of the curve I am watching.
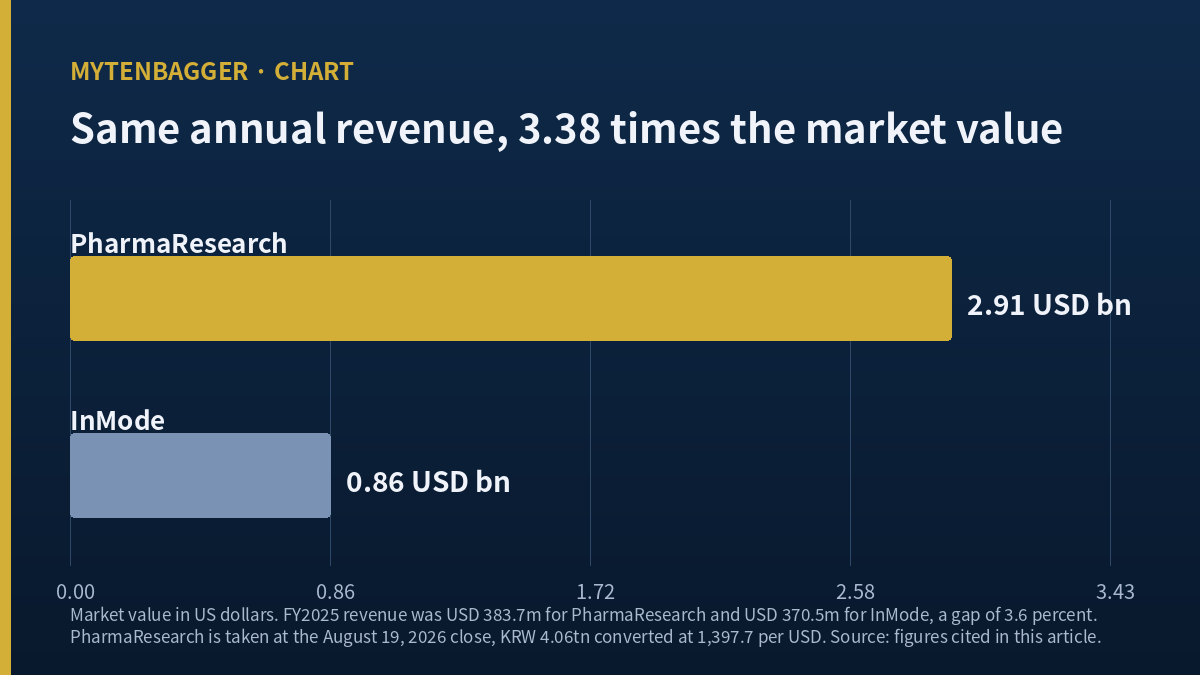
InMode (Nasdaq: INMD) is an Israeli maker of radiofrequency aesthetic platforms sold mostly to US clinics. Its full-year 2025 revenue was USD 370.5 million against PharmaResearch’s USD 383.7 million equivalent, so the two businesses sell almost the same amount of product each year. There the resemblance ends.
| PharmaResearch | InMode | |
|---|---|---|
| FY2025 revenue | USD 383.7m | USD 370.5m |
| FY2025 revenue direction | +53% in KRW | -6.2% in USD |
| Operating margin, latest full year | 39.98% | 23% (GAAP) |
| Operating margin, prior year | 36.00% | 29% (GAAP) |
| Market value | USD 2.91bn | USD 0.86bn |
Same revenue, and the Korean company carries 3.38 times the market value. The difference is entirely in the two lower rows. InMode’s GAAP operating margin fell six points in a single year while its revenue went slightly negative, and its second quarter of 2026 came in flat against the year before at USD 95.6 million. The market has repriced it accordingly. PharmaResearch is being priced on a margin that is still near forty percent and a growth rate that is still in the twenties.
I want to be precise about what this comparison does. It does not forecast anything. Margin figures across the two are computed under different accounting regimes, and I did not attempt to reconcile GAAP operating profit with a Korean consolidated operating line. What it gives me is a price tag for the scenario I am worried about, sitting on a screen I can check any day. That is more useful to me than a projection I would have to build myself.
Where the first half of 2026 actually came from
Half-year revenue reached KRW 324.8 billion (USD 232.4 million) with operating profit of KRW 123.8 billion (USD 88.5 million), up 26.13 percent and 23.01 percent respectively. The ordering of those two numbers repeats the quarterly finding at the half-year level.
The company’s own segment disclosure shows where the volume came from. In the June quarter, medical devices contributed KRW 96.7 billion, split KRW 64.5 billion domestic and KRW 32.2 billion export. Cosmetics contributed KRW 60.2 billion, split KRW 16.6 billion domestic and KRW 43.6 billion export. The two segments sum to KRW 156.9 billion against quarterly revenue of KRW 178.7 billion, leaving about KRW 21.8 billion in pharmaceuticals and other lines. Half-year exports of KRW 142.8 billion accounted for 43.97 percent of revenue, up from 38 percent a year earlier.
Cosmetics exports are now 2.63 times cosmetics domestic sales
That ratio is the number I kept returning to. A cosmetics line sold abroad through retail and marketplace channels carries a different cost structure from a device sold to a domestic clinic, and when the mix tilts, revenue can grow while the operating line lags. The direction of the Q2 margin and the direction of the mix agree with each other.
Agreement is weaker evidence than it feels like. The company does not publish segment operating margins, so I could not test the link. I am reporting that two things point the same way and that I was unable to close the loop between them. Korean sell-side coverage traces the domestic device slowdown to competing extracellular-matrix products entering the same clinics, and a Korean brokerage industry note dated June 9, 2026 (Tuesday) sized that adjacent category at KRW 9.9 billion for 2025 rising to KRW 92.5 billion for 2026. The same note named a different company as its preferred exposure to that shift.
The liability line that tripled has almost nothing to do with borrowing
Debt to equity moved from 15.81 percent in 2023 to 50.27 percent in 2024. Total liabilities went from KRW 73.1 billion to KRW 286.3 billion, an increase of KRW 213.2 billion, and interest expense in the same year climbed from KRW 6.1 billion to KRW 41.0 billion, a factor of 6.70.
Korean press reported in September 2024 that a European private equity firm had put KRW 200 billion into the company through redeemable convertible preferred shares. Securities carrying a redemption right get classified as financial liabilities under the accounting the company applies, and the effective interest and fair value movements that come with them land in finance costs. The size of the liability increase and the size of the placement line up, and the interest jump is confined to the same year. Whether the full KRW 34.9 billion increment is effective interest or partly a valuation charge would require the notes, which I did not obtain.
I put this in the body instead of the risk list because dilution is a live variable here. If those preferred shares convert, the share count rises and every per-share figure in this piece needs recomputing. The conversion price, the resulting share count, and the maturity are all things I failed to find. Recording “unknown” beats recording “none” when the difference is a few percent of the equity base.
What PharmaResearch stock costs depends on which twelve months you count
At KRW 391,000 across 10,389,770 shares the market value is KRW 4.06 trillion. The multiple attached to it refuses to settle on one figure.
| Multiple | Divided by what | Result |
|---|---|---|
| P/E | Data vendor’s stated figure, trailing window unspecified | 27.52x |
| P/E | FY2025 owners’ net income of KRW 165.1bn, derived by me | 24.60x |
| P/E | Last four quarters of owners’ net income, KRW 185.7bn, derived by me | 21.88x |
| P/B | Vendor book value per share of KRW 59,603 | 6.56x |
| P/B | Owners’ equity at end-2025 of KRW 689.3bn, derived by me | 5.89x |
| P/B | Owners’ equity at end-Q2 2026 of KRW 753.7bn, derived by me | 5.39x |
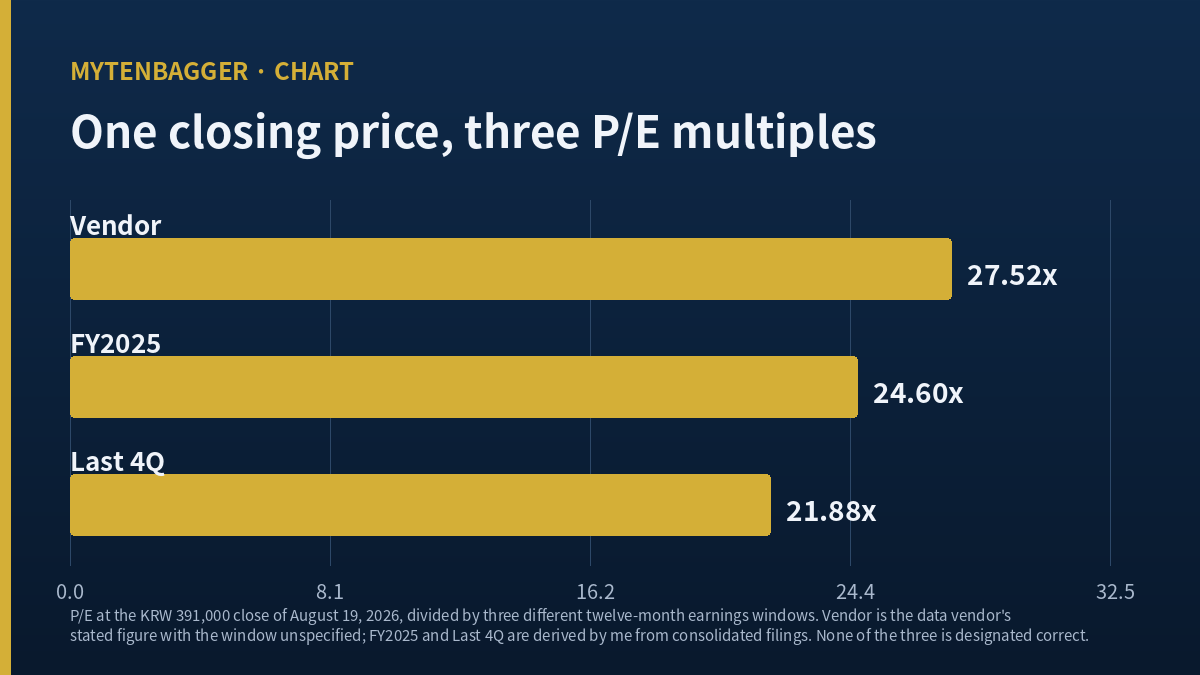
All three P/E figures come from the same closing price on the same day. The only thing that varies is which twelve months of earnings sit underneath. For a company whose profit has been compounding at high double digits, an older window produces a higher multiple almost mechanically, and the spread between the vendor’s 27.52x and my 21.88x is 5.64 points of pure vintage.
The dividend more than tripled and the total does not reconcile
The FY2025 dividend is KRW 3,700 per share, about USD 2.65, up 236.36 percent from KRW 1,100. Filing history shows six consecutive years of increases starting with fiscal 2020. Against the vendor’s earnings per share of KRW 14,209 the payout ratio comes to 26.04 percent, which matches the vendor’s own field.
One figure refuses to fit. Korean coverage put the total dividend outlay at KRW 42.8 billion, while KRW 3,700 multiplied by the ordinary share count gives KRW 38.4 billion. The KRW 4.4 billion difference would be explained if the preferred shares receive a dividend too, but that is my inference and I have not read the resolution. I am recording the discrepancy without resolving it. The share count itself is reported as either 10,389,770 or 10,389,648 depending on the source, a 122-share spread worth about KRW 48 million and irrelevant to every multiple above.
Seven ways I could be wrong about PharmaResearch stock
- The inversion has precedent and the precedent went the other way. Q4 2023 was worse and was followed by the widest positive gap in the series.
- Revenue growth accelerated. From 24.97 percent to 27.09 percent. Nothing in this table says demand weakened.
- I could not verify the mix explanation. Segment margins are undisclosed, so my reading of why the operating line lagged remains a hypothesis.
- The currency cuts against my own causation. The won closed at 1,397.7 per dollar on August 19, 2026, its strongest in eleven months. With exports at 44 percent of revenue, a stronger won pressures the second-half operating line for reasons that have nothing to do with product mix.
- Korean sell-side sits opposite me. Eight brokerages refreshed views within ten days of the results, and every figure they published sits above the current price. Individual estimates I could verify put 2026 operating profit between KRW 258.8 billion and KRW 283.2 billion, which is 20.7 to 32.1 percent above 2025.
- Regulation is arriving at the competition instead. Enhanced safety reporting has been signaled for the rival extracellular-matrix category, and this company’s polynucleotide platform is outside it. Slow the challengers and one cause of the slowdown weakens.
- My window closes at eighteen quarters. The filings I can reach begin in 2022. Whatever cycle this business ran before that, I have no view of it.
Where I stand on PharmaResearch stock and what would end it
The seven-indicator checklist I run scores this company 71, passing five of seven. Revenue scale, operating margin, earnings per share, return on equity, and operating profitability all clear. P/E at 27.52x and P/B at 6.56x do not.
Across all eighteen quarters I can see, this company kept its operating margin above thirty percent in seventeen of them; the exception is Q4 2023 at 29.12 percent. A level test was never going to tell me anything here. The only question left was direction, and I have exactly one quarter of it, which is why I am watching. When Celltrion posted record earnings near a 52-week low I went the other way, because there the engine of the growth was identifiable in the filings. Here the engine of the slowdown is not.
The thesis ends on the Q3 2026 report. If the gap between profit growth and revenue growth returns to positive, this was a Q4 2023 repeat and I drop the structural reading. If Q3 comes in negative again, that is two consecutive quarters and I treat the mix shift as having left a mark on the margin. The financial database lists the statutory filing deadline as November 15, 2026 (Sun), so in practice the following business day; both prior releases arrived through a preliminary disclosure well ahead of the full report.
Figures I checked and left out
The one-year return is minus 42.07 percent against KOSDAQ at plus 4.63 percent and the sector at minus 15.26 percent, with the tool assigning the shortfall to the stock instead of the sector. I have used that decomposition as a lead recently and declined to repeat the structure here. Four vendor cash-flow fields turned out to carry mismatched periods: operating cash flow, free cash flow and interest coverage were half-year cumulative, while the field labeled EBITDA held the Q1 2026 operating profit exactly, so I replaced all four with filed figures. The company canceled 119,952 treasury shares in June 2025 at an implied KRW 523,000 each, which falls outside my ninety-day event window. A demerger was resolved in June 2025 and withdrawn the following month, leaving no trace in the share count. Kolmar Korea was the opposite problem, where the structure was real and took a quarter of the profit with it.
I had the same trouble with APR Corporation
Prices and multiples reflect the August 19, 2026 (Wed) close as checked at the time of writing. USD conversions are approximate, at roughly KRW 1,397.7 per dollar on the same date, and Financial statement figures come from Korea’s electronic disclosure system, with half-year 2026 data as filed on August 14, 2026 (Fri). Korean-language reporting from Etoday, Herald Business and Newsis supplied the segment, brokerage and financing details, and InMode’s figures come from its own investor disclosures.