Harim Earnings: Higher Chicken Margins Than Two US Peers
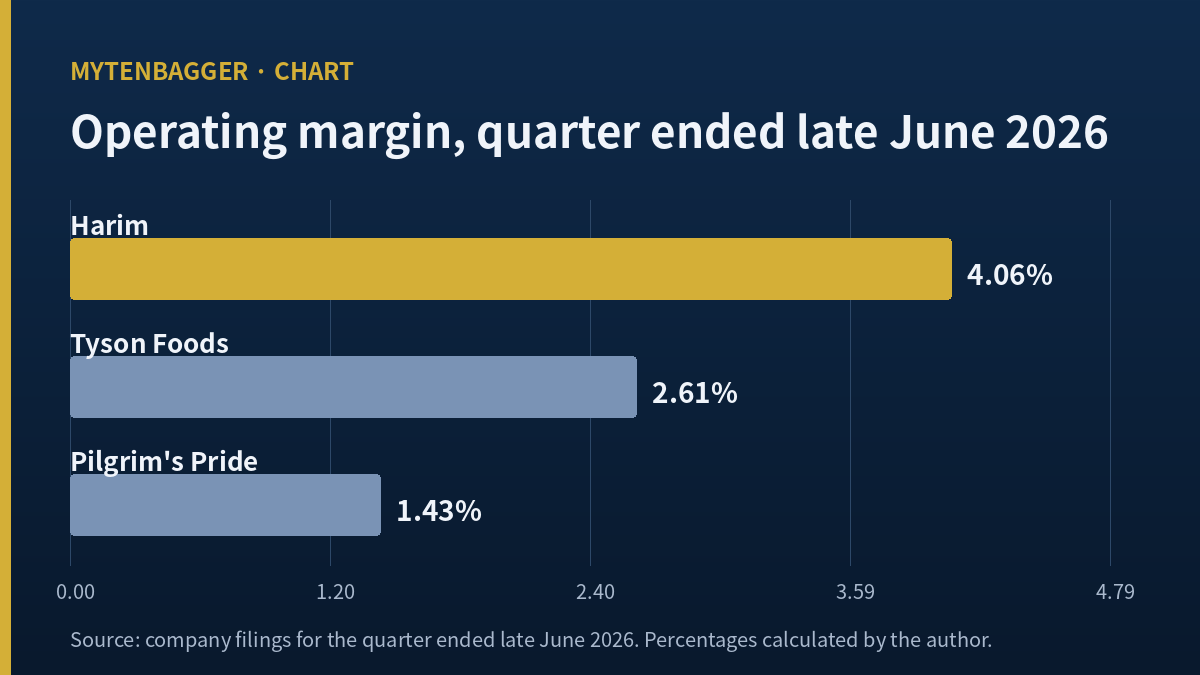
Three chicken companies closed a quarter within four days of each other in late June 2026. I can read a published forward estimate for two of them. For the third, Harim stock, I could not find one. That third company posted the highest operating margin of the three.
What I can read, and what I cannot
| Things I could open and check | Things I looked for and did not find |
|---|---|
| Four years of audited consolidated accounts, filed with Korea’s regulator | Any brokerage estimate of 2026 or 2027 revenue or operating profit |
| Quarterly revenue, operating profit and net profit back to early 2022 | A published fair-value figure from a licensed research desk |
| Two US chicken producers’ releases covering the same three months | A named analyst who has written on this company in 2026 |
| A live domestic price for the raw input, live chicken at the farm gate | The note explaining why interest expense halved while debt barely moved |
Everything in the left column looks backwards. Those are the limits this piece works inside, and I would rather state it at the top than let it show up as false confidence later.
Contents
Three chicken quarters that ended in the same week
Harim Co. trades on KOSDAQ, the smaller and more retail-driven of South Korea’s two main boards, under the code 136480. KOSPI is the large-cap board that holds Samsung Electronics and most of what a US investor would recognize as Korean industry; KOSDAQ sits beside it and carries mid-cap manufacturers, biotech and food processors. Harim is the country’s best-known chicken brand and slaughters, processes and sells poultry, with feed and downstream food operations consolidated in.
At the August 14, 2026 (Fri) close of KRW 2,710, roughly USD 1.91, the company carries a market capitalization of KRW 287.8bn, about USD 202.9m. I multiplied the closing price by the 106,199,262 shares the data screen reports and got KRW 287,800,000,020, which closes to the won. Trailing twelve-month revenue is KRW 1,440.0bn, or about USD 1.02bn. The company sells roughly five times its own market value every year.
Three producers with June-quarter reporting closed within four days of each other. Here is what each of them published.
| Company | Quarter ended | Revenue | Operating income | Margin |
|---|---|---|---|---|
| Harim (136480) | June 30, 2026 | KRW 425.8bn ≈ USD 300.2m |
KRW 17.3bn ≈ USD 12.2m |
4.06% |
| Tyson Foods, whole company | June 27, 2026 | USD 13,868m | USD 362m GAAP |
2.61% |
| Pilgrim’s Pride | June 28, 2026 | USD 4,626.2m | USD 66.0m GAAP |
1.43% |
| Pilgrim’s Pride, year earlier | June 29, 2025 | USD 4,757.4m | USD 512.3m | 10.77% |
Sources: Tyson Foods release of August 3, 2026 (Mon); Pilgrim’s Pride release of July 29, 2026 (Wed); Korean press reporting of Harim’s half-year numbers on August 7, 2026 (Fri), cross-checked against the company’s first-quarter regulatory filing. Margins are my own division of the two published lines.
Harim stock had the highest operating margin of the three
Harim’s 4.06% is 1.5565 times Tyson’s whole-company 2.61% and 2.8479 times Pilgrim’s 1.43%, both by my calculation. The gap between the top and bottom of the three is 2.6363 percentage points.
My instinct on seeing that was to distrust it, and the distrust turned out to be about the fourth row of the table more than the first three. Pilgrim’s Pride earned 10.77% in the same quarter a year earlier. Its operating income fell 87.1% year over year, per its own release. So one reading of the table is that Harim did well. Another is that the two American producers had a bad June and a Korean processor with a 3-to-4% structural margin simply stood still while they came down to meet it.
What that comparison cannot carry
Three limits, and they belong in the body of this piece instead of a footnote.
- Tyson’s number is the whole company. Beef, pork and prepared foods sit inside that USD 13,868m alongside chicken. Tyson does break out a Chicken segment and describes it as strong, but the segment revenue and income lines live in a supplementary table I was not able to open, so I used the consolidated figures instead of quoting a segment number I had not read.
- The accounting standards differ. The two American figures are US GAAP operating income. Harim reports under K-IFRS, where the operating profit line can include items an American filer would place elsewhere.
- The quarters are not identical. They end on June 27, June 28 and June 30. Three days will not move a margin much. They are still three different quarters.
Harim stock trades at 7.47 times a year that was really one quarter
The screen shows a trailing price-to-earnings ratio of 7.47 and a price-to-book ratio of 0.88. I rebuilt the first of those. Net profit attributable to owners in the 2025 financial year was KRW 38.54bn; divided by the share count that gives KRW 362.86 per share, and KRW 2,710 over that is 7.4685. The screen prints 7.47, so the figure reproduces.
Reproducing and being usable are two separate tests, and the second one is where this breaks. Here are the four years the screen is choosing one of.
| Financial year | Revenue (KRW bn) | Operating profit | Net profit | Interest expense |
|---|---|---|---|---|
| 2022 | 1,342.9 | 46.8 | 5.0 | 53.1 |
| 2023 | 1,410.8 | 40.4 | 13.0 | 48.4 |
| 2024 | 1,285.4 | 28.5 | −12.3 | 73.1 |
| 2025 | 1,440.0 | 47.7 | 38.7 | 35.6 |
Consolidated accounts filed with Korea’s electronic disclosure system, receipt number 20260318000871 for the 2025 year. Originals are in millions of won; I converted to billions.
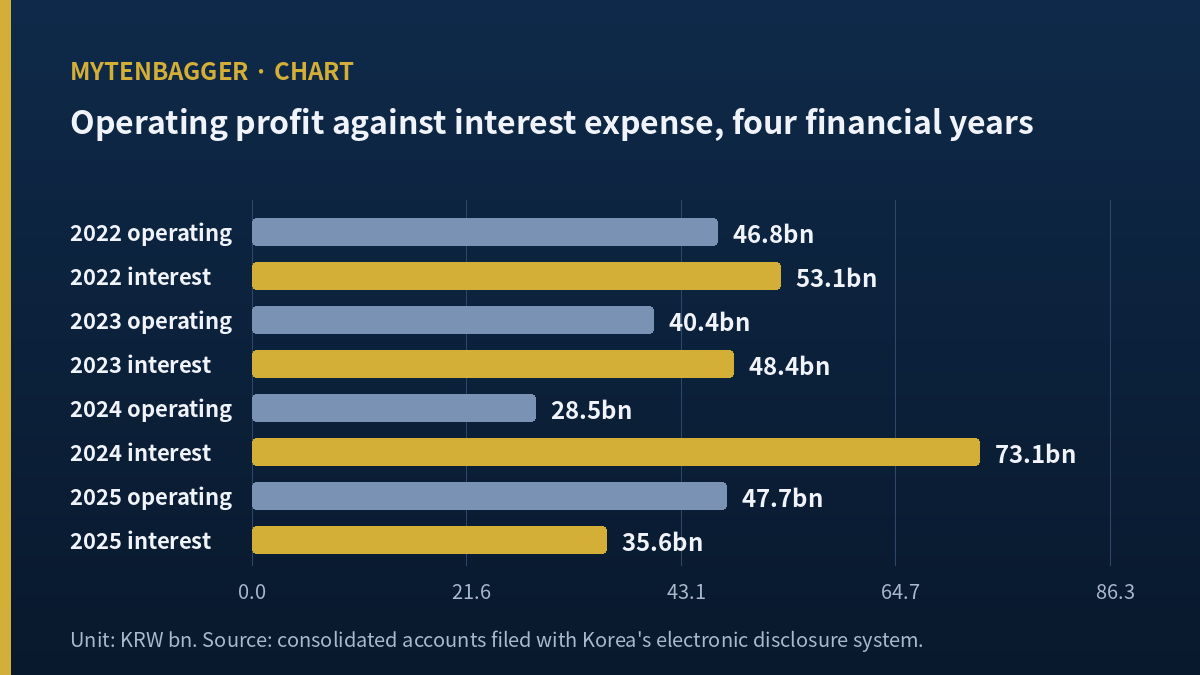
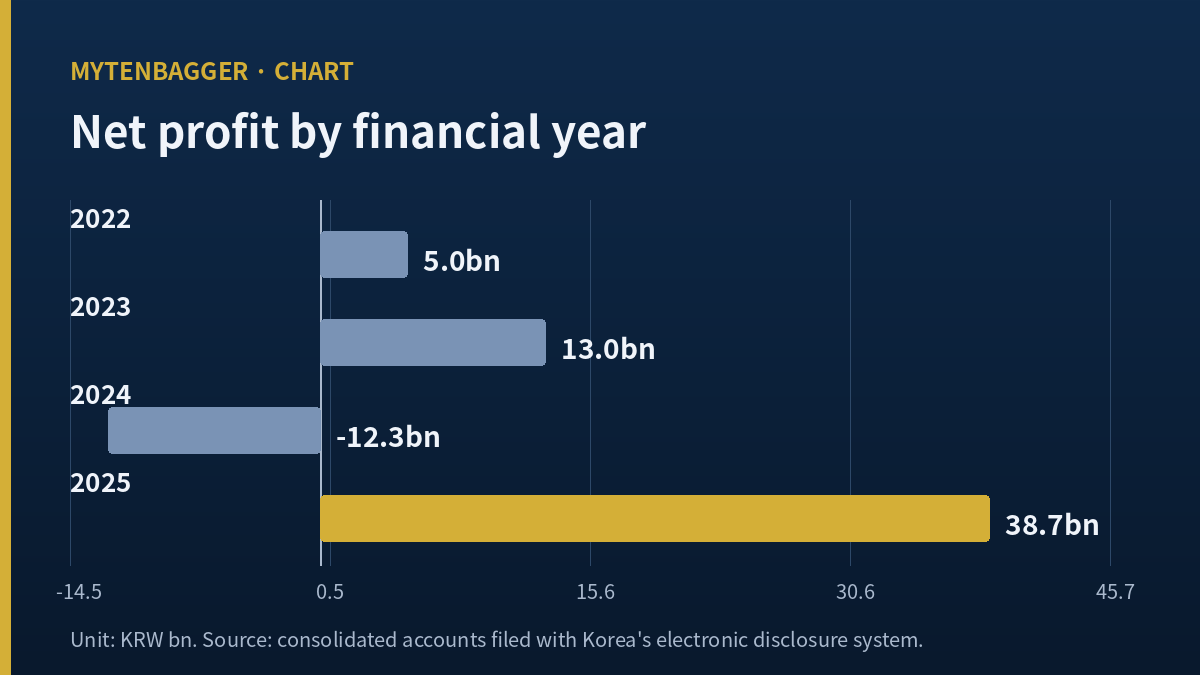
Revenue moved inside a narrow band for four straight years. Operating profit ranged from KRW 28.5bn to KRW 47.7bn, a factor of 1.6723. Net profit ranged from negative KRW 12.3bn to positive KRW 38.7bn, a span of KRW 51.1bn, which is 2.6645 times the operating-profit span, by my calculation. Whatever happens below the operating line at this company is louder than the business itself.
Average the four years and net profit is KRW 11.1bn, roughly USD 7.8m. Divide the market capitalization by that instead of by 2025 alone and the multiple becomes 25.91, or 3.4686 times the 7.47 the screen prints. I do not think either figure is the answer. One of them assumes the good year repeats forever and the other assumes all four years repeat in rotation, and I believe neither. But only the first one is printed anywhere, and it is the number a new reader meets first. I ran into the mirror image of this at CJ CheilJedang, where the earnings multiple cell was empty because the year had no profit to divide by. Here the cell is full, and full of one quarter.
The quarter in which net profit exceeded operating profit
Split the 2025 net profit of KRW 38.74bn into its four quarters and one of them holds most of it.
Q1 2025: operating KRW 6.95bn, net KRW 2.86bn
Q2 2025: operating KRW 19.77bn, net KRW 29.96bn
Q3 2025: operating KRW 18.48bn, net KRW 8.49bn
Q4 2025: operating KRW 2.48bn, net negative KRW 2.57bn
The bolded quarter is 77.35% of the full-year net profit, by my calculation. Its net profit is 1.5156 times its own operating profit, about USD 21.1m of net on USD 13.9m of operating income.
Between operating profit and net profit sit finance income, finance costs, equity-method results and tax. For net to land above operating, the finance side has to bring in more than interest and tax take out. Harim imports feed grain and carries dollar obligations against it, so a falling won-dollar rate produces valuation gains and a rising one does the reverse.
The company said as much itself. Explaining the 2026 first half, it attributed higher revenue and operating profit to a stronger farm-gate price for live chicken, and the fall in net profit to volatility in finance income and costs driven by the exchange rate. So the top half of this income statement is written by chickens and the bottom half by the currency market, and the company controls neither price.
The same quarter one year on shows the mechanism running backwards. In the June 2026 quarter, operating profit was KRW 17.3bn and net profit KRW 8.9bn, a coefficient of 0.5145 against the 1.5156 of a year earlier, a swing of 2.9458 times. Operating profit fell 12.50% year over year and net profit fell 70.30%, both by my calculation. Same company, same season, same birds.
Harim stock and a return on equity built out of one year
The screen also reports return on equity of 12.6%, and a checklist score of 86, six of seven criteria passed. That is a high score. Two companies I looked at immediately before this one scored 29 on the same checklist, two of seven.
I worked out which equity base the 12.6% uses. Closing equity for 2025 was KRW 325.4bn, which gives 11.90%. Average it with the prior year-end of KRW 289.1bn and you get KRW 307.3bn, which gives 12.6077%. The screen uses the average. That is a definitional choice and no one has made a mistake. The two figures simply look contradictory if nobody says which base is in play.
The four-year series on closing equity runs 1.66%, 4.22%, negative 4.27%, and 11.90%. Strip out 2025 and the remaining three average 0.54%, by my calculation. And of the six checklist criteria this company passes, three of them (earnings per share, return on equity and the earnings multiple) are all computed off that single year.
Meanwhile the shares change hands at 0.88 times book. A company earning 12.6% on equity trading below its own net assets looks like a contradiction until you notice the 12.6% is one year old and one quarter deep.
No published forward estimate for Harim stock that I could find
This is the part I most want on the record. I could not locate a single sell-side estimate for this company.
The consensus page maintained by Korea Economic Daily’s market service shows, as of the August 14, 2026 (Fri) close, a rating of Not Rated, a forecast earnings per share of 0.00 and a forward multiple of 0.00. I ran the names of fifteen Korean brokerage houses against this ticker separately and found no standalone research. That is not proof of absence. It is a statement about the limit of my own search.
The listed holding company in the same group does carry coverage on the same service, where a buy rating and a per-share figure of KRW 15,667 are displayed against a KRW 11,230 close. That is a different listed entity with different economics, and I am not moving its numbers onto this ticker.
So a company selling roughly USD 1.02bn of chicken a year, five times its own market value, has no published view of its own next twelve months that I could read. Everything above this line looks backwards because there was nothing else to look at. For an investor sitting in the United States that is the actual condition of the position, and it does not belong in a footnote.
Eighteen things that push back on what I just wrote
- First-quarter 2026 operating profit of KRW 11.66bn was up 67.83% on the prior-year quarter, by my calculation. Base effect or not, the direction is up.
- First-half 2026 operating profit of KRW 29.0bn was up 8.54% year over year, by my calculation.
- The debt-to-equity ratio has fallen from 202.17% at the end of 2022 to 155.08% at the end of the 2026 first quarter.
- Operating cash flow of KRW 129.1bn in 2025 was 3.33 times that year’s net profit. The earnings are cash-backed.
- Cumulative free cash flow over 2022 to 2025 was KRW 219.9bn, or 76.40% of today’s market capitalization, by my calculation.
- Choosing a four-year average is itself arbitrary. 2022 was an unusual starting point for anyone buying imported grain.
- If the 2024 loss was largely a currency revaluation and not cash leaving the business, weighting it equally in a four-year average may overstate it.
- I averaged consolidated net profit across four years without separating the small minority interest. The result barely moves, but it is not exact.
- Concentration in one quarter is common in seasonal businesses and is not by itself a defect.
- Interest expense fell 51.36% between 2024 and 2025 while total liabilities fell only 2.53%, both by my calculation, and I could not find the explanation. There may be a good one I have not read.
- A private affiliate in the group, which runs the packaged-food and instant-noodle business, has been reported to carry heavy accumulated losses. It is not on this company’s balance sheet, but group funding is not sealed off.
- A Seoul appellate court on July 23, 2026 (Thu) was reported to have upheld penalties totaling KRW 52.68bn against three affiliated companies in a bid-rigging matter. The defendants named in that reporting are group entities. This listed operating company was not among them, and the two should not be run together.
- The group’s Yangjae logistics-complex development has been through repeated permit revisions and delays.
- Imported frozen chicken competes on price with domestic production across the whole Korean industry.
- The share count differs by source. I used 106,199,262 for the market-cap reconciliation; another tabulation reports 106,209,702. I could not establish the reason for the 10,440-share gap.
- The screen’s 250-day high and low of KRW 3,565 and KRW 2,550 are labeled as adjusted-close values but are actually intraday extremes. I used the closing-price versions of KRW 3,390 and KRW 2,585 throughout.
- The dividend record skips 2024, the loss year. It reads KRW 50 in 2016, then 30, 20, 30 for 2021 through 2023, nothing for 2024, and 40 for 2025.
- The most recent domestic market-share figure I could find puts this company at 19.1% of slaughter volume, but that reporting dates to April 18, 2022 (Mon) and describes 2021. Four years stale, so I left it out of the argument above.
The register holds more than half the company
This is a KOSDAQ mid-cap, not a large-cap board name, so it sits outside the top holdings of the broad Korea trackers that set most passive weightings. The one ownership figure I have is a vendor line showing foreign holders at 5.36%.
The constraint specific to this name sits on the register. The largest shareholder group is reported at 58.60% of the register, which leaves a free float of 41.38%. More than half the company is not in the market at all, and at a USD 202.9m capitalization the tradable portion is smaller than the headline suggests. Anyone building or unwinding a position here is working against that float.
Numbers I checked and left out of the Harim stock case
- Trailing return series. The twelve-month change of negative 9.52% reproduces from the August 1, 2025 (Fri) close of KRW 2,995. Six months reproduces from February 6, 2026 (Fri), three months from May 14, 2026 (Thu), one month from July 15, 2026 (Wed). All four anchor to fixed dates instead of a rolling window measured from today, and since the screen does not say so, I kept them out of the argument.
- Drawdown figures. On closing prices the peak was KRW 3,390 on April 24, 2026 (Fri) and the subsequent trough KRW 2,585 on June 26, 2026 (Fri): down 20.06% from the peak, up 4.84% off the trough, maximum drawdown 23.75%.
- Beta of 0.231 against a correlation of 0.555. The shares barely track the board. Whether that is stability or neglect, this dataset cannot tell me.
- Dividend yield of 1.48% on KRW 40 per share reproduces, but the payout ratio appears on the same screen as both 11.0% and 41.4%, and I could not establish which ratio each figure describes.
One more belongs here, and it is about how I built the table at the top more than about the company. When I could not open Tyson’s Chicken segment lines, I substituted the consolidated company figures and carried on. That substitution kept the comparison alive, but it also quietly changed what the comparison was of. It became a pure-play Korean chicken processor against a diversified American protein group, when I had set out to weigh chicken against chicken. I noticed only after the table was finished and the margins were already ranked. The ranking may well survive a proper segment comparison; the point is that I had stopped asking.
Where I stand on Harim stock, and what would prove me wrong
At a KRW 287.8bn capitalization the company sits well outside Korea’s hundred largest listings, and my default there is to watch. But size is not the reason I am only watching. The reason is that with nothing forward-looking published, the three backward-looking figures on the screen are the whole case, and all three trace to the same twelve weeks.
The cheapness is real enough on its face: 0.88 times book, 0.20 times sales. Cheapness carries an assumption that the level holds, and here that assumption rests on the price of live chicken and the price of a dollar. At Lotte Chilsung I watched interest expense refuse to fall while debt did; here the debt held steady while interest halved, and I cannot account for either direction. At Dongwon Industries the problem was three years of free cash flow trapped inside a narrow band, too little variation to read anything from. This is the opposite complaint, and putting the two side by side taught me the variation was never the point. What matters is whether the thing generating it sits inside the company or outside. Here it is outside.
What would tell me I read this wrong
If both the 2026 and 2027 financial years deliver net profit above KRW 25bn, and in neither year does a single quarter account for more than half of that year’s net profit, then I was wrong to treat 2025 as a one-quarter event. I want the level and the spread together, because the level alone can be met by one more good quarter, which is exactly the thing I am questioning.
I cannot compute the odds of that condition being met, and the reason I cannot is the third important fact in this piece. The half-year regulatory filing was accepted on August 12, 2026 (Wed) and I have not opened it. Its notes should contain the composition of finance income and costs and a breakdown of interest expense, the two items I marked as unresolved above. Winning a margin comparison against two American producers in a single quarter is a fact, and it is the weakest kind of fact I collected today: one quarter, three accounting regimes, and no forward view from anyone. When I come back to this name, I am starting with that filing instead of the table I just built.
Prices and multiples reflect the August 14, 2026 (Fri) close of KRW 2,710, checked at the time of writing. August 15 was a public holiday and August 17 (Mon) a substitute holiday, so the Korean market was shut and that Friday is the most recent session. The Korean won is the reference currency throughout; dollar figures are approximate, converted at roughly KRW 1,418.3 per dollar, the Seoul market close on the same date. Financial-year data comes from consolidated regulatory filings; the June-quarter and half-year figures come from Korean press reporting dated August 7, 2026 (Fri), cross-checked against the first-quarter filing. Ownership and share-count figures come from a Korean data service; chicken-price reporting from Korean business press; the share-of-slaughter figure from a Korean food-industry publication; the logistics-complex reporting from a Korean daily. Anything marked as my own calculation was derived by me and is not printed in the source.
- Nature Cell Convertible Bond Pricing After an 8-Year Court Win
- YC 232140 Memory Wafer Tester: Why Shares Fell With the Sector