Hanssem Stock: The Thinnest Gross Margin of the Four
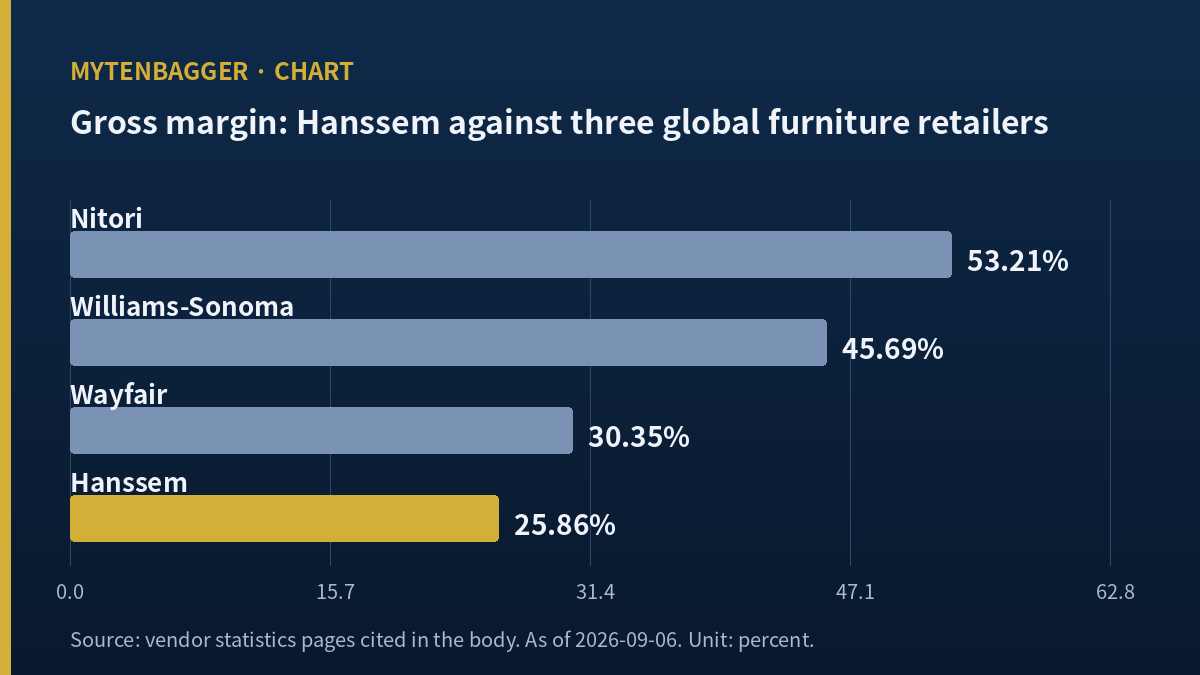
Four gross margins, sorted: 53.21 percent, 45.69 percent, 30.35 percent, 25.86 percent. The first three belong to Nitori, Williams-Sonoma and Wayfair. The last one belongs to Hanssem stock, the Korean company I spent this session on, and it is the number that decides how much of everything else matters.
- Hanssem carries the lowest gross margin of the four names I compared, at 25.86 percent on its vendor statistics page.
- It also carries the smallest distance between gross margin and operating margin, 24.52 points, which is usually read as lean overhead.
- Both of those are true at once, and together they place the binding limit above the overhead line instead of inside it.
Contents
Four gross margins behind Hanssem stock, and the one at the bottom
I did not start with the Korean company. I started with a question about furniture retail generally, which is where a company’s money goes between the moment a customer pays and the moment anything reaches the operating line. Furniture is a category where the answer varies enormously, and I wanted to see how wide the spread actually is before I looked at any single name.
Why the gross line is the one I check first in this category
Furniture retailing sits between two very different business models. At one end are vertically integrated operators who design, source and sell their own product, and who capture the manufacturing spread as well as the retail spread. At the other end are marketplaces and distributors who move somebody else’s product and keep a thinner slice. The gross margin line separates those two worlds more cleanly than revenue does, and it sets a hard upper bound on what any amount of cost discipline downstream can deliver.
What the sorted list already tells me
A 27-point spread between the top and the bottom of a four-name list is not noise. It is the difference between two structurally different businesses wearing the same industry label. Before I read a single Korean filing, the sorted list told me that whatever this company’s operating problem is, I should look for it above the overhead line first.
What Hanssem stock is, for a reader outside Korea
Hanssem trades on the KOSPI under the code 009240. The KOSPI is South Korea’s main board, the larger of the country’s two domestic exchanges, and the rough equivalent in role to the NYSE; the smaller, more growth-weighted board is called the KOSDAQ. Hanssem is on the main board, and Korean coverage routinely describes it as the country’s largest furniture and home interior company. The only other listed Korean furniture name I have written up is a company small enough that its market value sat near a delisting threshold, which gives some sense of how concentrated this sector is on the exchange.
The share price and the size, as of the last session I can see
I am writing on Sunday, September 6, 2026, so the last close available to me is Friday, September 4, 2026, at KRW 37,400, or about USD 27.70. Market capitalization on that close is KRW 880.2 billion, roughly USD 652 million, on 23,534,759 shares outstanding. That multiplies out to KRW 880,199,986,600, which matches the vendor figure to the won. Book value per share on the same screen is KRW 24,081, which puts the shares at 1.55 times book, and trailing return on equity reads 12.3 percent. I mention those two together because they sit oddly beside a 1.06 percent operating margin for full-year 2025: a business earning twelve percent on its equity while earning one percent on its sales is turning that equity over quickly, which is a normal profile for retail and an unusual one for a manufacturer. Which of those two this company is turns out to be the question underneath everything below.
What the company actually sells
Two business lines carry most of the revenue. The first, branded Rehaus in Korean transliteration, is a business-to-consumer remodeling operation: a customer engages Hanssem to redo a kitchen or a bathroom, and Hanssem supplies the cabinetry, the fixtures and the installation through a dealer network. The second is home furnishing, meaning furniture and storage sold as product. There is also a business-to-business line supplying builders on new apartment projects, which Korean coverage calls the special-supply channel, and a consolidated subsidiary. In the June quarter, Rehaus and home furnishing together came to 65.84 percent of single-quarter revenue by my calculation.
The quarter behind the Hanssem stock headline
On Monday, August 10, 2026 the company reported second-quarter consolidated revenue of KRW 417.2 billion, about USD 309.0 million, and operating profit of KRW 11.3 billion, about USD 8.36 million. Korean coverage led with the profit figure, which was more than five times the year-ago quarter, and with the company’s own framing that this was a thirteenth consecutive quarter of operating profit (Korea Economic Daily, August 11, 2026).
The line the headline left out
Revenue in that same quarter fell 9.2 percent from the year-ago period. Both facts are in the same release. The five-times number and the minus-nine-percent number describe one quarter at one company, and a reader who takes only the first one home has the wrong picture of what is happening here. Korean trade coverage did carry the revenue decline (Newspim, August 11, 2026), so what separates the two accounts is emphasis, and nothing was left out.
The base the multiple was measured from
The year-ago quarter carried an operating margin of 0.49 percent by my calculation, against 2.70 percent in the quarter just reported. A five-times increase off a base of one half of one percent is arithmetically correct and economically small. The absolute increase was KRW 9.0 billion, about USD 6.7 million, at a company whose market value is roughly USD 652 million.
The peer table, and the dates in its footers
Here are the four names with the two margin columns, the distance between them, and the date each page was last stamped. Every row comes from the same vendor’s statistics pages so the definitions are consistent, and I have put the stamp date in its own column because the four pages were not refreshed on the same day.
| Company | Revenue (TTM, as displayed) | Gross margin | Operating margin | Distance | Page stamp |
|---|---|---|---|---|---|
| Hanssem (KOSPI: 009240) | KRW 1.70tn | 25.86% | 1.34% | 24.52 pts | Jul 31, 2026 |
| Nitori Holdings (TYO: 9843) | JPY 912.25bn | 53.21% | 13.29% | 39.92 pts | Jun 11, 2026 |
| Williams-Sonoma (NYSE: WSM) | USD 8.01bn | 45.69% | 17.85% | 27.84 pts | Sep 5, 2026 |
| Wayfair (NYSE: W) | USD 12.90bn | 30.35% | 2.07% | 28.28 pts | Sep 4, 2026 |
What I deliberately did not put in this table
There are no valuation columns here. The same vendor page shows a market capitalization for Hanssem that does not reconcile with the KRW 880.2 billion I calculated from the Korean close, and a price-to-earnings figure that does not reconcile with the Korean vendor’s either. I could not establish which share count or which earnings window produces the difference, so I dropped every price-derived column instead of carrying an unexplained figure into a comparison. The margin columns are ratios computed inside each company’s own income statement, which makes them the part of these pages I am willing to line up. I have made the opposite call before, on a Korean consumer name whose cheap multiples turned out to be tracking a customs timetable, where the price columns were the whole point and the margin columns were the distraction. Which set of columns carries the argument depends on what the argument is.
The gap between the two margins
The distance column is where this comparison stops being ordinary. Hanssem’s gross margin is the lowest of the four. Its operating margin is also the lowest of the four. And the distance between the two is the smallest of the four, at 24.52 points against 27.84 for Williams-Sonoma, 28.28 for Wayfair and 39.92 for Nitori.
The reading that column blocks
If a company posts a poor operating margin and a large gross-to-operating distance, the diagnosis writes itself: it makes money on the product and gives it back in overhead. That diagnosis is unavailable here. This company gives back less between the two lines than any of the three comparisons, and still finishes last. The shortfall was already there at the gross line.
How far apart the endpoints are
Nitori’s gross margin is 2.058 times Hanssem’s by my calculation. At the operating line the ratio widens to 9.92 times, and against Williams-Sonoma it is 13.32 times. Even Wayfair, an operator whose profit margin on that page is negative, posts an operating margin 1.54 times Hanssem’s. I want to be careful about what that does and does not prove. It does not prove the Korean company is badly run. A gross margin above fifty percent is what a vertically integrated operator tends to produce, and I did not verify how much of Nitori’s product it makes itself, so I am reading the margin as evidence of a model instead of asserting the model. On the Korean side the mechanism is visible in the business description: a remodeling job books the fixtures and the installation labor through revenue, and third-party value passing through the top line thins the gross ratio arithmetically. What it does establish is where any improvement has to come from.
One place a furniture retailer defends or loses the gross line is inventory, so I pulled the balance-sheet figures instead of assuming. Inventory at June 30, 2026 stood at KRW 94.95 billion, about USD 70.3 million, against KRW 105.28 billion a year earlier, a decline of 9.81 percent by my calculation. Set beside a single-quarter revenue decline of 9.19 percent, those two move almost in step, which means the stock on hand is being sized to the smaller business instead of piling up behind it. Expressed in days of single-quarter sales the figure was 20.7 in the June 2026 quarter against 20.9 a year earlier, and 22.1 at the end of 2022, the last full loss year. This is the part of the picture I find genuinely encouraging, and it is also the part that argues against the easy bear case. A retailer whose gross margin was thin because it was discounting through stale stock would show inventory days climbing while margins fell. Here the days are flat to slightly better and the cost-of-sales ratio improved year on year. The thinness is structural, and structural problems do not resolve themselves in a quarter.
Korean sell-side on Hanssem stock, and the June 9 filing
Three Korean houses are on the name and I can put a name to each view. I read none of the original notes; all three reached me through Korean secondary coverage or a broker screen, and I say so plainly here, since a reader cannot tell the difference from a citation alone.
| House | Date | Figure and stance |
|---|---|---|
| NH Investment & Securities | April 28, 2026 | Cut its valuation to KRW 56,000 from KRW 60,000, kept a buy stance. Modelled 2026 revenue of KRW 1,930.0 billion, up 10.9 percent, and operating profit of KRW 39.1 billion. |
| LS Securities (analyst Kim Se-ryeon) | August 12, 2026 | Held KRW 45,000 and moved the stance down to neutral, citing an unavoidable slowdown in Korean apartment transaction volume in the second half. |
| iM Securities (analyst Lee Sang-heon) | August 18, 2026 | Cut to KRW 52,000, kept a buy stance. Modelled 2026 revenue of KRW 1,600.3 billion, down 8.3 percent, and operating profit of KRW 33.5 billion. |
Two houses, opposite signs on the same line
NH has this year’s revenue rising 10.9 percent. iM has it falling 8.3 percent. The two revenue estimates are KRW 329.7 billion apart, which is 20.60 percent of the lower one by my calculation. On the operating profit line the two agree in direction, both projecting a large increase. First-half actuals came in at KRW 816.7 billion of revenue, down 9.55 percent year on year, and KRW 21.4 billion of operating profit, up 145.6 percent. That is 42.31 percent of NH’s full-year revenue figure and 54.62 percent of its operating profit figure, both by my calculation. Half a year in, the profit line is ahead of pace and the revenue line is behind it. The six-house consensus valuation printed on the Korean broker screen on Friday, September 4, 2026 was KRW 48,500.
Separately, on Tuesday, June 9, 2026, the company filed a medium-term shareholder return plan: a KRW 50.0 billion share repurchase running through December 2026 under a trust arrangement, cancellation as the stated default under revised Korean commercial and capital markets law, a quarterly dividend beginning with a June 30, 2026 record date, and a return target of at least 50 percent of adjusted net income on a parent-only basis (Newsis, June 9, 2026). The parent-only qualifier matters and I could not resolve it: 2025 consolidated net income was KRW 46.3 billion, and I do not know the parent-only adjusted figure, so I do not know what 50 percent amounts to in won.
Six conditions that would break this reading of Hanssem stock
| If this happens | Then what breaks |
|---|---|
| Third-quarter gross margin rises enough that gross profit in won exceeds the year-ago quarter | My claim that the limit sits at the gross line loses its most recent evidence |
| The vendor restates Hanssem’s gross margin materially away from 25.86 percent on a later page stamp | The entire ranking in my table is built on one figure that moved |
| Nitori’s and Hanssem’s revenue recognition scopes turn out to be closer than I assumed | My caveat about pass-through value stops excusing part of the gap, and the comparison gets harsher instead of kinder |
| NH’s 10.9 percent revenue growth arrives in the second half | My reading of the first-half pace as a directional signal was premature |
| Korean apartment transaction volume holds up despite the lending rules | The shared bear case from two of the three houses weakens, and so does the bear side of this piece |
| The KRW 50.0 billion repurchase and cancellation completes by December 2026 | Per-share figures throughout this piece need recomputing from that date |
On the fifth of those: Korea has tightened housing lending in four rounds since June 2025, with the most recent update in April 2026, capping jeonse deposit loans at KRW 100 million in the capital region and cutting the loan-to-value ratio for first-time buyers from 80 percent to 70 percent (The Korea Times, August 11, 2026). Remodeling demand in Korea tracks apartment turnover closely, which is why two of the three houses put the same sentence in their notes.
The date column I added after the fact
I want to record something I got wrong on a different company, because it decided how this table is built. A while back I put together a comparison of five names by pulling one metric from each company’s page on a data site, dropping the five numbers into a row, and writing three paragraphs off the ranking. Only afterwards did I notice that the pages had been refreshed on different days, and that two of them predated an earnings release the other three already included. The ranking I had written about was partly an artifact of when each page had last been touched.
So the date column in the table above earns its place. Hanssem’s page carries a July 31 stamp and Williams-Sonoma’s carries September 5, five weeks apart. I am comfortable using the margin columns anyway, because gross and operating margins move slowly at retailers of this size and because a five-week difference cannot plausibly close a 27-point spread. But I put the dates where a reader can see them instead of leaving them in my notes, and if I had needed a tighter comparison I would have had to wait for the pages to converge.
Where I stand on Hanssem stock
I do not own it, I have no order working, and I am watching for now. What I am watching for is specific, and it is not the profit line.
The profit recovery here is real and I do not want to talk it down. Consolidated operating profit went from a loss of KRW 21.7 billion in 2022 to a profit of KRW 18.5 billion in 2025, and the first half of 2026 ran at a 2.62 percent operating margin against 1.06 percent for full-year 2025. But annual revenue fell 12.81 percent between 2022 and 2025 by my calculation, and it fell another 9.55 percent in the first half of this year. A recovery built while the top line shrinks has a floor underneath it that the gross margin column defines. At 25.86 percent, that floor is close.
So I am waiting for one quarter in which revenue stops falling. Not a quarter in which it grows; a quarter in which it is flat against the year before. If that arrives while the gross line holds, the operating margin has somewhere to go, and I will rebuild this table with fresh page stamps and look again. Korea’s third-quarter reports are due by Monday, November 16, 2026, which is the next place to check.
The reason I can wait without feeling hurried is that the balance sheet has stopped arguing with the clock. Operating cash flow for the first half of 2026 came to KRW 29.44 billion, about USD 21.8 million, against negative KRW 1.19 billion in the same half of 2025. After capital expenditure of KRW 4.86 billion, free cash flow was KRW 24.58 billion, about USD 18.2 million, against negative KRW 10.33 billion a year earlier. On the September 4, 2026 market value that is a free cash flow yield of 2.79 percent by my calculation. Leverage has been coming down alongside it: total liabilities to equity stood at 141.57 percent at June 30, 2026, against 148.39 percent at the end of 2025 and 204.35 percent at the end of 2024, and I checked the June figure directly from KRW 567.6 billion of liabilities over KRW 400.9 billion of equity. Interest cover for the half was 2.70 times, which I get from KRW 21.36 billion of operating profit over KRW 7.91 billion of interest expense. I am holding that last number loosely: the data screen marks its basis as unknown, and I could not establish whether the reported interest line is pure interest or a wider finance-cost total, so I have not leaned on it anywhere in the argument above.
Why did I leave the company’s holding of its own shares out of the argument?
A third of the register is held by the company. iM Securities put the figure at 30.2 percent as of the end of June and expects roughly 35 percent once the current repurchase completes; the Korean broker screen showed 32.81 percent on September 4. That is a large number and it interacts with every per-share figure here. I left it out of the argument on purpose, because the question I set out to answer was where the upper bound on margin sits, and buying back shares does not move a gross margin.
What would make me revisit this before November?
A monthly Korean apartment transaction print that breaks the trend the two bearish notes assume, or a company disclosure of the parent-only adjusted net income base that the June 9 return target is measured against. The second one I cannot produce myself; the company decides whether that figure ever appears in a form I can read.
Prices and multiples in this piece reflect the Friday, September 4, 2026 close as checked at the time of writing. Peer margin figures carry the page stamp shown in the table and were not all refreshed on the same day. USD conversions are approximate, at roughly KRW 1,350.4 per dollar on that same date. Korean won is the reference currency throughout.