KCTech 2026 Earnings Forecast: Two Estimates 2.3 Times Apart
Contents
Two desks wrote down KCTech stock earnings for 2026 and the numbers do not match
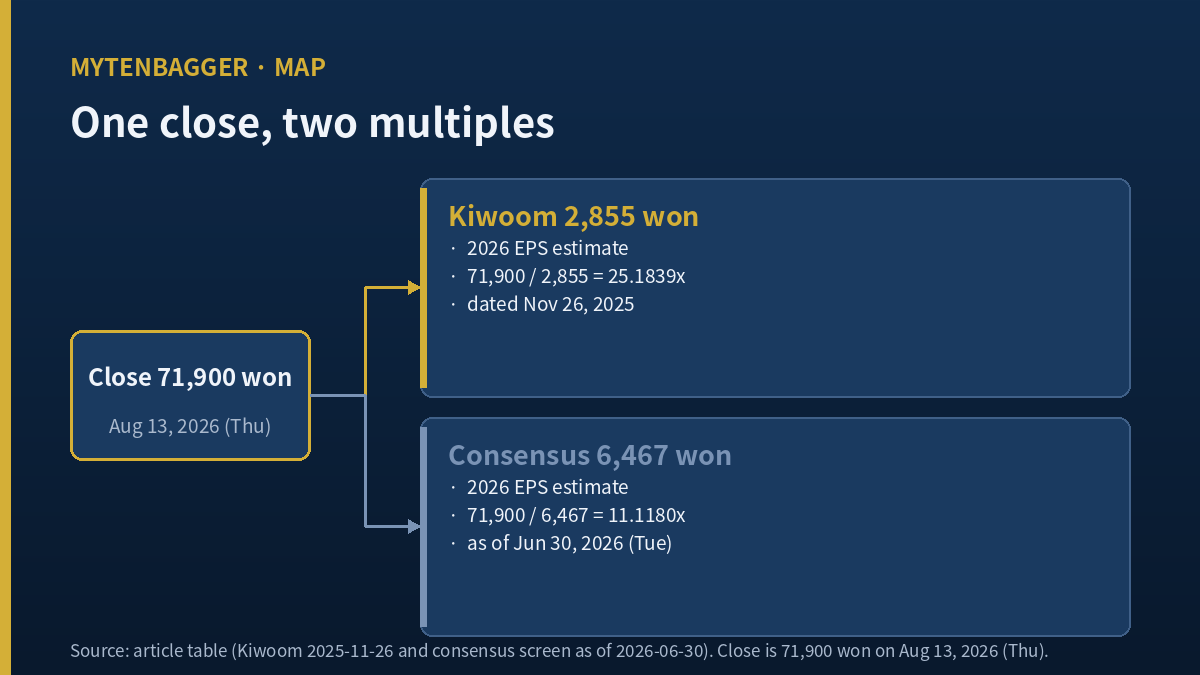
On November 26, 2025, analyst Park Yu-ak of Kiwoom Securities wrote 2,855 won ($2.01) as this company’s 2026 earnings per share. Seven months later, a Korean consensus screen carrying a June 30, 2026 (Tue) as-of date, and showing a single contributing house behind the figure, shows 6,467 won ($4.56) for the same line, the same fiscal year, the same company. The ratio between the two is 2.2651 times by my calculation.
I sat with those two figures longer than I meant to. A rounding gap I could explain. A consolidation-basis gap I could explain. A gap of more than two times is neither. One of those numbers describes a 2026 that looks broadly like 2025 for this business. The other describes a completely different year.
Nothing I have found lets me pick between them. That is what this piece is about.
What each forecast implies if it turns out to be the right one
If the 2,855 won line holds. The 71,900 won ($50.66) close of August 13, 2026 (Thu) sits at 25.1839 times 2026 earnings (my calculation). Q1 was a spike inside a cycle that has already gone down and come back once. The company earns something close to what it earned last year, and today’s price already spent that.
If the 6,467 won line holds. The same close sits at 11.1180 times (my calculation). Q1 was the first quarter of a different weight class, the front-end spending cycle carries through the year, and the price is roughly where a mid-teens grower would trade after a hard drawdown.
For reference, the year already closed. FY2025 delivered 2,577.64 won ($1.82) per share, which puts the same close at 27.8937 times (my calculation). That is a settled result and not a forecast, so it belongs beside the two above and not among them.
The two multiples are 14.0659 apart. Same company, same closing price, same fiscal year. The whole distance comes from which line you put underneath.
The company, the exchange, and what KCTech stock actually is
KCTech (KRX: 281820) trades on the KOSPI, the senior board of the Korea Exchange in Seoul. The KOSPI is where Samsung Electronics and SK hynix list; the KOSDAQ, Korea’s smaller venture board, is a separate market with lighter listing thresholds. This is not a KOSDAQ small cap. It is a mid-cap industrial on the main board, capitalized at 1,423.5 billion won (about $1.00 billion) at the August 13, 2026 (Thu) close on 19,798,661 listed shares.
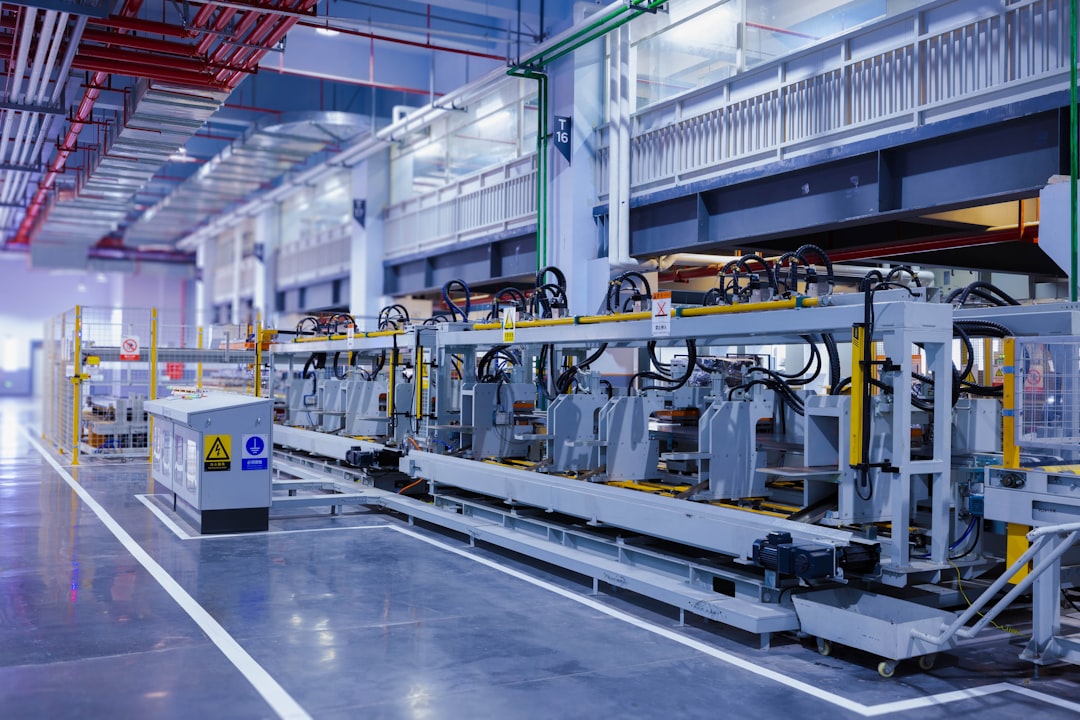
The business has two halves that most equipment names do not combine. It builds chemical mechanical planarization tools and cleaning tools, and it also makes the CMP slurry those tools consume. Equipment revenue is lumpy and arrives with fab build-outs. Slurry revenue is consumable and recurs with wafer starts. Its customers are Samsung Electronics and SK hynix, and the domestic share of revenue ran at 89.2% in Q1 2026 against 73.5% the quarter before, according to Korean trade outlet The Elec.
| Item | Value | Basis |
|---|---|---|
| Close | 71,900 won ($50.66) | August 13, 2026 (Thu) |
| Market capitalization | 1,423.5bn won ($1,002.9m) | Close x 19,798,661 shares (my calculation) |
| Price to book | 2.6773x | Close divided by Q1 2026 book value of 26,855 won ($18.92) |
| Price to sales | 3.7182x | Market cap divided by FY2025 revenue |
| Debt to equity | 16.09% | Q1 2026 consolidated |
| Dividend yield | 0.6259% | FY2025 payout of 450 won ($0.32) per share on the close |
| Foreign ownership | 11.37% | Kiwoom data, checked August 13, 2026 (Thu) |
Prices and multiples reflect the August 13, 2026 close as I checked them while writing, so live quotes can differ. Korean won is the reference currency throughout and dollar figures are approximate, converted at roughly 1,419.4 won per dollar on that same date.
The screen I pulled prices from is running one basis behind
The vendor screen shows a current price of 66,400 won while its own daily series ends at 71,900 won. Multiplying 66,400 by 19,798,193 gives 1,314,600,015,200 won, and the screen’s market capitalization field reads exactly 1,314.6 billion won. So every ratio on that screen sits on the August 10, 2026 (Mon) close. Its stated position against the 250-day intraday range (53.2% of the high, minus 46.8%, plus 132.2% off the low) reproduces to 53.2051%, minus 46.7949% and 132.1678% on that same 66,400.
Recomputed on the 71,900 won close I actually use: 57.6122% of the 250-day intraday high of 124,800 won ($87.92), a 42.3878% drawdown from it, and 151.3986% above the 250-day intraday low of 28,600 won ($20.15). On closing prices the one-year peak was 117,500 won ($82.78) on July 1, 2026 (Wed), and the lowest close after that peak was 55,100 won ($38.82) on July 30, 2026 (Thu), which is how the trough is defined in the series I used. Today sits 38.8085% below that peak and 30.4900% above that post-peak trough. The intraday high divided by the intraday low is 4.3636 times, and 250 trading sessions runs slightly longer than twelve months.
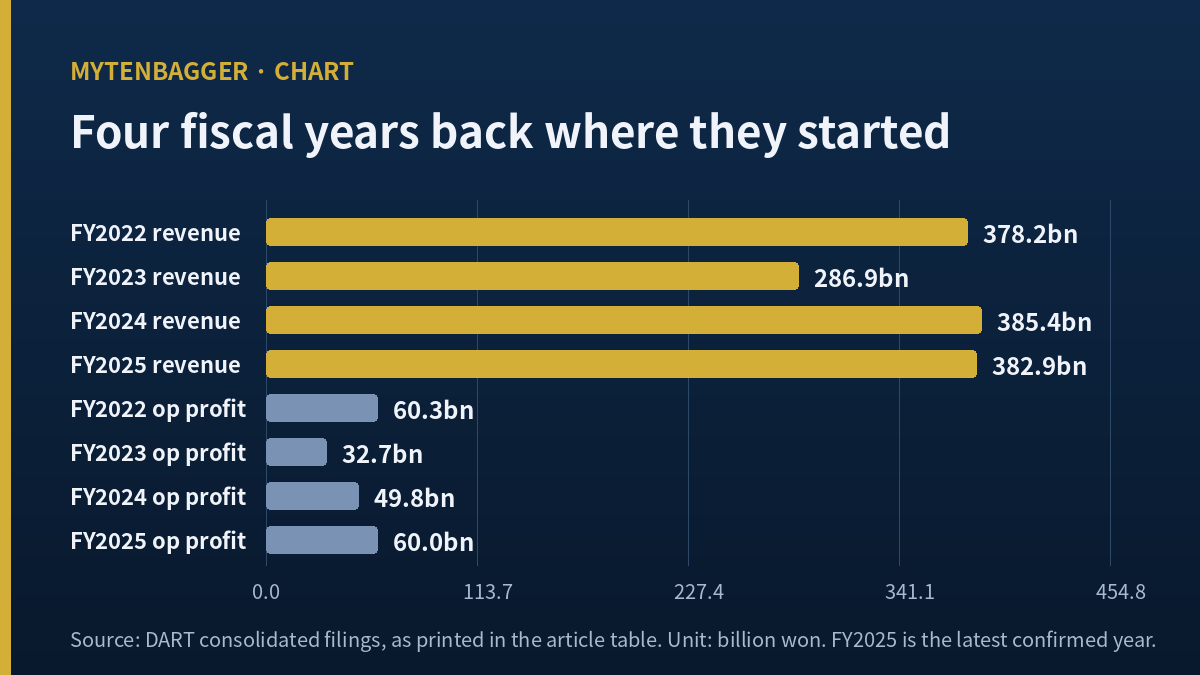
Four fiscal years that end up back where they started
| FY | Revenue | Operating profit | Operating margin |
|---|---|---|---|
| 2022 | 378.2bn won ($266.4m) | 60.3bn won ($42.5m) | 15.9538% |
| 2023 | 286.9bn won ($202.1m) | 32.7bn won ($23.0m) | 11.3984% |
| 2024 | 385.4bn won ($271.5m) | 49.8bn won ($35.1m) | 12.9161% |
| 2025 | 382.9bn won ($269.7m) | 60.0bn won ($42.2m) | 15.6625% |
Source: consolidated statements filed with Korea’s DART electronic disclosure system. Margins are mine, computed from the unrounded filed figures and not from the rounded columns shown here.
Read down the table and the outline is a dip and a recovery. FY2023 revenue came in 24.1367% below FY2022 and operating profit 45.7985% below it, and then the numbers walked back up. How precisely they walked back is the part I keep returning to. FY2025 revenue is 1.2332% larger than FY2022 and FY2025 operating profit is 0.6149% smaller (my calculations on both). Three years apart, two of the most important lines in this income statement are effectively the same size.
For a supplier bolted onto memory capital expenditure, that outline is ordinary. What is not ordinary is where the share price went while the income statement was making that round trip. Over the year ending August 11, 2026 (Tue), across 244 trading sessions, the shares returned 108.42% against 97.88% for the KOSPI. The sector comparison I leave for later in this piece, because it flips sign depending on how the sector is weighted.
Then one quarter broke the pattern
The Q1 2026 filing landed on May 13, 2026 (Wed) and does not fit anywhere in that series. Revenue 156.1 billion won ($110.0m), operating profit 34.8 billion won ($24.5m), net profit 31.6 billion won ($22.3m). Against Q1 2025 revenue of 77.7 billion won ($54.7m) and operating profit of 7.8 billion won ($5.5m), that is 101.0172% revenue growth and 344.2884% operating profit growth (my calculations). The margin of 22.2978% beats every full year in the table above.
That single quarter carried 40.7762% of FY2025 revenue and 58.0505% of FY2025 operating profit. The Elec reported that 147.2 billion won ($103.7m) of the quarter, or 94.3%, came from the semiconductor segment, and quoted the company crediting expanded supply of CMP tools, CMP slurry and cleaning tools for the jump.
Contract flow points the same way. On March 10, 2026 (Tue) the company disclosed a single supply contract with SK hynix worth 69.8 billion won ($49.2m), equal to 18.2314% of FY2025 revenue by my calculation. A Samsung Electronics supply contract in the region of 40 billion won ($28.2m) was filed on August 12, 2026 (Wed), which I have so far only seen through Korean secondary press.
Four dated records of what desks have put on KCTech stock
One disclosure before the table. I opened none of these as original research documents. Every line below reached me through Korean secondary coverage or an aggregator screen, so I have not read the paragraphs that justify any of these figures.
| Dated | House | The number that desk keeps on this name |
|---|---|---|
| April 9, 2025 | DB Securities, Seo Seung-yeon | 38,000 won ($26.77), cut from 46,000 |
| November 26, 2025 | Kiwoom Securities, Park Yu-ak | 45,000 won ($31.70), lifted from 34,000 |
| December 9, 2025 | DB Securities | 50,000 won ($35.23) |
| June 30, 2026 (Tue) | DB Securities, per consensus screen | 127,000 won ($89.47) |
Divide the bottom figure by the top and you get 3.3421 times across 447 days. The bottom entry is worth flagging twice: 127,000 won is what a consensus screen carries under that house’s name on that as-of date, not a report I have read. Measured from the December 9, 2025 mark of 50,000 won it is 2.5400 times across 203 days. The 127,000 sits 76.63% above the August 13, 2026 (Thu) close; the Kiwoom 45,000 sits 37.41% below it. Those are my calculations from the closing price.
Moving a number after a quarter like Q1 is the honest thing to do, and I am not scoring anyone for it. The table tells me about amplitude, and says very little about direction. If figures published under one house’s name can move more than three times inside fifteen months, then the 6,467 won sitting on the screen today has that same room in it.
The FY2025 forecast missed in two directions at once
Korean outlet DailyInvest, covering the April 9, 2025 note, printed the analyst’s full-year assumptions: revenue of 411.1 billion won ($289.6m) and operating profit of 55.0 billion won ($38.7m), on the reasoning that the main customer would spend conservatively on semiconductor capacity that year.
FY2025 arrived at 382.9 billion won of revenue and 60.0 billion won of operating profit. Revenue came in 6.8703% short of the estimate while operating profit came in 9.0273% ahead of it (my calculations). The two lines missed in opposite directions, which means the forecast missed on margin structure while getting the size of the business roughly right.
Where KCTech stock differs from the last case I wrote up
This will look adjacent to the piece where one quarter of profit beat an entire prior year. The raw material overlaps. The problem does not.
There, the problem was absence. The company published no annual outlook, nobody had written down what a full year should look like, and so I refused to stretch a quarter into a year. Here the problem is the mirror image. The number exists. In fact there are two of them, and they sit more than two times apart. What I am refusing to do is not stretching. It is choosing.
So this article never multiplies Q1 by four. That method belongs to the other piece, and running it again here would collapse two articles into one. Instead I took the two versions of 2026 that other people already built and looked at the space between them.
It also sits at a different level from the bonder monopoly piece, which asked whether a market share number would hold. Share is not the open question here. The open question is arithmetic on a single line item.
A global peer that already answered the variable I cannot settle
I did not pick the peer on size or on margin. I picked the company that has already published its own number for the variable my two forecasts disagree about. Both Korean estimates hinge on where front-end equipment spending goes in 2026, and Applied Materials (Nasdaq: AMAT) has put its name on an answer.
Its fiscal second quarter of 2026 was reported on May 14, 2026 (Thu). Revenue of $7.91 billion, up 11% year on year. Operating income of $2.52 billion for a 31.9% margin on a reported basis, net income of $2.806 billion, and reported earnings per share of $3.51. Semiconductor Systems alone did $5.965 billion at a 35.1% reported operating margin. For the following quarter the company guided to a midpoint of $8.95 billion in revenue and $3.36 in adjusted earnings per share, and in the same communication framed 2026 semiconductor equipment growth at more than 30%.
I have not put the two companies’ margins or multiples into a shared table and I do not intend to. The size gap runs past twenty times, the fiscal years start in different months, and the segment definitions are built differently. A table like that would appear to say far more than its inputs support.
What I take is one thing only. The variable that split my two Korean forecasts is a variable this American company has already committed a figure to, and that figure leans toward the higher of the two. That is a hint about direction. It is not an answer about the size of one Korean supplier’s profit, because a 30% industry expansion does not tell me how many tools one vendor ships into it.
What I could not confirm about KCTech stock
Paid-in capital and the share count disagree
The vendor screen puts paid-in capital at 10.4 billion won ($7.3m). Divided by 19,798,661 listed shares that is 525.29 won per share. Korean issuers use par values of 100, 200, 500, 1,000 or 5,000 won, and 525.29 is none of them. Working back from 500 won, paid-in capital of 10.4 billion won corresponds to exactly 20,800,000 shares. The gap against the listed count is 1,001,339 shares, which is 4.8141% of 20,800,000, or 5.0576% of the listed count (all my calculations).
Retiring treasury shares out of retained earnings leaves paid-in capital untouched under Korean practice, so I read that gap as treasury stock either held or already retired. I could not confirm which, and I could not confirm that par value is 500 won. If it is something else, every per-share figure in this article needs redoing.
I have no filed Q2 statements
One international earnings aggregator carries an August 5, 2026 (Wed) entry putting Q2 revenue at 162.6 billion won ($114.6m) against a market estimate of 135.0 billion won ($95.1m), a 20.42% beat. I could not find that figure in a filing or in Korean press. The same screen’s FY2025 fourth quarter entry of 113.5 billion won also differs from the 111.7 billion won I derive from the annual and nine-month DART filings. So every confirmed figure in this article stops at Q1. Korea’s statutory deadline for half-year reports falls on August 14, 2026 (Fri), and once that document lands the confirmed window here changes.
The rest of the open list
- Q1 2026 operating cash flow was negative 4.5 billion won ($3.1m) in a quarter with 34.8 billion won of operating profit, a swing of 39.3 billion won. Receivables are the obvious suspect and I did not open the notes.
- Book value of 26,855 won times 19,798,661 shares gives 531.7 billion won ($374.6m), while Q1 consolidated equity is 553.2 billion won ($389.7m). I have not settled the 21.5 billion won difference.
- The payout ratio field reads 17.5% while the raw field in the same response reads 43.3%. My own arithmetic gives 8.9 billion won ($6.3m) of dividends against 53.4 billion won ($37.6m) of FY2025 net profit, or 16.6868%. Three different values, so I used none of them.
- The share count itself varies by source: 19,798,193 on the Kiwoom feed against 19,798,661 on two Korean screens. A 468-share gap changes nothing material, but I could not establish which is authoritative.
- Korean secondary coverage puts cash and equivalents at 82.2 billion won ($57.9m) at the last settlement against 29.2 billion won ($20.6m) at the latest point that coverage gives, with investing cash flow of negative 105.7 billion won. FY2025 capital expenditure was 27.5 billion won ($19.4m), so the remainder went somewhere I have not identified. None of it entered my argument.
The harder wall behind the numbers
The wall that matters here is a language one. Both of the 2026 forecasts at the center of this article exist only in Korean. The 2,855 won line reached me through a Korean brokerage summary page and the 6,467 won line through a Korean consensus screen; neither has an English publication I could find. A reader who wants to check the single arithmetic claim this piece rests on has to read Korean screens or take my word for the transcription. On most Korean names the language gap costs you texture. Here it costs you the thing itself.
Four arguments against my own read of KCTech stock
- A consensus screen fed by one house may be normal, and my expectation may be the odd thing. A billion-dollar mid cap carrying any formal coverage at all is not guaranteed. I may be importing a large-cap expectation and then blaming the company for failing it, in which case this article is about my standards more than about the business.
- The confirmed facts already lean one way. A 22.2978% quarterly margin is the best in the series, the 69.8 billion won hynix contract is filed, and Korean trade press reports the company breaking into supercritical cleaning at a customer previously served by Tokyo Electron. Line up only what is confirmed and the lower forecast looks likelier to be the wrong one. If so, my refusal to choose is closer to laziness than to discipline.
- A two-times spread may be normal this early in a cycle. Right after earnings double, the choice of base period alone can produce this much dispersion between forecasters. What I called strange may be the ordinary appearance of a cyclical business at an inflection.
- I may be treating a dead number as live. The 2,855 won figure predates Q1 2026. It may have been revised since and I failed to find the revision, or it may have been withdrawn entirely. If I am propping up a retired estimate as one half of a live disagreement, the premise of this article falls apart. I cannot rule that out.
My position on KCTech stock and the marks I am writing down
The easiest available move is to split the difference. The arithmetic mean of 2,855 and 6,467 is 4,661 won ($3.28), which puts the close at 15.4259 times. It looks tidy. It also describes a 2026 that nobody forecast, that I never modeled, and that has no author. I will not use that average. When two people give different answers, calling the midpoint the answer is not calculation.
Three events would separate the two for me.
- The lower estimate moves. If Kiwoom lifts 2,855 won toward the neighborhood of 6,467 won, the disagreement resolves itself and the multiple becomes a single number I can work with.
- Q3 2026 results. One international earnings screen places the report on November 12, 2026 (Thu). A third observation tells me whether Q1 was an exception or a new base.
- Segment profit disclosure. If equipment and materials profits are broken out separately, I can compute where the margin came from myself and stop needing to pick between other people’s forecasts at all.
My thesis breaks in the same direction but with the opposite outcome. If the two estimates widen instead of converging, and particularly if one house cuts its 2026 figure after seeing everything Q1 showed, then this company’s 2026 is not something anyone can currently forecast. At that point my problem stops being that I cannot choose and becomes that I cannot see, and the name comes off my watchlist instead of staying on it.
For context on how I have treated neighbors: I took a view on an equipment maker whose monopoly had already cracked, and I have written about what one of this company’s two customers is actually selling at the leading edge. Staying on watch here has nothing to do with doubting the sector, and nothing to do with the drawdown. It has to do with there being two numbers where I need one.
a piece on what actually drove the July selloff
Primary sources: The Elec on Q1 2026 results · The Elec on the supercritical cleaning win · WiseReport company page · filing and ownership summary · DailyInvest on the April 2025 note · earnings aggregator screen · Applied Materials fiscal Q2 2026 release · Kiwoom research summary screen · Korean secondary coverage of the August contract and cash position
- Solbrain Earnings: Five Quarters of Profit Growth, Thinner Margin
- Why Korea’s PSK Dividend Lags Its KRW 249bn Cash Pile