Solbrain Stock Added Profit Five Quarters and Lost Margin
I put one sentence about Solbrain stock, “the profit bottom is behind us”, at three different filing dates
At the half-year report of August 14, 2025, the newest single quarter on file was Q2 2025: operating profit KRW 20.2bn (USD 15.0m), margin 8.81%. At that date the sentence had nothing to stand on.
At the third-quarter report of November 14, 2025, the newest cell was Q3 2025: KRW 34.4bn, margin 14.26%. One cell had lifted. The sentence was still early.
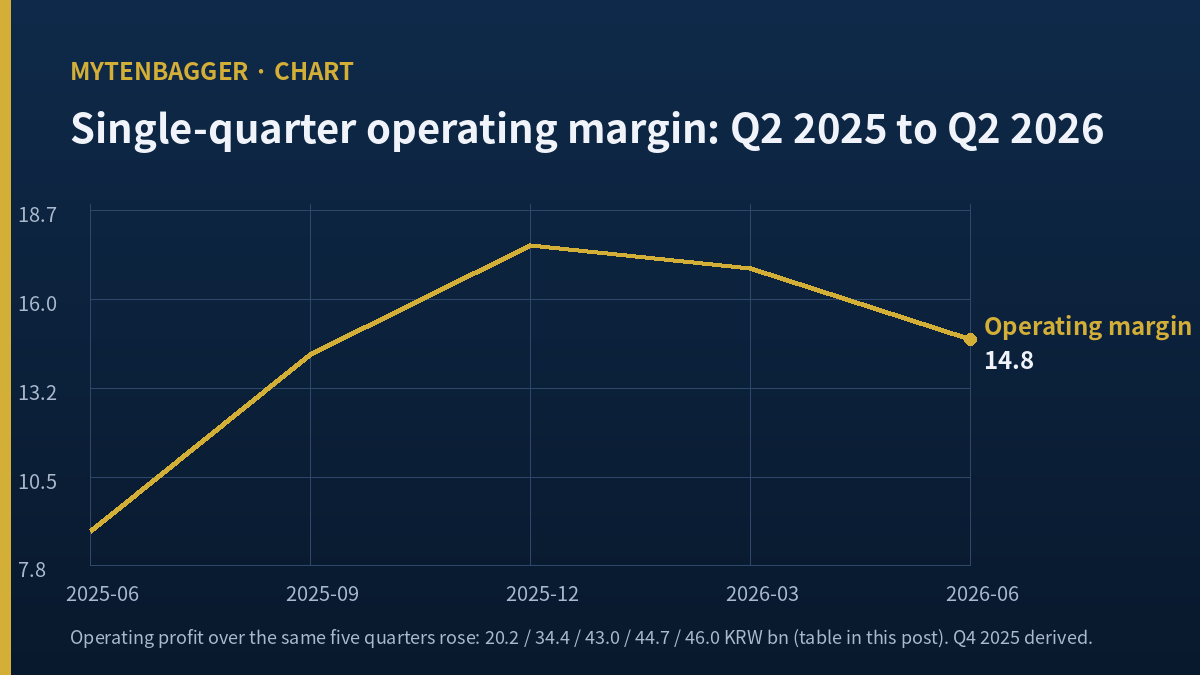
At the half-year report of August 14, 2026, five cells are stacked: KRW 20.2bn to 34.4bn to 43.0bn to 44.7bn to 46.0bn. The margin over those same five cells went 8.81 to 14.26 to 17.64, then back down to 16.94 and 14.75.
Not owned, no order, watching. Price basis is the September 8, 2026 close of KRW 325,500 (USD 241.90).
I write an investment journal, and this entry is about a company whose accounts told me three different things depending on how I folded them. The company trades on KOSDAQ, the smaller and more technology-weighted of the two boards run by the Korea Exchange, alongside KOSPI. The company makes wet process chemicals for chip fabrication, etchants above all, plus display materials.
The headline I started with was simple. Full-year operating profit fell from KRW 167.9bn in 2024 to KRW 133.6bn in 2025, down 20.43%. That sentence is true only inside the annual table. I unfolded the same account into ten filed quarters and had to rewrite my own note twice.
Contents
What Solbrain stock is priced on
I record the screen values before I touch anything. Kiwoom data, September 8, 2026 close: KRW 325,500 per share and 7,778,495 listed shares. Multiplied out that is KRW 2,531,900,122,500, which matches the printed market capitalization of KRW 2,531.9bn (USD 1.88bn) to the won. Par value of KRW 500 times the same share count gives KRW 3,889,247,500, matching the printed paid-in capital of KRW 3.9bn. Both checks close, so I am willing to use the rest of the screen.
All won-to-dollar conversions in this entry use one rate, the KRW per USD Seoul interbank close of 1,345.6 on 2026-09-08, up 5.1 won on the session, as carried by Korean press. I do not mix rates inside one entry.
The annual row and what it folds away
Filed consolidated annual figures, from the Korean regulatory filing system: 2023 revenue KRW 844.0bn with operating profit KRW 133.5bn, a 15.82% margin. 2024 revenue KRW 863.4bn with KRW 167.9bn, 19.45%. 2025 revenue KRW 923.4bn with KRW 133.6bn, 14.47%. First half of 2026, revenue KRW 575.8bn (USD 427.9m) with KRW 90.7bn (USD 67.4m), 15.76%. Every margin there is my own division of the two filed lines.
The 2022 row carries revenue of KRW 1,090.9bn but its operating profit cell is empty in the filing feed, so I left the year out of my table instead of estimating it. An absent number stays absent.
Read only those four rows and the story is one sentence long. Margin was 19.45%, fell to 14.47%, recovered a little to 15.76%. The vendor screen has a year-on-year operating profit field and it reports minus 20.43%, which is exactly the 2024 to 2025 step. That figure is correct. What it is not is current. It describes December 31, 2025.
Solbrain stock across ten filed quarters
Quarterly flow items in Korean filings are cumulative, so I subtracted each cumulative figure from the one before it to get single quarters. Fourth quarters are not filed separately at all, so those cells are the full year minus the nine-month cumulative, and I label them as derived.
| Quarter | Revenue | Operating profit | Operating margin |
|---|---|---|---|
| Q2 2025 | KRW 228.8bn | KRW 20.2bn | 8.81% |
| Q3 2025 | KRW 241.1bn | KRW 34.4bn | 14.26% |
| Q4 2025 (derived) | KRW 244.0bn | KRW 43.0bn | 17.64% |
| Q1 2026 | KRW 263.8bn | KRW 44.7bn | 16.94% |
| Q2 2026 | KRW 312.0bn | KRW 46.0bn | 14.75% |
Single quarters built by subtracting consecutive cumulative filings. Q4 2025 is the full year less the nine-month cumulative. Margins are my own division.
Where the bottom actually sits
KRW 20.2bn, in the second quarter of 2025. The five cells before it, which I built the same way, run KRW 46.0bn, 45.8bn, 39.7bn and 36.4bn through 2024 and then KRW 36.0bn in Q1 2025. Six cells stepping down in a row, and the last of them is 20.2. Everything after it goes up: 34.4, 43.0, 44.7, 46.0.
The annual table cannot show that movement, and I do not call this a defect. An annual row exists to compress. What I do notice is that a reader who stops at “the company had a weak 2025” is carrying an eight-month-old reading into a live decision. The company had a weak second quarter of 2025 and four better quarters after it, and both of those facts live inside the single number KRW 133.6bn.
The same table sorted by margin instead of amount
This is where my note broke. The amounts rise for five cells straight. The margins do not. They go 8.81, 14.26, 17.64, then 16.94 and 14.75. The Q2 2026 margin of 14.75% sits 2.89 percentage points under the Q4 2025 peak of 17.64% and only 0.49 points above the Q3 2025 reading of 14.26%.
The arithmetic behind it is inside the same table. Revenue grew faster. Between Q4 2025 and Q2 2026 revenue added KRW 68.0bn, from 244.0 to 312.0, while operating profit added KRW 3.0bn, from 43.0 to 46.0. Of the incremental revenue, 4.41% survived to the operating line. The company as a whole keeps 14.75%. So the growth arriving now is thinner than the base it is being added to.
Three things this calculation does not do
First, I could not confirm from a company filing why the incremental revenue carries so little operating profit. A raw material explanation exists on the sell-side, which I quote further down, but I did not find it in a disclosure. I am leaving the arithmetic standing and inventing no cause for it.
Second, the Q4 2025 cell is derived. Year-end adjustments land entirely in that one cell when you build it by subtracting, so I cannot tell whether the peak sitting there is quarterly operating reality or a closing effect.
Third, these are consolidated figures and I did not verify that the consolidation scope held constant across the ten quarters. The non-controlling interest balance on this balance sheet went from KRW 55.8bn at the end of 2025 to KRW 162.2bn at June 30, 2026. I could not identify what produced that move, so I did no work in this entry that splits parent from minority.
None of the three reverses the direction of either series, in my reading. All three move the size.
Solbrain stock and the half year just filed
Half-year cumulative revenue is KRW 575.8bn against KRW 438.3bn a year earlier, up 31.37%. Operating profit is KRW 90.7bn against KRW 56.2bn, up 61.37%. Taking the second quarter alone against the same quarter last year, revenue went from KRW 228.8bn to KRW 312.0bn, up 36.34%, and operating profit from KRW 20.2bn to KRW 46.0bn, up 128.17%.
Those growth figures are large because the comparison base is the trough cell. That is the same point from the other side.
One more thing sits in that quarter. Revenue of KRW 312.0bn is the largest single quarter anywhere in the ten cells I built, and the margin attached to it, 14.75%, is the third lowest of the last five. The best top line and a middling conversion rate arrived in the same three months.
By segment, a Korean trade press tally puts Q2 2026 semiconductor materials at KRW 267.3bn and display materials at KRW 23.2bn. Semiconductor materials alone are 85.68% of the quarter, which is my own division. The two lines add to KRW 290.5bn against a quarterly total of KRW 312.0bn, leaving KRW 21.5bn the tally does not name. I could not identify it either.
The balance sheet moved a lot over the same span. Total liabilities went KRW 76.6bn at the end of 2023, KRW 130.9bn at the end of 2024, KRW 335.2bn at the end of 2025, and KRW 288.4bn at June 30, 2026. As a ratio to equity that is 8.34%, then 12.62%, then 30.15%, then 21.99%. The 2025 step is the one that stands out: liabilities roughly two and a half times larger inside one year, against total assets that went from KRW 1,168.2bn to KRW 1,446.8bn over the same year. I did not trace what was borrowed or for what, so I am recording the path and stopping there.
Cash generation in the half year is filed as operating cash flow of KRW 93.5bn (USD 69.5m) against capital expenditure of KRW 38.2bn, leaving free cash flow of KRW 55.3bn. Half-year operating cash flow of KRW 93.5bn sits just above half-year parent-attributable net income of KRW 91.0bn, which is the relationship I would want to see and not always the one I find. Capital expenditure at KRW 38.2bn equals 42.0% of that net income, so a meaningful share of what the company earned this half went back into plant. What I cannot do is put a depreciation figure next to it, because Korean filings carry depreciation in the notes and not in the statement feed, so the point at which this spending starts pressing on the operating line is not something I can date from here.
Inventory went from KRW 91.0bn at the end of 2024 to KRW 156.7bn at June 30, 2026. The days-of-inventory field on the same screen went from 31.8 days in Q3 2024 to 45.7 days in Q2 2026. Inventory grew alongside revenue and slightly ahead of it. I am marking that cell to look at again, and I am not calling it a warning.
What the 32 times is divided by
The screen prints a trailing price to earnings ratio of 32.03. I wanted to know which profit sits underneath it. Parent-attributable net income for 2025 was KRW 79.1bn; divided by 7,778,495 shares that is KRW 10,163 per share, against the printed earnings per share of KRW 10,164. Dividing KRW 325,500 by KRW 10,163 returns 32.03. So the profit underneath that ratio is the parent-attributable KRW 79.1bn, and the consolidated KRW 84.0bn plays no part in it.
The payout ratio closes on the same basis. The dividend of KRW 2,350 per share (USD 1.75) over KRW 10,163 is 23.12%, against a printed 23.1%. The raw payout field on the same screen reads 53.2 and reproduces from nothing I tried, so I did not use it.
I dropped book value entirely. The printed book value per share of KRW 138,715 matches none of the four candidates I computed: KRW 135,729 on 2025 parent equity, KRW 142,904 on 2025 consolidated equity, KRW 147,759 on June 2026 parent equity, KRW 168,614 on June 2026 consolidated equity. Since I cannot say which date and which equity built it, the price to book ratio is out of this entry. A blank from a failed check beats a plausible wrong number.
I dropped the interest coverage figure of 4.32 for the same reason. The cost line underneath it, first-half finance costs of KRW 21.0bn, set against total liabilities of KRW 288.4bn at June 30, 2026, implies 7.3% in half a year for a company carrying a 21.99% debt-to-equity ratio. That looks like total finance costs including derivative and currency items, not pure interest, and I could not confirm the composition.
Two Korean houses on Solbrain stock four months apart
Two named Korean brokerages are on the record. Daishin Securities, analyst Ryu Hyung-geun, published on May 28, 2026 with a buy opinion and a KRW 530,000 valuation, citing first shipments of acetic-acid-based etchant from the Taylor, Texas plant and a glass substrate pilot line. The same note carried anhydrous hydrogen fluoride cost inflation as a risk to etchant profitability, judged temporary through the second quarter.
Meritz Securities, analyst Kim Dong-kwan, appears in August 18, 2026 Korean press coverage with a buy opinion and a KRW 450,000 valuation, raised from KRW 430,000. The reasoning there is customer DRAM fab start-up, completion of the Xian NAND conversion, and price increases under negotiation, with quarterly operating profit estimates of KRW 54.8bn for Q3 and KRW 55.9bn for Q4.
I do not average KRW 530,000 and KRW 450,000. Different houses, different dates, and the KRW 80,000 gap between them is itself the useful item: it is how wide the estimation error on this name has been over four months. One coincidence is worth noting. The May figure of KRW 530,000 is the same number as the highest intraday price this stock touched in the last 250 trading days.
Solbrain stock beside three global materials makers
I looked for listed companies whose revenue comes from chemicals sold into chip and display fabrication. Three qualify without stretching the definition. I am not ranking them, because they do not sell the same basket, and I left market capitalization out of the table so that three reporting currencies never have to be forced onto one line.
| Company | Period and screen date | Revenue | Operating margin | Currency |
|---|---|---|---|---|
| Solbrain | H1 2026, filed 2026-08-14 | 575.8bn | 15.76% | KRW |
| Entegris | Trailing 12 months, screen 2026-09-08 | 3.33bn | 16.76% | USD |
| DuPont de Nemours | Trailing 12 months, screen 2026-09-08 | 6.99bn | 13.64% | USD |
| Tokyo Ohka Kogyo | Trailing 12 months, screen 2026-08-31 | 265.07bn | 21.27% | JPY |
Peer figures from a US market data screen sourced to S and P Global Market Intelligence, screen dates as printed in the table. The three screen dates differ and I did not align them.
I checked each peer row before using it. Entegris at USD 141.09 times 152.80m shares returns USD 21.56bn, matching its printed market value, and USD 141.09 over earnings per share of USD 2.00 returns the printed 70.50. Tokyo Ohka at JPY 8,607 times 119.98m shares returns JPY 1,032.7bn against a printed JPY 1.03tn, and JPY 8,607 over JPY 334.56 returns the printed 25.73.
DuPont did not check out the same way. Its printed price to earnings ratio of 59.72 does not come from its own printed earnings per share of USD 0.39, which would give 336.7 at USD 131.32. Revenue and operating margin are what I took from that row, and no earnings-based ratio column exists in my table for exactly that reason.
Owning Solbrain stock from outside Korea
There is no American depositary receipt for this company. A foreign holder reaches it through a broker with direct Korea Exchange access, and KOSDAQ names of this size carry wider spreads than the KOSPI large caps that dominate index products.
Foreign ownership on the September 8, 2026 screen is 30.63% of shares, and the credit-financed share balance is 0.54%. I record both and use neither as a signal.
Six readings that go the other way
- Margin has fallen twice. 17.64 to 16.94 to 14.75. That fact and the five rising amounts are printed in the same table.
- Revenue has not passed 2022. KRW 1,090.9bn remains the annual high and 2025 at KRW 923.4bn is KRW 167.5bn below it. Doubling first-half 2026 revenue of KRW 575.8bn gives KRW 1,151.6bn, which would clear it by KRW 60.7bn.
- Return on equity of 7.7% fails the screen checklist. Five of seven items pass for a score of 71, and the two that fail are return on equity and the earnings ratio.
- The 32.03 ratio divides by a finished year. Dividing by the year in progress would give a different answer, and I do not build ratios on a profit figure that has not been filed.
- Raw material risk is written into the sell-side note itself. Anhydrous hydrogen fluoride cost pressure on etchant profitability. The judgment that it is temporary belongs to that note and is not a confirmed outcome.
- The shares sit well below the 250-day high. On closing prices the high is KRW 501,000 on March 6, 2026 and the September 8, 2026 close is 35.03% below it. The closing low over the same window is KRW 202,000 on September 3, 2025, so the current close is 61.14% above that.
That last line comes with a tool note. The screen reports a 250-day high and low of KRW 530,000 and KRW 200,000 and labels the basis as adjusted closing prices. Counting the series myself, the closing extremes are KRW 501,000 and KRW 202,000; the KRW 530,000 and KRW 200,000 figures are intraday prints from January 30, 2026 and September 3, 2025. The label says close and the values are intraday. The drawdown differs accordingly, 38.58% on the screen against 35.03% on closes, a gap of 3.55 points. I used the series I counted.
A buyback item belongs here too. A July 31, 2026 trust agreement filing commits KRW 12.0bn (USD 8.9m) through February 1, 2027 and states an expected purchase of 53,452 common shares. That share count is KRW 12.0bn divided by KRW 224,500, the close on July 30, 2026, the prior session; 53,452 times 224,500 is KRW 11,999,974,000. At the September 8, 2026 close the same KRW 12.0bn buys 36,866 shares. The filing also states 7,778,566 shares issued, which is 71 more than the 7,778,495 on the market data screen, and I could not resolve which date each reflects. For scale, KRW 12.0bn is 0.47% of the market value of the company and 21.7% of the free cash flow the company generated in the first half alone, so as a support mechanism it is modest against the cash the business is currently throwing off.
Two entries where I read the same industry differently are a wet chemicals maker that beat the index and lost to its own sector and a slurry and equipment maker whose two 2026 forecasts differ 2.3 times. A third, on an electrolyte additive maker that grew revenue a third and lost its margin, is the closest relative of this entry: same direction, much larger magnitude.
Where I stand on Solbrain stock
Not owned, no order, watching. At KRW 2,531.9bn (USD 1.88bn) the company sits outside the largest hundred listings in Korea, and I do not take trading positions on names in that band.
I began this entry holding a note that read “2025 was the bottom, 2026 is the recovery.” The screen’s minus 20.43% and the half-year plus 61.37% both support it, and on those two figures alone the note is correct. After stacking ten quarters I revised it to “the bottom was Q2 2025.” After sorting the same ten cells by margin I revised it again, to “the low in amount and the peak in margin are in the same table at different addresses.” That second revision is the whole of what I have here.
So what I keep is not a verdict but two conditions. The one that kills my reading is a Q3 2026 single-quarter operating margin below 14.75%, which would make the two-quarter decline a direction instead of a bump. The one that confirms it is a Q3 operating profit above KRW 46.0bn, making six consecutive rising cells, together with a margin back above 14.75%. If only one of the two lands I hold this table one more quarter. The check date is on or after November 16, 2026.