KG Mobility Stock and Four Years Under One Percent
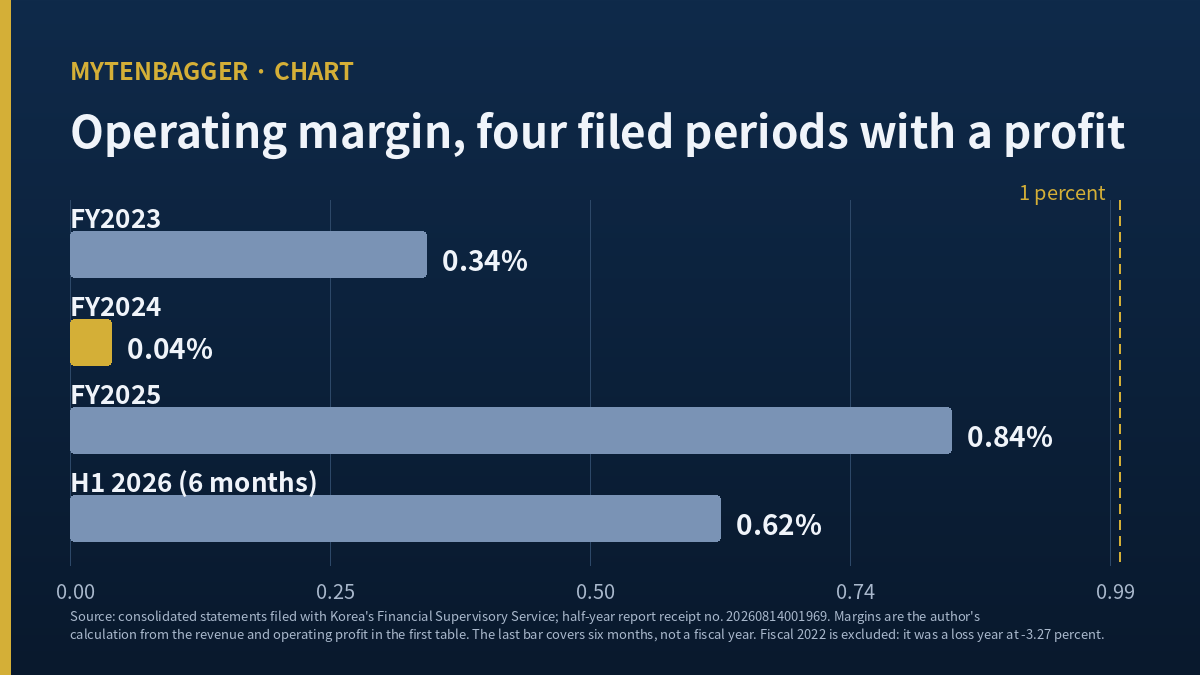
I keep a line in my notes for companies that are profitable and almost nothing else. KG Mobility stock (KOSPI: 003620) belongs on it. The company has reported an operating profit in each of the last four filed periods I can check, and in not one of them did the operating margin reach one percent of revenue. The best year was 0.84 percent. The worst positive year was 0.04 percent.
Three numbers I worked out before writing anything else
- Fiscal 2024 revenue of 3,905,069 million won produced an operating profit of 1,432 million won. That is 0.04 percent, by my calculation.
- The company’s own July release put first-half operating profit at 30.5 billion won on a parent-only basis. The consolidated half-year filing it submitted two and a half weeks later shows 14,811 million won.
- Trailing operating profit of 37,272 million won (my sum of four filed periods) against consolidated equity of 1,526,179 million won is an operating return on equity of 2.44 percent, by my calculation.
Contents
Four filed years, and what KG Mobility stock earned in each
All figures below come from the company’s consolidated filings with Korea’s Financial Supervisory Service. The margin column is mine. KOSPI is the senior board of the Korea Exchange, the larger of the country’s two listing tiers, and KG Mobility is one of five domestic vehicle manufacturers on it.
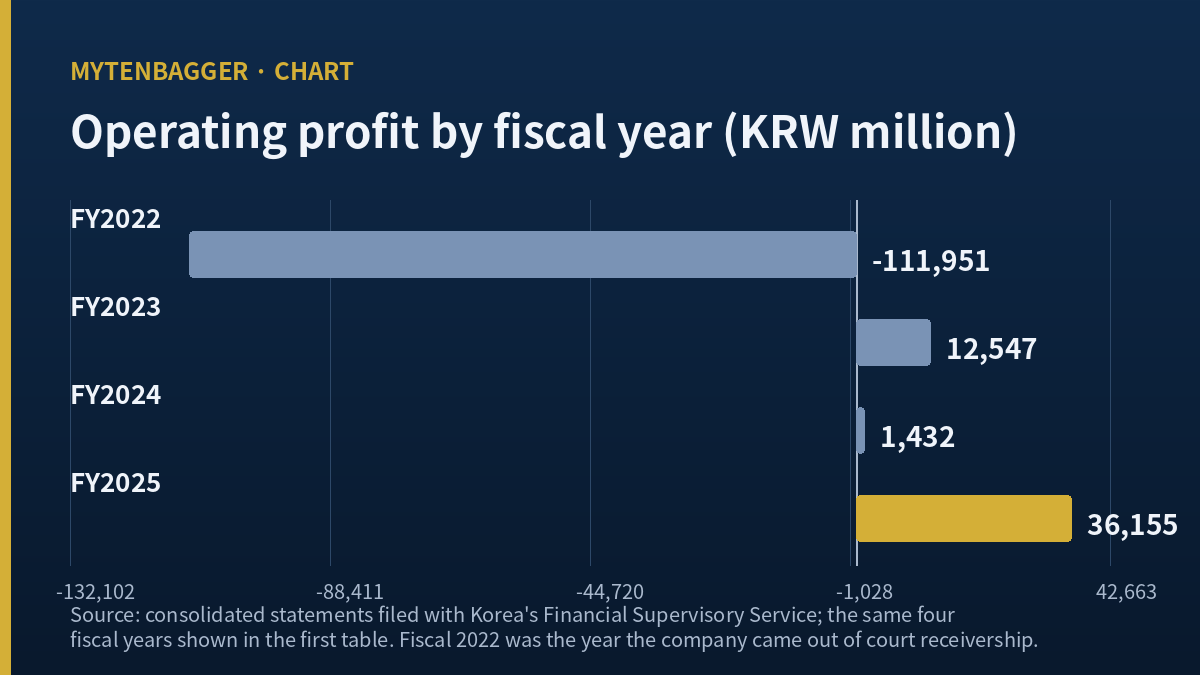
| Fiscal year | Revenue (KRW m) | Operating profit (KRW m) | Operating margin (my calculation) |
|---|---|---|---|
| 2022 | 3,423,340 | -111,951 | -3.27% |
| 2023 | 3,736,368 | 12,547 | 0.34% |
| 2024 | 3,905,069 | 1,432 | 0.04% |
| 2025 | 4,303,636 | 36,155 | 0.84% |
| First half 2026 (6 months) | 2,375,337 | 14,811 | 0.62% |
The bottom row covers six months while the four rows above it each cover twelve. I have not drawn a line through all five points, because four of them are annual and one is not. Source: consolidated statements filed with the Financial Supervisory Service; the half-year report carries receipt number 20260814001969.
Four rows, one sign change, and a ceiling nobody has broken. The 2022 loss came in the year the company was pulled out of court receivership by the KG Group, so the negative row is a different kind of year from the three that follow it. What holds my attention is how the recovery is put together: revenue rose 25.7 percent from 2022 to 2025, and the operating line went from minus 111,951 million won to plus 36,155 million won. That is a real turn. It is also a turn that ends at 0.84 percent.
I want to stay on fiscal 2024 for three paragraphs, because it is the row that made me write this piece. Revenue of 3,905,069 million won is not a small business. Against that, the operating line was 1,432 million won. For every 10,000 won of vehicles the company billed that year, just under four won survived to the operating line, by my calculation.
What makes the row stranger is the one above it. Revenue rose 4.52 percent from 2023 to 2024, by my calculation, and operating profit fell 88.59 percent over the same step, from 12,547 million won to 1,432 million won. More vehicles billed, almost nothing kept. I have not found a public breakdown that separates how much of that came from input costs, how much from model mix and how much from the cost of running an export push, so I am recording the pair and leaving the cause open.
A company can post a number like that and still be worth owning. Operating leverage is real; a business sitting at breakeven can look very different one year later if volume moves. And 2025 did move: 36,155 million won is more than twenty-five times the 2024 figure. But I want to be honest about what that comparison is. When the base is 1,432 million won, a multiple of twenty-five describes the base and says little about the business. The absolute margin went from 0.04 percent to 0.84 percent. Both of those are under one percent.
Two operating profit figures for the same six months
On 28 July 2026 the company released first-half results. Korean press covering that release, including Newspim and ZDNet Korea, reported revenue of 2,318.8 billion won, operating profit of 30.5 billion won and net profit of 55.1 billion won, and both outlets noted the figures were parent-only. On 14 August the company filed its consolidated half-year report. That document shows operating profit of 14,811 million won.
Neither figure is wrong. They are different statements. The parent-only accounts cover the Korean manufacturing entity; the consolidated accounts fold in the subsidiaries. What the pair tells me is that the group’s non-parent operations subtracted from the operating line over those six months. They did not add to it. I have not located a segment note that breaks this down, so I am describing the direction only.
The press release was the first document I opened
Here is the part of my own process I got wrong. The press release was the first document I opened, and I had already written 30.5 billion won into a draft table before I pulled the consolidated filing. It sat there for the better part of an hour looking like a fact. I have written before about grading a source by who published it; this was a case of grading it by which document arrived first. A company release is a primary source about what the company wants to say and a secondary source about what the company earned. I know that, and I still typed the number in.
The balance sheet holding up KG Mobility stock
At 30 June 2026, on a consolidated basis: total assets 3,876,729 million won, total liabilities 2,350,550 million won, total equity 1,526,179 million won. Liabilities and equity sum to assets exactly, which is the first thing I check when a vendor screen and a filing disagree about anything. Dividing liabilities by equity gives 154.02 percent, and that matches what the screen labels as the debt ratio, so I know the screen is on a consolidated basis too.
Two features of that balance sheet matter to me. First, non-controlling interests are zero: the whole 1,526,179 million won belongs to the parent’s shareholders. After two pieces this month where a Korean issuer’s headline profit and its profit belonging to the parent’s owners went in different directions, it is a relief to find a company where that particular question does not arise. Second, the liability side has grown about 2.6 times since 2022, when total liabilities stood at 909,004 million won. The recovery from receivership was funded as well as earned.
What the market pays for KG Mobility stock against that equity
At the 7 September 2026 close of 2,730 won, on 202,374,912 shares outstanding, market capitalization works out to 552.48 billion won, or about US$412 million. Against consolidated equity of 1,526,179 million won, the market is paying 0.362 times book, by my calculation. Book value per share works out to 7,541 won on the same two inputs.
A third of book is the sort of number that makes a value screen light up. The four rows in my first table are why I do not treat it as a conclusion. A discount to book compensates for something, and the thing it is compensating for here is visible in plain sight: this equity base has never produced more than 0.84 percent on revenue, and my trailing calculation puts the return on that equity at 2.44 percent. If a business earns 2.44 percent on its own capital, paying a third of that capital for it is not obviously generous. It may be exactly right.
The June quarter on its own
Quarterly flow items in Korean filings are cumulative, so a quarter has to be extracted before it can be read. For the three months to 30 June 2026 I get revenue of 1,233,965 million won, operating profit of 5,222 million won and net profit of 14,898 million won. That is an operating margin of 0.42 percent for the quarter, by my calculation, and it is the weakest of the two quarters filed this year.
Six quarters of margin, extracted the same way, put my own headline under pressure:
| Quarter | Operating profit (KRW m) | Operating margin (my calculation) |
|---|---|---|
| Q1 2025 | 5,681 | 0.62% |
| Q2 2025 | 8,013 | 0.81% |
| Q3 2025 | 1,420 | 0.12% |
| Q4 2025 | 21,041 | 1.78% |
| Q1 2026 | 9,589 | 0.84% |
| Q2 2026 | 5,222 | 0.42% |
Each row is a single quarter, extracted from cumulative filings. The Q4 2025 row is not filed on its own: it is the full year minus the nine-month cumulative figure, so it carries whatever year-end adjustments the annual accounts contain.
The Q4 2025 cell clears one percent, and clears it comfortably. That is the strongest argument against the sentence I opened this piece with, so I would rather put it in a shaded row than in a footnote. My claim is about annual and half-year results, where the ceiling has held in every filed period. At the quarterly level it has not held, once, in a quarter I had to construct by subtraction. Whether that quarter is a seasonal fourth-quarter effect, a year-end accounting effect, or the first sight of a genuinely higher run rate is exactly what the November filing will start to answer.
Net profit above operating profit is the other feature of that quarter, and it repeats at the half-year level, where consolidated net profit of 42,189 million won sits well above the 14,811 million won operating line. I am not building an argument on that spread. A colleague piece I published a few days ago leaned on exactly that structure at a different company, and running the same move twice in one week would say more about how I work than about either issuer.
Three Japanese automakers and one column I calculated
Korea’s two large automakers are the obvious domestic comparison, and I have written about both; when I chose one of them over the other earlier this year the deciding inputs were tariff exposure and payout, neither of which applies at this scale. So I went to Japan instead, for manufacturers closer to this company in position if not in size.
| Company | Operating income | Total equity | Operating income ÷ equity (my calculation) | Period and currency |
|---|---|---|---|---|
| KG Mobility (KOSPI: 003620) | 37,272 | 1,526,179 | 2.44% | KRW m; income is trailing twelve months to 30 Jun 2026, summed by me from four filed periods; equity at 30 Jun 2026 |
| Mazda Motor (TYO: 7261) | 130,530 | 1,924,950 | 6.78% | JPY m; income trailing twelve months to 30 Jun 2026; equity at 31 Mar 2026 |
| Mitsubishi Motors (TYO: 7211) | 79,967 | 961,642 | 8.32% | JPY m; both trailing twelve months to 30 Jun 2026 |
| Suzuki Motor (TYO: 7269) | 620,480 | 4,153,108 | 14.94% | JPY m; income trailing twelve months to 30 Jun 2026; equity at 31 Mar 2026 |
Japanese figures from stockanalysis.com: Mazda, Mitsubishi Motors, Suzuki. Korean figures from the company’s consolidated filings. I have converted nothing; each row is in its own reporting currency and the ratio column is dimensionless.
Why these three and why not the obvious ones
I wanted manufacturers whose position resembles this one: mid-scale, SUV-weighted or small-car-weighted, dependent on export markets, and sitting under a much larger domestic rival. Mazda, Mitsubishi Motors and Suzuki fit that description in Japan better than Toyota or Honda would. None of the three is a size peer, and because every row is stated in its own currency this table cannot rank them by size at all. The ratio column is the only cell that carries a comparison across the four rows, which is why it is the only cell I have used in the argument.
Where the periods do not line up
Two rows mix period ends. Mazda’s and Suzuki’s operating income covers the twelve months to 30 June 2026 while their equity is stated at 31 March 2026, the close of their fiscal years. Mitsubishi Motors and KG Mobility have both halves of the ratio struck at 30 June 2026. Equity moves slowly enough that a three-month offset does not usually reverse a ranking of this size, but it is a defect in the table and I would rather write it down than let a reader assume four clean rows.
What a margin figure will not tell me about KG Mobility stock
A margin is a ratio, and ratios hide scale. This company sells vehicles, and vehicles are counted in units before they are counted in won. The unit picture for August 2026 is where I actually started my work on this issuer, and I put it in the Korean-language edition of this journal, so that the two pieces measure different things and do not repeat one another. What I will say here is that the unit data does not soften the margin data.
The other thing a margin will not tell me is what the company earns on the capital behind it, which is why the peer table below carries a ratio column where a margin column would normally go. Two companies can share an operating margin and be nothing alike underneath it, depending on how much equity each one needs to produce a won of sales. When I looked at a Korean auto lighting supplier last month, the interesting gap was between where it ranked on margin and where it ranked on price. Here the two ranks point the same way, which is a duller finding and probably a more reliable one.
Fifteen ways I could be wrong here
- Four years is a short series, and one of them is the year the company came out of receivership. The base period is not a normal one.
- The ceiling I describe is annual and half-year. Q4 2025 came in at 1.78 percent on my own extraction, and that quarter may be the leading edge of something, in which case my whole framing dates fast.
- Operating leverage cuts both ways. At this margin, a modest revenue increase would move the ratio a lot.
- The 2025 figure of 36,155 million won is more than twenty-five times 2024. I called that a statement about the base; a reader could reasonably call it momentum.
- I have not read the segment notes. This piece describes the parent-only and consolidated difference without explaining it.
- Parent-only accounting conventions differ between issuers. I am treating the 30.5 billion won figure as parent-only because two outlets said so; I did not read the statement header myself.
- My trailing operating profit of 37,272 million won stitches together four filed periods. That is my arithmetic. No filing states it.
- Return on equity computed from operating profit is unconventional. Most readers will want net income on top of that ratio, which would give a different picture.
- Two peer rows mix a June income period with a March equity date.
- The three Japanese manufacturers are not size peers and do not share this company’s home market or currency.
- Book value of 0.362 times could be a discount for something I have not identified, including things that are not in the financial statements at all.
- Zero non-controlling interests simplifies the equity question but says nothing about the quality of the assets underneath.
- Liabilities roughly doubling since 2022 accompanied a genuine operational recovery. Growth in liabilities is not by itself a warning.
- I have set aside the cash flow statement and the interest cover in this piece. Both read poorly, and leaving them out is a choice about what this piece is; it is not a finding that they do not matter.
- I hold no position and have no order in. Someone who owns this is looking at a different set of questions than I am.
What would end my read on KG Mobility stock
My position is no position. I do not own the shares and I have not placed an order. What I have is a description, and a description is only worth keeping if it can be shown to be wrong.
Two things would do it. First, if the nine-month consolidated operating margin in the third-quarter report comes in above one percent, the ceiling I have described in this piece is not a ceiling and the whole framing goes. Second, if that same margin comes in below 0.4 percent while equity holds near its current level, then the discount to book is telling me something sharper than I have credited and I would want to reread the balance sheet before saying anything else about value.
Both thresholds have the same problem, and I would rather name it than leave it for a reader to notice. I drew both lines after looking at the numbers. One percent is not an industry standard; it is a round figure that happens to sit just above four years of results. Nothing outside this piece obliges me to honour either level, and in November I will be both the party under examination and the examiner. Writing the two figures down in public is the only mechanism I have for making that harder to fudge.
Prices and multiples reflect the 7 September 2026 close as checked at the time of writing. Korean won is the reference currency throughout, and the single dollar figure above uses roughly 1,340.5 won per dollar on that date, which is approximate. Financial data is from consolidated filings with Korea’s Financial Supervisory Service, half-year report receipt number 20260814001969.