KISCO Holdings Cash and Dividends: 12% of Savings Gone
Where I stand on KISCO Holdings stock, in one table
| KRW billion, group level | Dec 2022 | Dec 2023 | Dec 2024 | Dec 2025 | Jun 2026 | Dec 2023 to Jun 2026 |
|---|---|---|---|---|---|---|
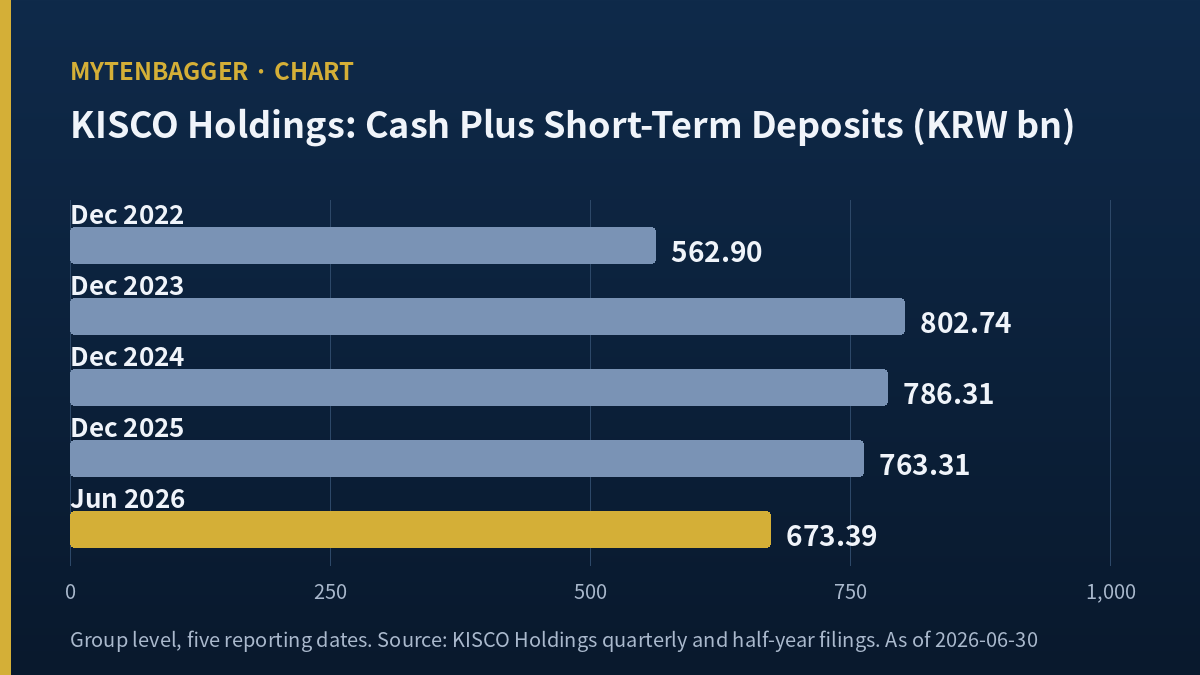
| Cash plus short-term deposits | 562.90 | 802.74 | 786.31 | 763.31 | 673.39 | -129.35 |
| Short-term borrowings | 12.47 | 12.72 | 10.86 | 10.82 | 10.82 | -1.90 |
My read: the pile peaked at the end of 2023 and has shrunk 16.1% since, with most of the fall packed into the six months to June 2026. I do not own the shares, and I am not buying before the July to September report is out.
KISCO Holdings stock closed at KRW 26,400 on September 23, 2026, about $19.44 at roughly KRW 1,358 per dollar, and the figure that held my attention was not the price. It was a single asset line. Cash plus short-term deposits at this Korean rebar group stood at KRW 763.3 billion at the end of December 2025 and at KRW 673.4 billion at the end of June 2026, a drop of KRW 89.9 billion, or 11.8 percent, in six months.
That money did not vanish into a failed project. By my arithmetic, most of it went to three places at once: operations that consumed cash, a routine capital budget, and a steady stream of payouts and buybacks to shareholders. The group built that deposit pile in 2022 and 2023, when its electric-furnace rebar business was making real money. In 2025 and 2026 it has been spending it.
I am writing this as someone who watches the stock and does not hold it. What I want to know is how long a company can keep paying a dividend yield of roughly seven percent out of savings while its operations lose money, and what would have to change for the savings to stop shrinking.
Contents
What KISCO Holdings stock actually represents
KISCO Holdings is a KOSPI-listed holding company. KOSPI is Korea’s main board, the rough equivalent of the NYSE for large and mid-size Korean firms. The group’s core business is rebar, the ribbed steel bar that goes into concrete, made in electric arc furnaces that melt down scrap steel. Its best-known subsidiary, Korea Steel, is separately listed on KOSPI as well.
That structure matters for the cash line. The figures in my table are group-level numbers. They include the cash sitting inside Korea Steel, and not all of Korea Steel belongs to KISCO Holdings shareholders. At the end of June 2026, total equity was KRW 1,450.89 billion, of which KRW 325.87 billion, about 22.5 percent, belonged to outside shareholders of the subsidiaries. I keep that in mind every time I look at the group cash figure. It is not all spendable by the parent.
That outside stake has been shrinking, and the way it shrinks tells me something about where the cash goes. Outside shareholders’ equity in the subsidiaries was KRW 477.39 billion at the end of 2023, KRW 382.07 billion at the end of 2024, KRW 351.22 billion at the end of 2025 and KRW 325.87 billion in June 2026, according to the group figures in DART. The biggest drop, about KRW 95.3 billion in 2024, lines up with the year Korea Steel decided to retire 6,000,000 of its own shares (Digital Today, December 13, 2024). When a subsidiary buys its own stock from the market, the outside owners who sell get cash, and the parent’s share of what remains goes up. In other words, part of the savings is being used to buy out the minority, one trust at a time.
For readers used to US holding companies, one local detail helps. Korean listed groups often carry a parent and one or more subsidiaries on the same exchange, each with its own float, its own dividend and its own buyback program. The parent’s shareholders own only the parent’s slice of each subsidiary. A group-level cash figure is therefore always larger than what the parent could hand to its own shareholders if it wanted to.
The price itself sits closer to the top than the bottom of its twelve-month track. At KRW 26,400 the market value is roughly KRW 374.3 billion, or about $275.6 million, measured on all 14,178,030 issued shares. That issued figure includes a large block of treasury stock, which I come back to below.
Where KISCO Holdings stock got its savings
The deposit pile is a product of two good years. At the end of 2022, cash plus short-term deposits were KRW 562.9 billion. A year later they were KRW 802.7 billion, an increase of KRW 239.8 billion in twelve months. That was when the group still earned operating profit of about KRW 149 billion to KRW 198 billion a year, according to DART, and much of the surplus appears to have gone into short-term bank deposits.
After that, the line drifted down slowly. It was KRW 786.3 billion at the end of 2024 and KRW 763.3 billion at the end of 2025. In two years the pile lost about KRW 39.4 billion, a pace I would call manageable. Then, in the six months to June 2026, it lost more than twice that amount.
I first read the 2025 figure as reassuring. The pile had barely moved during a year in which the group reported an operating loss. Looking again, I think the calm year hid what was coming: 2025 still had positive operating cash flow, and 2026 so far does not.
My first reason for watching: operations now use cash
According to the group cash flow figures in its DART reports (DART is Korea’s electronic disclosure system, the local equivalent of EDGAR), operating cash flow was KRW 49.45 billion for all of 2025. For the first six months of 2026 it was negative KRW 20.42 billion. The January to March quarter alone was negative KRW 26.59 billion; April to June recovered to positive KRW 6.18 billion.
Part of that swing is inventory. Inventory was KRW 89.84 billion at the end of 2025 and KRW 117.55 billion at the end of June 2026, up KRW 27.71 billion. Steel stock on hand ties up cash until it is sold, so a rising inventory line in a slow market is one of the first places I look. It explains a good chunk of the negative operating figure, though not all of it.
Receivables, the other usual suspect, barely moved: KRW 147.11 billion at the end of 2025 and KRW 148.66 billion in June 2026, per ValueLine. So customers were not paying more slowly. The group simply made or bought more steel than it sold over those six months, and paid for it in cash.
For a sense of how the larger Korean steel names handled the same spring, I went back to my notes on the quarter when Hyundai Steel’s electric furnace division carried the result. Its rebar business improved while its larger flat-steel side did not. KISCO Holdings has no sheet and plate business to hide behind, which is part of why its cash line moves so directly with rebar.
My second reason: the payouts did not slow down
The group kept paying shareholders at a pace set in better years. KISCO Holdings paid KRW 1,850 per share for fiscal 2025, made up of a KRW 1,000 mid-year dividend and a KRW 850 year-end dividend, according to Ferro Times. Against the September 23 close, that is a yield of about 7.0 percent. For the full year 2025, the group cash flow table compiled by ValueLine shows KRW 51.26 billion of dividends paid, which includes payouts by subsidiaries to their outside shareholders.
The per-share dividend has a long upward run behind it. DART records collected by LUXRIX show KRW 300 for fiscal 2020, KRW 400 for 2021, KRW 600 for 2022, KRW 900 for 2023, KRW 1,800 for 2024 and KRW 1,850 for 2025. The two big steps came in the years the business was earning well or just starting to slip. The last step, from 1,800 to 1,850, came in a year with an operating loss. I read that as a board that treats the dividend as a commitment it intends to keep through weak years as well as strong ones.
Free cash flow for 2025, operating cash flow minus capital spending of KRW 29.24 billion, was about KRW 20.2 billion. By my arithmetic, dividends paid were roughly 2.54 times free cash flow that year. The difference came out of the deposit pile, and in 2025 the pile was large enough that nobody had to notice.
My third reason: two buyback programs ran at once
On top of dividends, both listed companies in the group have been buying their own shares. KISCO Holdings ran a KRW 15 billion trust program with NH Investment & Securities from August 20, 2025 to February 20, 2026. Digital Today reported that it bought 582,737 shares for KRW 14,999,986,500, an average of about KRW 25,741 per share by my arithmetic. A second KRW 10.0 billion program ran from June 9 to September 9, 2026 and bought 375,560 shares for KRW 10,000,375,550, per the company filing of September 9.
Korea Steel ran its own KRW 10.0 billion program over the same June to September dates and bought 1,055,242 shares. After that, Korea Steel held 5,863,407 treasury shares, 16.1 percent of its issued stock, and KISCO Holdings held 2,503,339, or 17.6 percent of its 14,178,030 issued shares.
Here is the detail that surprised me. In December 2024, KISCO Holdings retired 2,000,000 treasury shares worth about KRW 44.1 billion, according to Digital Today. Twenty-one months later, the treasury pile is back above that size. The number of shares did shrink when those two million shares were retired, but the company has been rebuilding the same kind of block with cash from the same savings.
I covered a similar question at a larger Korean steelmaker, where I checked what a duty on imported plate was supposed to earn. That company had a profit recovery to test. KISCO Holdings, for now, has a balance sheet to test.
KISCO Holdings stock and six months of cash flow
I put the two periods side by side to see how the pattern changed. All figures are group level, in KRW billion, from DART reports as collected by the LUXRIX data service.
| KRW billion | Full year 2025 | Jan to Jun 2026 |
|---|---|---|
| Operating cash flow | 49.45 | -20.42 |
| Capital spending | 29.24 | 9.56 |
| Free cash flow | 20.22 | -29.98 |
| Inventory at period end | 89.84 | 117.55 |
| Owners’ equity at period end | 1,143.07 | 1,125.02 |
Sources: DART group reports via LUXRIX (operating cash flow, capital spending, inventory, owners’ equity). Free cash flow is operating cash flow minus capital spending. Figures rounded.
Three things stand out to me. Operating cash went from a surplus to a deficit. Capital spending slowed: KRW 9.56 billion for six months against KRW 29.24 billion for all of 2025, so even doubled it would run about a third lower, which tells me management is not pouring money into new capacity. And owners’ equity slipped by KRW 18.05 billion, which is small against the size of the balance sheet but moving in one direction.
If I line up only the known outflows, the story roughly closes. Negative free cash flow of about KRW 30 billion, plus the year-end dividend paid after the March shareholder meeting, plus the buyback trusts, gets close to the KRW 89.9 billion fall in cash and deposits. I could not split the exact amounts paid within those six months for each buyback trust, because the disclosures give totals at the end of each program. That is a gap I am leaving open.
One more piece of arithmetic, which I treat as a thought experiment and not a forecast. If the next six months looked exactly like the last six, cash plus deposits would fall from KRW 673.39 billion to about KRW 583.5 billion by the end of December 2026. That would still be above the KRW 562.9 billion of December 2022. Put differently, one more stretch like this one would take the pile most of the way back to where it stood before its best year. That is the frame I carry into the November report.
A US rebar peer, one ratio only
For an outside view I picked Commercial Metals Company (NYSE: CMC), a US-listed rebar producer that also runs electric arc furnaces and publishes its cash and debt every quarter. I did not compare size, profit or valuation. The two companies report on different fiscal calendars and live in very different markets, so the only thing I wanted from CMC was one ratio: total debt divided by cash, at the nearest quarter end.
According to Stock Analysis, CMC reported total debt of $3,400 million against cash of $559.76 million on May 31, 2026, about six dollars of debt for every dollar of cash. KISCO Holdings, a month later on June 30, had short-term borrowings of KRW 10.82 billion against cash plus deposits of KRW 673.39 billion, about 1.6 cents of borrowing per dollar of savings by my arithmetic. CMC closes its fiscal year at the end of August, which is why its quarter ends sit one month ahead of the Korean calendar quarters.
The same table shows CMC’s debt jumping from $1,354 million in August 2025 to $3,352 million three months later. I did not look into why, so I am not drawing anything from the jump itself. The point of the comparison is narrower. A rebar business in a weak market can be carried on debt or on savings. KISCO Holdings is doing the second, and the savings are finite in a way that a credit line is not.
How KISCO Holdings stock could play out from here
I see two paths, and I am not putting numbers on either of them this time. The deciding figure is the July to September operating cash flow, which will show up in the Q3 report due on November 16, 2026 (Mon).
On the first path, rebar spreads improve as scrap prices ease, operating cash turns positive again, and the deposit pile stops falling. One named sell-side analyst, Park Hyun-wook of Hyundai Motor Securities, raised his valuation on the stock from KRW 33,000 to KRW 37,500 on August 26, 2026 and kept a buy rating, according to Korean financial daily Asia Economy, on the view that easing raw material costs would improve spreads in the second six months. If that view is right, the dividend becomes affordable again from operations.
On the second path, the slow season in construction keeps rebar demand soft, inventory stays high, and operating cash stays negative. In that case the group has two choices: keep paying out of savings, or slow down the dividends and buybacks. The first path protects the yield and drains the pile. The second protects the pile and probably hits the share price, because a seven percent yield is a big part of why this stock gets looked at at all.
I also found no second named brokerage with 2026 or 2027 estimates published in the last three months. One analyst’s view is all the forward data I have.
KISCO Holdings stock: what would change my mind
- July to September operating cash flow turns positive and stays positive in October to December.
- Cash plus short-term deposits stop falling at the September 30 reading, holding at or above KRW 673.4 billion.
- Inventory comes back down toward the KRW 89.84 billion level of December 2025.
- The group announces how it will fund dividends if operating cash stays negative into 2027.
- A second named brokerage publishes estimates for 2026 and 2027.
- No new buyback trust starts until operating cash is positive again.
- Korea Steel does not lift its own treasury stake above the current 16.1 percent while operating cash is negative.
- Korea Steel, the largest subsidiary, reports an operating profit in any quarter before the end of 2026.
The first two are the ones I will check first. If the deposit pile keeps shrinking at the pace of the last six months, the dividend story and the savings story start to pull against each other, and that is the moment I would expect the market to notice too.
The order matters. Operating cash is the cause and the deposit line is the effect, so if the first item goes my way, the second usually follows within a quarter. The inventory item is the bridge between them. A fall back toward the December 2025 level would release cash by itself, even before any change in rebar prices, and that release is the quickest way I can see for the deposit line to stabilize.
KISCO Holdings stock and the opposing case
- The pile is still very large. Cash plus deposits of KRW 673.4 billion are well above the market value of about KRW 374.3 billion, even before adding the steel plants. A reader could argue the market is paying less than the cash, though part of that cash belongs to outside shareholders of the subsidiaries.
- Borrowings are tiny. At KRW 10.82 billion, the group has almost no debt to service, so a few weak years do not threaten solvency.
- Buybacks at around KRW 25,741 and KRW 26,628 per share were done close to today’s price. If the shares are cheap relative to the savings, buying them back is a reasonable use of that money.
- April to June operating cash flow was already positive at KRW 6.18 billion. The worst may have been January to March.
- Hyundai Motor Securities kept a buy rating and a KRW 37,500 valuation, which is well above the current price.
I take all five seriously. The balance sheet is strong, and I do not dispute that; it is just getting less strong every quarter the business loses money. My hesitation is about direction and timing.
Where my first read of the yield went wrong
A seven percent yield was what brought me to this name. When I first saw KRW 1,850 per share against a price in the mid-twenty-thousands, I treated it the way I treat most high yields on Korean holding companies: as a sign the market was underpricing a cash-rich parent. I did not check where the dividend was being paid from.
When I did check, the answer was less comfortable. In 2025 the payout ran at about 2.54 times free cash flow, and in the first six months of 2026 free cash flow was negative. The yield is real, but for now it is being paid from money earned in 2022 and 2023. That does not make it a bad dividend. It makes it a dividend with a clock on it, and I did not see the clock the first time.
What I am waiting to see
I am not buying this stock now. The reason is not that the company looks weak; by most balance-sheet tests it looks unusually safe. The reason is that the savings that make it safe are being spent, and I want to see whether the business can start refilling them before I pay for the yield.
The single number I will look for in November is operating cash flow for July to September. If it is positive, the savings stop being the only thing paying for the dividend. If it is negative again, the six months to June were not a one-off, and the deposit pile becomes a timer.
I wrote down the June figure of KRW 673.4 billion in my own notes next to the date. When the Q3 report arrives, that is the first figure I will compare against, before I read anything else in it.
Prices and market value reflect the September 23, 2026 close on the Korea Exchange. Dollar figures are approximate, at roughly KRW 1,358 per dollar on the same date. Balance-sheet lines are from ValueLine and DART reports via LUXRIX; buyback details from company filings reported by Digital Today and the September 9 filing; the 2024 share retirement from Digital Today; dividends from Ferro Times; sell-side view from Asia Economy; balance sheet from ValueLine; CMC figures from Stock Analysis.