SBS Stock Is Priced Off a Book Value It Gave Back in Six Months
I wrote down a ratio, then found out it was eight months old.
Contents
What SBS Stock Is Priced Against, and When That Price Was Set
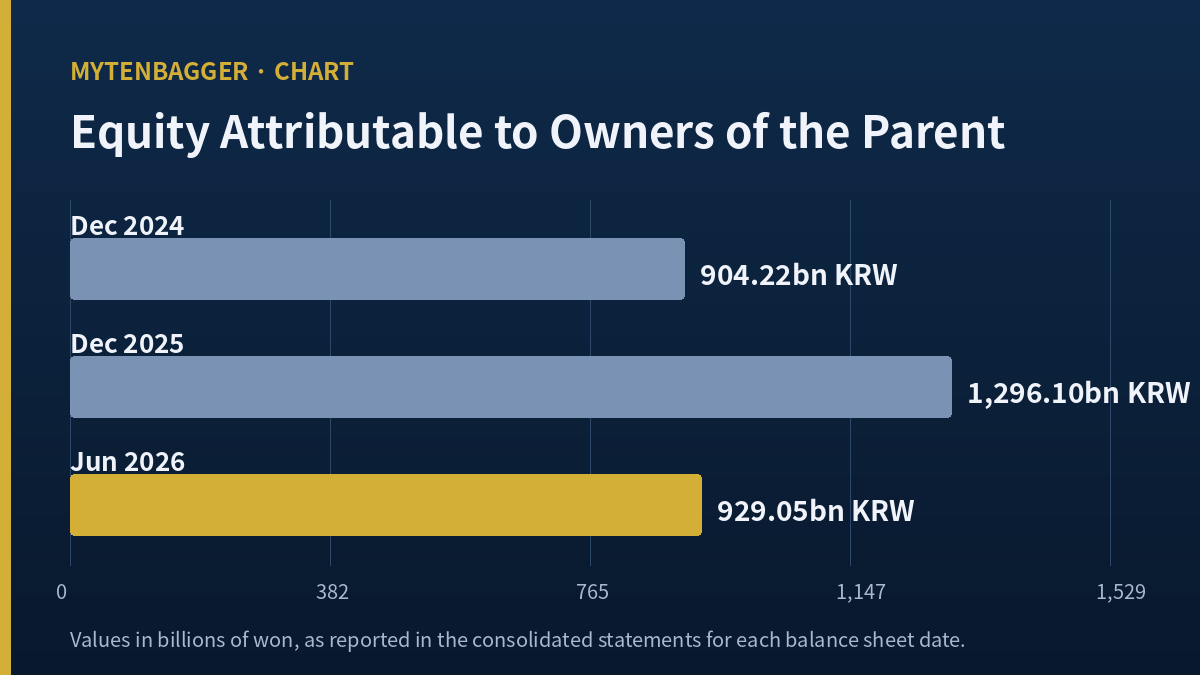
The screen I started from showed this Korean broadcaster trading at roughly a sixth of its net assets. The figure that produces that reading comes from the balance sheet dated December 31, 2025. Six months later, on June 30, 2026, equity attributable to owners of the parent was KRW 929.05bn ($678.8M) against KRW 1,296.10bn ($947.0M) at the December date. That is a fall of 28.32 percent by my calculation, and it moves the same ratio from 0.17 to 0.24 without the share price doing anything at all.
1. At the September 2, 2026 close of KRW 12,180 ($8.90), market value works out to KRW 225.95bn ($165.1M) on 18,551,238 shares. The multiplication comes to KRW 225,954,078,840, which I have rounded to the nearest ten million won everywhere below.
2. Equity attributable to owners of the parent ran KRW 904.22bn at December 2024, KRW 1,296.10bn at December 2025, and KRW 929.05bn at June 2026. Reported net income for the whole of 2025 was KRW 7.93bn ($5.8M). The 2025 rise is roughly forty-nine times that year’s earnings, so almost none of it came through the income statement.
3. Price to net assets therefore reads 0.17 on the December figure and 0.24 on the June figure. Five screens I checked gave five different values in that range. I did not pick one and discard the others. I dated every figure I used.
4. Operating margin for the 2025 financial year was 1.80 percent by my calculation (KRW 18.15bn on KRW 1,008.46bn). For the first half of 2026 it was minus 2.07 percent. Both are the thinnest values in the peer set I built below.
5. I hold none of this and have no order working. The whole point of the piece is that the cheapest multiple in my table sits on the same row as the thinnest margin.
Where the December Figure Still Circulates
One Korean data screen still prints price to net assets as 0.18 with the label “2025/12(A)” beside it, which is honest labeling and easy to miss. A brokerage model published on May 27, 2026 carries per-share net assets of KRW 69,866 for 2025 and forecasts KRW 49,600 for 2026, so the house that wrote it is already modeling the give-back. The stale figure is not wrong. It is just answering a question about December.
The Ratio I Copied Down First
For the first stretch of this work I had 0.18 written at the top of my notes and I was building an argument on it. I only went looking for the underlying equity line because the market value and the per-share net assets did not divide out to anything I recognized. That check took four minutes and changed the article. I am recording it because the version of this piece that never ran the check would have read as more confident and been worth less.
KOSPI, and What This Ticker Is
SBS trades on the KOSPI, the senior board of the Korea Exchange in Seoul, under 034120. KOSPI is the larger and older of Korea’s two main boards; KOSDAQ is the growth board. The company operates one of Korea’s three national terrestrial television networks alongside KBS and MBC, and owns production arms including Studio S.
Revenue Does Not Come Mainly From Airtime
A corporate profile screen dated June 2026 breaks revenue into programming sales and related income 68.48 percent, television advertising 29.02 percent, and radio advertising 2.50 percent. The three add to 100.00. So a broadcaster whose name is synonymous with a channel books most of its revenue from selling content instead of airtime.
One Ownership Fact That Matters for the Rest
The largest holder is TY Holdings with 6,738,017 shares, or 36.32 percent, on a Korean shareholding screen I read on September 2, 2026. Foreign ownership on the screen I read at 15:30 on September 2, 2026 was 0.00 percent, rounded to two decimals. That is not investor preference.
The Balance Sheet Moved Twice and I Cannot Source Either Move
Here is the whole thing in one table, in billions of won, consolidated.
| As of | Total assets | Total liabilities | Equity to parent owners | Net assets per share |
|---|---|---|---|---|
| Dec 31, 2022 | 1,407.88 | 534.61 | 820.91 | KRW 44,251 |
| Dec 31, 2023 | 1,346.39 | 465.27 | 878.85 | KRW 47,374 |
| Dec 31, 2024 | 1,512.36 | 605.93 | 904.22 | KRW 48,742 |
| Dec 31, 2025 | 2,044.00 | 745.80 | 1,296.10 | KRW 69,866 |
| Jun 30, 2026 | 1,579.59 | 648.37 | 929.05 | KRW 50,080 |
One thing the table shows that I did not chase: implied non-controlling interests run KRW 52.36bn in 2022 and then KRW 2.27bn, KRW 2.21bn, KRW 2.10bn and KRW 2.17bn in every year after, so something appears to have left the consolidation in 2023. Two Korean financial data screens carry the same figures and agree to the decimal. Per-share values are mine, taking each equity line over 18,551,238 shares; the December 2024 result of KRW 48,742 matches the KRW 48,742 printed in a brokerage model, which is how I satisfied myself the arithmetic was right. I could not open the regulator’s original filing screen; these figures come from services that transcribe those filings.
Total Assets Rose KRW 531.64bn, Then Gave Back KRW 464.41bn
Those heading figures are total assets. Inside them, non-current assets went from KRW 752.19bn at December 2024 to KRW 1,215.51bn at December 2025, then to KRW 733.31bn at June 2026. Property, plant and equipment moved the other way across the same three dates: KRW 478.42bn, KRW 461.58bn, KRW 450.40bn. So whatever arrived and left was not fixed assets. Strip property out and the remaining non-current pile reads KRW 273.77bn, KRW 753.93bn, KRW 282.91bn.
The equity fall itself is not a mystery once the liability side goes in, and I should have put it in the first time. Between December 2025 and June 2026 total assets fell KRW 464.41bn and total liabilities fell KRW 97.43bn. The difference is KRW 366.98bn, which is the KRW 367.05bn equity fall to within the small non-controlling line. So the arithmetic closes. What I cannot source is why roughly KRW 464bn of assets and KRW 97bn of liabilities left the balance sheet in six months.
What I Checked and What I Could Not Find
I looked for a revaluation, a large acquisition, a deconsolidation, and a one-time gain. Nothing in the coverage I could reach explains it, and the one sell-side model I read forecasts total equity of KRW 922bn for the end of 2026 without saying in words why. That model also carries a 2026 forecast of minus KRW 333bn operating cash flow against plus KRW 301bn investing cash flow. That is a cash classification observation and nothing more; movements between those two headings do not change equity by one won, so it is a hint about where to look and not an explanation.
Why I Kept It in the Article Anyway
An unexplained swing of KRW 367.05bn ($268.2M) in the equity of a company capitalized at KRW 225.95bn ($165.1M) is larger than the company itself. Leaving it out because I could not source the cause would have been the more dishonest choice. So it stays in, labeled as something I did not resolve, and every price-to-net-assets figure below carries its date.
What SBS Stock Earns on Every Thousand Won of Revenue
| Financial year | Revenue (KRW bn) | Operating profit (KRW bn) | Net income (KRW bn) | Operating margin |
|---|---|---|---|---|
| 2022 | 1,173.78 | 185.60 | 156.56 | 15.81% |
| 2023 | 996.76 | 58.32 | 47.22 | 5.85% |
| 2024 | 1,046.65 | -19.19 | 33.78 | -1.83% |
| 2025 | 1,008.46 | 18.15 | 7.93 | 1.80% |
Consolidated, from a Korean market data service, cross-checked line by line against a brokerage table that reports the same four years in billions. Margins are mine.
Revenue Fell 14.08 Percent and Profit Fell 90.22 Percent
From 2022 to 2025 revenue went from KRW 1,173.78bn to KRW 1,008.46bn, a fall of 14.08 percent by my calculation, or minus 4.93 percent compounded across the three years. Operating profit over the identical stretch went from KRW 185.60bn to KRW 18.15bn, a fall of 90.22 percent. A cost base that lets a 14 percent revenue decline turn into a 90 percent profit decline is a cost base with very little that moves with the top line.
Sales Are 4.46 Times Market Value
Market value of KRW 225.95bn over 2025 revenue of KRW 1,008.46bn gives 0.2241, so revenue runs at 4.46 times what the market pays for the whole company. I have not often written that sentence about a company whose brand is on a national network. The table above explains it without needing me to.
The Half-Year Behind SBS Stock
| Quarter | Revenue (KRW bn) | Operating profit (KRW bn) | Net income (KRW bn) |
|---|---|---|---|
| Q1 2026 | 190.38 | -17.63 | -13.91 |
| Q2 2026 | 285.35 | 7.79 | 6.61 |
| First half 2026 (my sum) | 475.73 | -9.84 | -7.30 |
The Second Quarter Was Positive and the Half Was Not
Against the same quarter of 2025, one screen reports second-quarter revenue up 6.38 percent, operating profit up 11.48 percent and net income up 15.24 percent. The direction is right. The size is the problem: the first quarter lost KRW 17.63bn and the half still ends KRW 9.84bn ($7.2M) under water. A house writing on July 25, 2026 expected the second quarter to be a loss and it was not, so the beat is real. It is a beat inside a losing half.
Cash Flow, Once I Found the Right Figure
Operating cash flow for 2025 was KRW 64.85bn ($47.4M) on two screens that agree, against capital expenditure of KRW 15.64bn. Depreciation ran KRW 37.92bn. I mention the number mainly because the indicator database I use reports it roughly ten times larger, which is a unit error and not a disagreement, so I threw that field out.
SBS Stock Against Three Terrestrial Broadcasters I Priced
| Company | Reporting period read | Price / sales | Price / net assets | Operating margin |
|---|---|---|---|---|
| SBS (KRX: 034120) | FY2025 revenue, June 2026 equity, Sep 2, 2026 price | 0.22 | 0.24 | 1.80% |
| ITV plc (LON: ITV) | Trailing twelve months to Jun 30, 2026 | 0.75 | 1.51 | 13.60% |
| TF1 SA (EPA: TFI) | Trailing twelve months to Mar 31, 2026 | 0.63 | 0.67 | 9.22% |
| Nippon Television HD (TYO: 9404) | Trailing twelve months to Mar 31, 2026 | 1.48 | 0.69 | 14.31% |
Peer rows read from a single US statistics service on September 3, 2026, one day after the Korean close used in the SBS row. Peer margins are mine, taking each operating profit over each revenue on that screen: ITV GBP 480m on GBP 3,529m, TF1 EUR 207.3m on EUR 2,249m, Nippon TV JPY 69,333m on JPY 484,418m. The SBS row is built by me from Korean sources instead of lifted from that service, for the reason in the next section.
The Cheapest Row Is Also the Thinnest Row
Two of these three European and Japanese broadcasters sit in the same structurally declining business and still carry price to net assets of 0.67 and 0.69, with double-digit operating margins behind them. The Korean name is priced at roughly a third of those book multiples and earns 1.80 percent where they earn between 9.22 and 14.31 percent. Read that way, the discount here looks less like a country label and more like the market pricing an equity base that has stopped producing much.
TF1 Is the Row That Argues With Me Hardest
TF1 carries price to net assets of 0.67, a dividend yield the same screen puts at 9.30 percent, and an operating margin of 9.22 percent. If the case for the Korean name is “cheap against assets, in a shrinking industry,” TF1 is that case with roughly five times the margin and a yield to wait on. Whatever I think I have found here, someone with a Paris account has a cleaner version of it.
The Company I Left Out of the Table
Fuji Media Holdings (TYO: 4676) belongs in this group by business and I did not use it. Its statistics page shows trailing revenue of JPY 584.57bn and trailing operating profit of JPY 20.04bn, while its financials page shows the year ended March 31, 2026 with revenue of JPY 551.87bn and an operating loss of JPY 8.77bn. Those two pairs disagree, one on size and one on sign, and I could not tell from the screen which period the first one covers. A row I cannot date is a row I cannot compare, so it is absent, and this paragraph is the only place it appears.
The Rule I Used to Pick Those Three, and Where It Stretches
My basis this time: free-to-air terrestrial broadcasters that own in-house production arms, compared on two multiples and one margin, with no currency converted. The comparison is made of ratios, so converting would add an exchange rate without adding information. Every previous peer basis I have used in this journal is set aside.
Four Places This Comparison Is Loose
First, the reporting periods do not line up: only ITV’s trailing year ends on June 30, 2026, and the two others end on March 31, 2026. Second, my own row is not built the way the peer rows are; the service computed theirs and I computed mine, from a different set of sources, so a small methodological gap sits inside the table. Third, the service does not state which equity figure sits under each peer’s price-to-net-assets value, which is the exact question I spent three sections failing to close for the Korean name. I am comparing a number I interrogated with three I did not. Fourth, and this is the one that touches the headline claim directly: my margin is a full financial year ended December 31, 2025, while the peer margins are trailing years ended in March and June 2026. That is a six-to-nine month offset on the single metric the title rests on.
What a Six-Year Netflix Deal Does and Does Not Tell Me
The company and Netflix announced a partnership on December 20, 2024, in a partner announcement, with supply beginning in January 2025 and a term of six years. A Korean brokerage note dated May 27, 2026 writes that term as 2025 through 2030. Coverage is new drama, entertainment and factual programming plus a back catalogue.
No Figure in It Is Usable
Financial terms were not published. The Netflix release carries none, and the brokerage note treats the monetization as undisclosed. Estimates circulate in the Korean press, and they are press estimates. What I can use is the line item the same note discloses for the first quarter of 2026: advertising revenue KRW 50.1bn, down 10 percent on the year; business revenue KRW 90.7bn, down 1 percent; and online distribution revenue KRW 35.2bn, up 17 percent. Those three sum to KRW 176.0bn against quarterly revenue of KRW 190.38bn, so they are a partial breakdown and not the whole quarter. They also follow a different taxonomy from the annual profile breakdown quoted earlier. Of the three that are disclosed, one is growing, and it is the one a content supply deal would push.
The Four Houses Pricing SBS Stock Above the Market
Four Korean brokerages have published a figure on this name within the window I could reach. On May 27, 2026 a DS Investment Securities analyst put KRW 20,000 on it, cut from KRW 34,000. On July 8, 2026 a Hana Securities analyst moved to KRW 18,000, a ten percent reduction, as reported by the Korean financial daily Edaily. A Shinhan Securities figure of KRW 17,000 was reported on July 25, 2026. DB Financial Investment carried KRW 25,000 in a note dated December 18, 2025.
The Spread, and Whose Four These Are
Those four sit between KRW 17,000 and KRW 25,000. Even the lowest is 39.57 percent above the September 2, 2026 close by my calculation. A Korean consensus screen dated August 28, 2026 aggregates four contributing houses at KRW 17,500 with a rating of 4.00 out of 5. The four I named average KRW 20,000, so that screen is counting a different four, or the same four on different dates. I am not adopting any of these figures. I am recording that four professionals published on this company between December 2025 and July 2026 and all four landed a long way above the September 2 close. The DB Financial Investment note is nine months old and I could not confirm whether it has been updated.
Where I Think the Disagreement Sits
They are pricing in a recovery in the fourth quarter of 2026 and into 2027; the same consensus screen carries a 2026 earnings estimate of KRW 266 per share, which the screen prices at 46.10 times that estimate against its own August 28 close of KRW 12,260; against the September 2 close of KRW 12,180 the same estimate gives 45.79 times. I read one full-year figure of 1.80 percent operating margin, one half-year figure of minus 2.07 percent, and an equity line I could not source. I closed the file with what I could verify. They closed theirs with a forecast. Both are legitimate; only one of them is a journal entry.
Why SBS Stock Is Hard to Own From a US Account
This is the part that is different from every Korean name I have written up. I did not find a depositary receipt for this company. That is the usual obstacle and here it is the smaller one.
The Statute Comes First
Article 14, paragraph 1 of Korea’s Broadcasting Act prohibits investment in a terrestrial broadcaster by foreign nationals, foreign governments, foreign organizations and foreign corporations. Article 8 sets the domestic limits: 40 percent for any holder including related parties, and 10 percent for a business group above the asset threshold set by presidential decree. The threshold itself is set by the enforcement decree, which I did not open; Korean outlets including Kyunghyang Shinmun put it at KRW 10 trillion of group assets. The statute link above is Korean-language.
And It Is Enforced at the Broker
Korean business daily Money Today reported on November 30, 2023 that from December 14, 2023, 61 domestic brokerages blocked foreign buy orders in this ticker and in the shares of two regional broadcasters. Selling stayed open. Forty-nine existing foreign holders were handled administratively. So the 0.00 percent on my screen is the output of a rule, and a broad Korea fund is unlikely to carry the name for the same reason. I did not find a legal route in for a US-resident individual, and I would treat this as a company to read about instead of one to try to buy.
SBS Stock Numbers I Left Out
Screens disagreed about this company more than usual, so the exclusions are worth as much as the inclusions.
Fields I Threw Out of the Indicator Database
Operating cash flow came through at roughly ten times the verified figure, as described earlier. Total equity was given as KRW 889.5bn, which matches neither the December 2025 nor the June 2026 consolidated line; that field has disagreed with the transcribed consolidated line for eight sessions running. Interest coverage came through as minus 1.28 with its own basis field marked unknown. Forward earnings, forward multiple and peer multiple were all empty again, the seventy-fifth consecutive session. Daily volume printed as 1,693 shares, which is too small to be plausible for a KRW 225.95bn KOSPI listing, so it is not in the article.
One Field That Did Not Reconcile and One That Did
The payout ratio field read 76.2, which reproduces only if I take the KRW 330 dividend for 2025 over earnings per share of KRW 432.84. I could not reproduce that per-share figure. The table above puts 2025 net income at KRW 7.93bn, which over 18,551,238 shares is KRW 427.46, and KRW 432.84 would need net income of KRW 8.03bn. Taking the dividend against the income statement I do have gives KRW 6.12bn paid on KRW 7.93bn earned, a payout of 77.25 percent on the unrounded figures, before any adjustment for the tiny treasury holding. So the field stays out, as it has for more than forty consecutive names. The 250-day high and low fields also carried a basis label that matched their values when I recomputed from the close, which is the second time in a row that has happened after sixteen straight failures.
What Would Break My Read on SBS Stock
These test whether the article was right. They do not test a stance. The size floor, the statute and the unsourced equity move each keep me out on their own, so no quarterly result changes what I do. What a result can change is how much of this piece survives. Two conditions, and one procedural rule I am adding this time: when the figure a test depends on differs across screens, name the screen before the test.
Condition One, and the Screen It Will Be Judged On
My read is that the June figure took the equity line back to roughly where it sat before the 2025 rise, which was KRW 904.22bn at December 2024. If the third-quarter 2026 report, due on or after Monday, November 16, 2026, shows equity attributable to owners of the parent below KRW 904.22bn, that reading is wrong and the contraction is still running. I set the trigger at the December 2024 level and not at the June 2026 level on purpose: the KRW 330 dividend alone removes about KRW 6.12bn, so a test pitched at 929.05bn would fire whether or not anything meaningful happened. I will judge this on the same Korean data service whose balance sheet table is reproduced above, taking the equity line over 18,551,238 shares, and not on any price-to-net-assets figure printed by a screen.
Condition Two, and Why It Is Simpler
The sentence this article is built on is that the cheapest row and the thinnest row are the same row. Turning positive does not break that; at 1.80 percent the 2025 margin was already positive and already thinnest by a factor of five. What breaks it is the nine-month 2026 operating margin coming in above 9.22 percent, which is where TF1 sits and which would take this company out of last place in the table. The half-year figure of minus 2.07 percent shows how far that is. This one is judged on quarterly revenue and operating profit as reported, which the screens do agree about.
The Case Where Both Turn True and I Still Do Nothing
Even with both conditions resolving in the company’s favor, I do not act. None of those three is an earnings problem and no quarter fixes them. These conditions expire with the 2026 annual report in March 2027.
Where I Stand on SBS Stock
No position, no order, watching. Market value of KRW 225.95bn ($165.1M) is below the size at which I take a trading stance at all, so this is an observation file.
The Line I Am Taking Away
When the cheapest multiple and the thinnest margin are the same row of the same table, the multiple is not telling me the asset is mispriced. It is telling me what the asset earns. I need a reason the earning changes before the multiple means anything, and this time I did not find one.
Two nearby files in this journal push against that from different sides. One is a Korean entertainment company whose shares halved while its operating margin beat the global majors, which is the opposite arrangement: strong margin, collapsing price. The other is a drama studio that aired 88 percent more episodes and earned 32 percent less per episode, which is what the production side of this industry looks like from inside.
Twelve Things That Cut Against This
- The center of this piece is a balance sheet move I could not source. An article can name an unexplained figure; it cannot lean on one.
- My row in the peer table is computed by me and the peer rows are computed by a service. That is not a like-for-like table.
- Only one of three peers reports a trailing year ending June 30, 2026.
- TF1 offers a similar book multiple with roughly five times the margin and a much larger yield.
- Second-quarter 2026 operating profit was positive, and at least one house expected a loss. The direction is against my read.
- Online distribution revenue grew 17 percent year on year in the first quarter of 2026 while the other two lines fell.
- Four Korean brokerages carry figures between KRW 17,000 and KRW 25,000, all well above the current price.
- Korea’s broadcasting regulator approved advertising rule changes on August 12, 2026 that raise the daily inventory limit from 17 to 20 percent, which is a positive I have not modeled.
- Terrestrial advertising revenue across the industry fell 17.0 percent to KRW 693.6bn in the 2025 financial year, as reported by the Korean trade daily Digital Daily on June 19, 2026 from the regulator’s industry accounts, so the base I am judging against is itself moving.
- The Netflix arrangement runs to 2030 and its financial terms are undisclosed, so I am blind to a material part of the earnings bridge.
- I did not examine ratings, scheduling or program-level data at all. This is a broadcaster read entirely through statutes and financial statements.
- The share count itself came in two versions, 18,551,238 and 18,555,008, differing by 3,770 shares. I used the first because two of the four reported ownership percentages round correctly only against it.
Prices and multiples reflect the September 2, 2026 close as checked at the time of writing. Dollar amounts are approximate, converted at roughly KRW 1,368.7 per dollar, the Seoul market close on that same date as reported by Korean financial press. Korean won is the reference currency throughout, and financial statement figures come from services that transcribe regulatory filings, since I could not open the filing screens themselves.