SFA Engineering Order Backlog Is Now Two-Thirds Robotics
SFA Engineering stock closed at KRW 23,700 on Friday, August 21, 2026. I have been reading two documents from this company side by side for a week now, and they describe different businesses. The income statement is the record of a Korean display and battery equipment supplier whose revenue fell 20.26% last year. The order book, disclosed six months later, is two-thirds a warehouse robotics company.
Order book at June 30, 2026
Total backlog KRW 987.5bn
Robotics and AI logistics KRW 668.7bn (67.72%)
First-half new orders KRW 507.9bn, up 56.18% from KRW 325.2bn
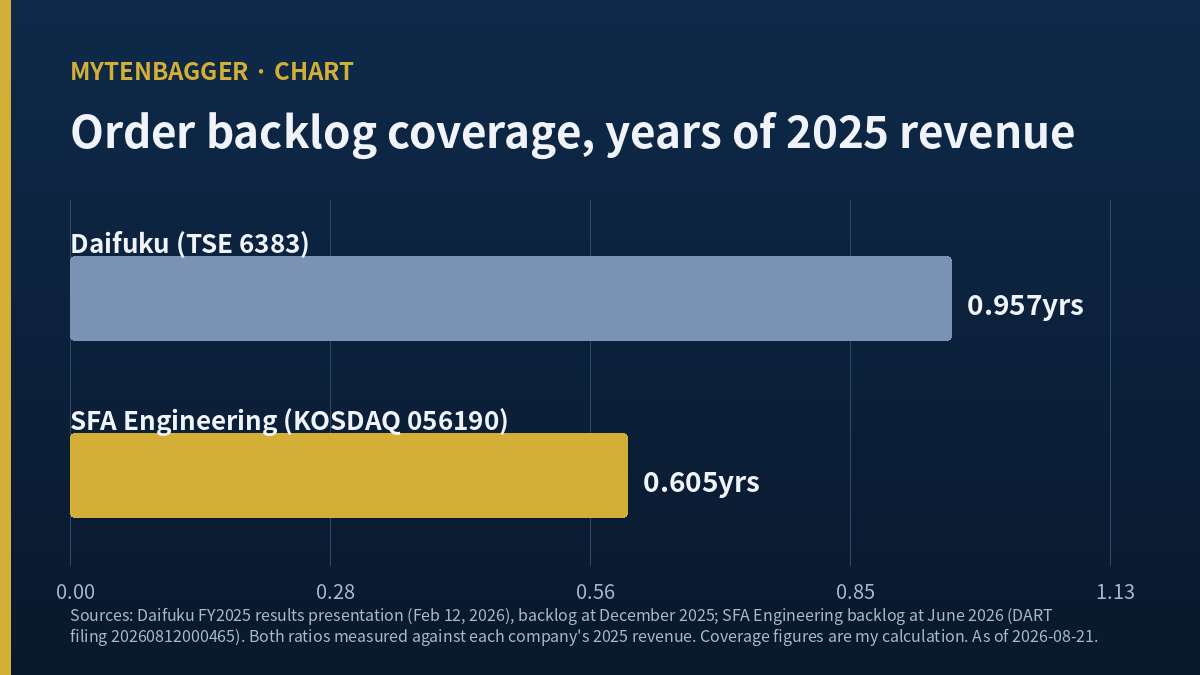
Backlog coverage 0.605 years of 2025 revenue (my calculation)
Contents
What SFA Engineering stock is quoted against
A note for readers outside Korea. SFA Engineering trades on KOSDAQ, the junior board of the Korea Exchange, which sits beside the main KOSPI board and skews toward technology, components and equipment names. Ticker 056190. Market value is KRW 851.0bn at the August 21 close, which works out to roughly USD 614m at the exchange rate cited in the footnote. Per share, KRW 23,700 is about USD 17.09.
The company was spun out of Samsung Aerospace in 1998 and listed on KOSDAQ in 2001, according to Korean trade press (The Elec, December 29, 2025). It builds three families of capital equipment: display production tooling, secondary-battery assembly lines, and automated material handling for factories and distribution centers. That third line is the one this piece is about.
Why coverage is the measure I chose
For a company that books revenue on multi-quarter equipment contracts, the reported quarter tells you what was installed a year ago. The order book tells you what the customer signed last month. When those two documents disagree about which business the company is in, I would sooner read the newer one, and I would sooner compare it to peers on how many years of work is sitting in the queue.
Coverage has limits I should name before I lean on it. It says nothing about the profitability of the work in the queue, nothing about the risk of signed work being pulled, plus nothing about how evenly the revenue lands across quarters. A company can carry two years of low-margin work and look secure while earning very little. What it does capture is the one thing a margin table cannot: whether customers are still signing. For an equipment supplier whose three end markets are moving in three directions at once, that seemed to me the more honest question to ask first.
SFA Engineering stock and an order book that changed subject
67.72% of the queue is robotics and AI logistics
At the end of June 2026 the backlog stood at KRW 987.5bn, of which KRW 668.7bn was robotics and AI logistics work (Electronic Times, August 17, 2026). That is 67.72% by my arithmetic. Three months earlier the same measure of total backlog was KRW 965.4bn, so the book grew by KRW 22.1bn over the quarter while the company was also converting orders into revenue. Two-thirds of a book in robotics is also the point where the Korean market tends to stop pricing on earnings at all, which is where I got stuck reading Rainbow Robotics, a name with no multiple to read. This company still files an income statement, so that is not the problem here.
The composition of what came in during the first quarter points the same way. New orders of KRW 217.9bn broke down as robotics material handling KRW 95.6bn, fuel cell KRW 39.1bn and semiconductor KRW 23.3bn (Daily Invest, May 22, 2026, reporting Korean sell-side work). Those are 43.87%, 17.94% and 10.69% of the quarter’s intake by my calculation. Display equipment does not appear as a named line in that intake at all.
One line in that intake I have no way to size. Fuel cell work was 17.94% of first-quarter orders, the second largest category, and it is not a business this company is known for outside Korea. I found no segment revenue for it, no backlog figure, and no margin disclosure. A fifth of a quarter’s orders arriving from a market I cannot measure is not a small hole in a piece built on order composition, so I am marking it here where it lands, ahead of the list at the end.
Where the mix used to sit
Five years ago the picture was inverted. Korean trade press reporting on the first quarter of 2021 put display at 34.9% of orders, battery at 28.6% and semiconductor at 24.5% (The Elec, May 14, 2021). I am quoting that only as history. It is a five-year-old figure and I would not use it to judge anything today.
The middle of the journey is where I ran into trouble. The company’s own 2023 annual results deck put secondary-battery equipment at 53.4% of separate-entity revenue. I could not reconcile the segment lines in that deck to the stated separate-entity total, so I am reporting the share the company printed and building nothing on top of it. What I will say is that battery equipment was the largest single line in 2023 by the company’s own account, and it is not the largest line in the 2026 order intake.
SFA Engineering stock against companies that publish a backlog
Backlog coverage, in each company’s own currency
If the order book now says warehouse robotics, the comparison set should be companies that build warehouse robotics and disclose an order position. Two of them do so clearly. I have kept every figure in its own reporting currency and marked the fiscal year end, because these companies do not share one.
| Company | FY end | Revenue | Order position | Coverage |
|---|---|---|---|---|
| Daifuku (TSE 6383) | December 2025 | JPY 660.7bn | Backlog JPY 632.2bn | 0.957 yrs |
| SFA Engineering (KOSDAQ 056190) | December 2025 | KRW 1,631.0bn | Backlog KRW 987.5bn (June 2026) | 0.605 yrs |
| KION Group, Dematic segment (XETRA KGX) | December 2025 | EUR 3,071m | Orders EUR 3,599m, up 39.5% | not disclosed |
Daifuku carries 0.957 years of work at its 2025 revenue run rate, against 0.605 years at SFA Engineering (Daifuku FY2025 results presentation, February 12, 2026). Both coverage figures are mine. The Korean company’s book is thinner in time, which for a mid-cap supplier competing for the same distribution-center projects is a real difference in visibility.
KION’s automation arm does not publish a backlog year in the same form, so I left the coverage cell empty. What it does publish is an order intake of EUR 3,599m for 2025, up 39.5% on the year, against segment revenue of EUR 3,071m (KION Group FY2025 results release, February 26, 2026). Orders running ahead of revenue by that much in the same year the Korean company’s orders rose 56.18% is the part of this comparison I find most useful. The demand signal is not local.
What the Japanese peer is guiding to
Daifuku took in JPY 672.6bn of orders during 2025 against JPY 660.7bn of revenue, so its book grew slightly over the year, and it has guided 2026 to JPY 700.0bn of revenue with JPY 105.0bn of operating profit, a 15.0% margin (Daifuku Q1 FY2026 presentation, May 14, 2026). I am reporting that guidance as the company’s own forecast, which is a different thing from a market estimate. The reason it belongs here is that the largest listed pure play in this category is planning for growth in the same year the Korean supplier is trying to book 1.56 times its first-half intake. The category is not the constraint. The question is share of it.
Two peers I could not put in the table
Murata Machinery is the obvious third name in Japanese factory logistics, and it is privately held. It files voluntary results notices, which is how I know its fiscal 2025 revenue was JPY 526.1bn, but it does not report on a schedule I can line up here. Canon Tokki, the dominant supplier of OLED deposition tooling, is a wholly owned Canon subsidiary with no separate financial disclosure at all. Neither absence is neutral. A comparison set assembled from whoever happens to publish is a comparison set chosen by disclosure rules, and I chose nothing.
The number SFA Engineering stock is being asked to grow into
39.07% of the year, with the year more than half gone
The company set KRW 1.3 trillion as its 2026 new-order goal. First-half intake of KRW 507.9bn is 39.07% of that, by my arithmetic. Reaching it needs KRW 792.1bn in the second half, which is 1.56 times what the first half delivered.
Samsung Securities modelled roughly KRW 1.1 trillion of annual orders in its May work, about KRW 200bn below the company’s own goal (Samsung Securities, May 18, 2026). I have no basis for closing that gap in either direction. What I can say is that the company goal and the only detailed sell-side model I read do not agree, and that the second-half requirement is the steeper of the two.
Orders arrive without filings
Here is the part that bothers me most. Searching the last ninety days of regulatory disclosures, I found no single-contract supply filings at all. Korean rules require a filing when one contract crosses a size threshold relative to revenue, and this company’s orders apparently arrive in pieces below it. The practical consequence is that every order figure in this piece reaches me through quarterly briefings and trade press, one step removed from a filing. I am reporting numbers I cannot check at source.
What the three end markets are doing under SFA Engineering stock
Display: a spending wave that is already ordered
Counterpoint Research expects global display capital spending to rise 57% in 2026, with OLED spending up 74% and accounting for 73% of the total (Counterpoint Research, August 10, 2026). That sounds like a tailwind until you check timing. Samsung Display’s 8.6-generation IT OLED line was already through equipment ordering and into installation by late 2025, with production due during 2026 (Economic Review, December 23, 2025). Equipment suppliers are paid when the tools are ordered, so a cycle in production is a cycle whose orders have been booked.
The same Counterpoint work notes that the industry has committed to 75,000 substrates a month of 8.7-generation capacity and calls filling it an open question. And Chinese panel makers are slowing: BOE told the market its depreciation had peaked and that capital spending would fall sharply from 2026 (The Elec, February 27, 2026). Separately, Chinese policy now requires half of new fab equipment to be domestically sourced, which Korean coverage describes as turning China from an opportunity into a wall (Global Economic, April 10, 2026).
Battery: new lines stopped, conversions started
LG Energy Solution guided to capital spending more than 40% below the prior year for 2026, with annual reductions of 20% to 30% signalled for the following three years (Finance Scope, February 2, 2026). That is the demand environment SFA Engineering’s battery assembly line sells into.
There is a counter-current. Samsung SDI’s US joint venture is converting three of four lines to energy storage chemistry, and Korean equipment makers have begun receiving conversion orders against it (Electronic Times, June 24, 2026). Conversion work is smaller per line than greenfield, which is exactly why I would not call this a recovery in battery equipment. I would call it a floor under it.
Logistics: the growth number nobody agrees on
Two research houses size the logistics automation market very differently. Mordor Intelligence puts it at USD 90.72bn in 2026 growing at 7.91% a year to 2031. Fortune Business Insights puts 2025 at USD 88.09bn and models 12.80% a year to 2034. The compound rates differ by a factor of 1.62. I am printing both because printing one would be a choice I cannot defend, and I have used neither in reaching my view.
What the last reported quarter actually shows
Second-quarter revenue was KRW 400.0bn with operating profit of KRW 29.0bn, giving a 7.25% operating margin, the second highest of the last six quarters (ZDNet Korea, August 13, 2026). The half-year figures were KRW 761.2bn and KRW 44.4bn (Digital Daily, August 13, 2026), and first-half order intake crossed KRW 500bn for the first time (Munhwa Ilbo, August 13, 2026).
The quarter before it went the other way. First-quarter consolidated operating profit of KRW 15.4bn came in roughly 40% below the KRW 25.8bn the sell-side had modelled, and Korean trade press attributed the shortfall to weakness at the affiliated battery equipment business (The Elec, May 18, 2026). Two quarters, two directions, one of them a large miss. That is the volatility a project-based equipment maker carries, and it is why I put more weight on the order book than on any single quarter in either direction.
One quarter of margin improvement after a year of decline is one quarter. I note it and I do not extrapolate it. The consolidated result also carries a listed subsidiary, SFA Semiconductor, which has run an operating loss in each of the last three fiscal years and in both quarters of 2026 (Alpha Square, accessed August 21, 2026). Whatever the parent’s equipment business earns, that loss is inside the reported number.
My position on SFA Engineering stock, and the seven places this is weak
At KRW 851.0bn of market value this is a small-cap outside the top hundred Korean listings, and my standing default there is to watch. Nothing here moved me off that.
What I am watching is narrow. If the order book keeps saying robotics while the reported quarters keep saying display and battery, the interesting moment comes when the two documents finally agree, because that is when the mix shows up in margin. I want to see that arrive before I do anything, and it has not arrived.
Here is where the piece is soft:
- The one that hurts most. I built a comparison on backlog coverage, and the two coverage figures come from different dates. Daifuku’s is a December 2025 backlog against December 2025 revenue. SFA Engineering’s is a June 2026 backlog against December 2025 revenue. The Korean company’s ratio is flattered by six extra months of order accumulation, and it still came out lower. The direction survives the mismatch, but the size of the gap does not.
- Every order figure here reaches me through briefings and trade press. No filing confirms any of them.
- The backlog composition line, 67.72%, comes from a single trade-press report. I found no second source for it.
- I could not reconcile the 2023 segment lines to the total in the company’s own deck, so the historical mix in this piece rests on a share I quoted and did not verify.
- Sell-side coverage is two houses, both publishing in May, both predating the August results. There is no current model here.
- The logistics market sizing I printed spans a 1.62-times difference in growth rate between two research houses, which means neither is doing work for me.
- I did not read the corporate value-up disclosure the company filed on April 1, 2026. Its host blocked me. Anything it says about capital allocation is missing from this piece.
What would end this piece
My whole reading depends on one disclosure line existing. If the next backlog release folds robotics and AI logistics back into a general equipment total, or stops breaking out composition at all, I lose the only measurement this piece stands on. I would not be wrong at that point. I would be unable to check, which for a record like this one is the same thing.
Hanmi Semiconductor, where the question was how long a 71% tool share holds
Basis of figures
Prices and market value reflect the Friday, August 21, 2026 close of KRW 23,700, checked when I wrote this on Sunday, August 23, 2026. Korea’s market was shut over the weekend, so this is the last trading session. Publication may follow by some days, so live quotes will differ.
The two dollar figures are approximate, converted at KRW 1,386.5 per dollar, the Seoul market close on the same Friday (Newsis, August 21, 2026). Peer figures are left in each company’s own reporting currency and are not converted.
Financial statement figures come from Korean regulatory filings, including the half-year report filed on Wednesday, August 12, 2026. Anything marked as my calculation is arithmetic I did on figures from the sources named beside it.
I will open this one again in late October. When I do, the first thing I want is the composition line in the backlog release, and the second is whether the reported margin has started to look like the order book.
- Megastudy Edu Earnings Forecast: Two Estimates Nobody Revised
- Satrec Initiative Stock Swung 4.5x While Revenue Only Rose