EcoPro BM Stock: 57% of Net Income Is Not the Parent’s
The screen told me EcoPro BM stock had earnings per share of 402.57 won. I multiplied that by the 97,830,189 shares outstanding and got roughly 39.4 billion won. Two rows above, the same screen listed net income at 91.6 billion won. Neither figure is wrong. They are 2.33 times apart because one of them belongs to the parent company’s owners and the other does not, and once I saw that, most of what the screen said about this company changed meaning.
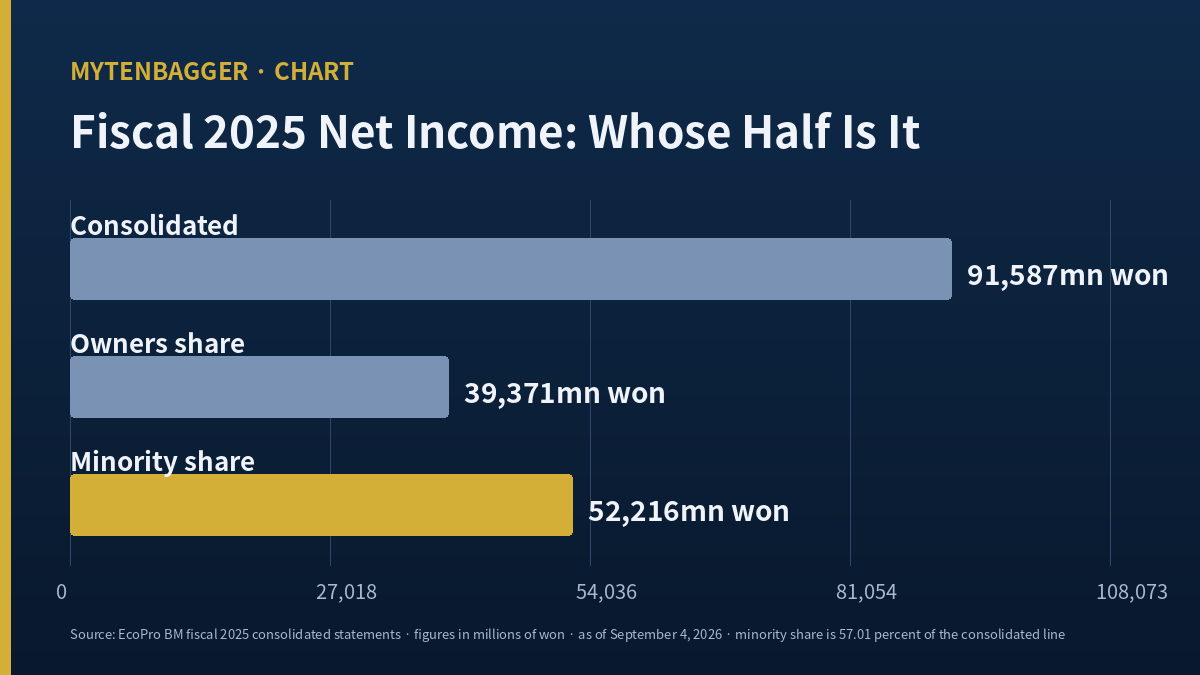
- In fiscal 2025, consolidated net income was 91,587 million won (about $67.8 million). The owners’ share of that, meaning the part belonging to holders of the listed parent, was 39,371 million won (about $29.2 million). The difference, 52,216 million won, went to minority holders in subsidiaries. That is 57.01 percent of the consolidated result.
- Every valuation ratio on my screen uses the smaller figure. I confirmed this by reversing each one: 402.57 multiplied by 97,830,189 lands on the owners’ line, and the 2.3 percent return on equity lands on owners’ equity averaged across two year-ends.
- Take the consolidated line instead and the trailing multiple falls from 263 to 113.23 (my calculation). Same price, same company, different profit line.
- This is not a one-year artifact. In fiscal 2023 the consolidated result was positive at 54,685 million won while the owners’ line was negative at 8,735 million won. The two moved in opposite directions.
- Operating profit has failed to cover interest expense in every year since 2022. The 2026 first-half reading is 0.61 times.
- I am watching, holding nothing, and the reason is in points 4 and 5 more than in point 3.
Contents
Where EcoPro BM stock sits, and what KOSDAQ means here
EcoPro BM (KOSDAQ: 247540) makes cathode materials for lithium-ion cells, mostly high-nickel chemistries, and sells them to cell manufacturers. It closed at 106,000 won on Friday, September 4, 2026, which is about $78.50 at 1,350.4 won to the dollar. Market capitalization at that close was 10.37 trillion won, roughly $7.68 billion.
KOSDAQ is South Korea’s secondary exchange, the venue for smaller and technology-weighted listings, distinct from the main KOSPI board. For a US-based reader that distinction matters in a practical way: this company has no American depositary receipt, and the Korea funds most US brokerages offer are built around large KOSPI constituents.
One more piece of context that I will keep out of the arithmetic below. The company is in the middle of a public rights offering, with new shares due to list on Thursday, November 5, 2026. Every per-share figure in this piece stands on the pre-offering share count. I wrote separately about the offering’s own arithmetic; here I am looking only at the profit line.
I reversed four EcoPro BM stock ratios and they all landed on the same line
I do not take a screen’s label at face value when the label is doing the work. So I ran each ratio backward against the filings.
Earnings per share, 402.57
402.57 multiplied by 97,830,189 gives 39.38 billion won. The filed owners’ result for fiscal 2025 was 39.371 billion. The gap is 0.03 percent, which is what a weighted average share count would produce.
Net assets per share, 17,677
Running it the other way, 1,728,773 million won of owners’ equity divided by the same share count gives 17,671. Again a rounding-scale difference, and again the owners’ line instead of the consolidated 2,016,007 million.
Return on equity, 2.3
39,371 divided by the average of two year-end owners’ equity figures (1,711,974 and 1,728,773, giving 1,720,374) is 2.289 percent. That closes.
Price to earnings, 263.31
106,000 divided by 402.57 is 263.31. So the headline multiple, the equity multiple, and the profitability reading are all built on the same 43 percent slice of the group’s earnings. That is a defensible convention. It is also invisible unless you multiply.
Four years of EcoPro BM stock earnings, counted twice
| Fiscal year | Consolidated net income | Owners’ share | Difference |
|---|---|---|---|
| 2022 | 272,653 | 232,344 | 40,309 |
| 2023 | 54,685 | -8,735 | 63,420 |
| 2024 | -58,509 | -96,512 | 38,003 |
| 2025 | 91,587 | 39,371 | 52,216 |
All figures in millions of Korean won, consolidated, from the regulatory filings. Three things in that table hold my attention.
First, 2023. The group earned money and the parent’s owners lost it. A reader looking only at the consolidated line saw a profitable year. A holder of this specific listed entity saw a loss of 8,735 million won on the shares actually held.
Second, the difference column never shrinks toward zero. It runs 40.3, 63.4, 38.0 and 52.2 billion won across four years while the consolidated result swings from a large profit to a loss and back. Whatever produces that difference is steadier than the business around it.
Third, I could not establish which subsidiaries produce it. The consolidated statements give me the split; the segment detail that would name the sources sits in notes I did not open. So I state the size and I do not name the cause. Naming a partner company here would be a guess wearing the clothes of a fact.
The EcoPro BM stock line I trust more than any multiple
Operating profit against interest expense, both from the same filings, both for the same period:
- 2022: 380,676 against 214,077, a ratio of 1.78
- 2023: 156,029 against 240,636, a ratio of 0.65
- 2024: an operating loss of 34,110 against interest of 175,425, so no ratio exists
- 2025: 143,309 against 147,552, a ratio of 0.97
- 2026 first half: 38,953 against 63,999, a ratio of 0.61
The last year in which the operating line covered the interest line was 2022. The vendor field that reports this ratio arrives with its basis marked unknown, so I reversed it: 38,953 divided by 63,999 gives 0.6087, which fixes the period as the 2026 first half cumulative. What I could not fix is what the lower half of that ratio is made of, because Korean filings sometimes populate that line with pure interest and sometimes with total finance costs. The period is certain. The definition is not, and I say so before leaning on the number.
EcoPro BM stock against three global names
| Company | Revenue, trailing | Market cap | Net margin | Price to earnings | Source, as of |
|---|---|---|---|---|---|
| EcoPro BM (KOSDAQ 247540) | KRW 2.30tn | KRW 10.37tn | 3.43% group 1.90% owners |
237.11 | Filings plus vendor screen, assembled by me, Sep 4 |
| Albemarle (NYSE ALB) | USD 5.91bn | USD 14.90bn | 3.79% | 259.04 | stockanalysis.com, Sep 6, 2026 |
| Umicore (EBR UMI) | EUR 24.61bn | EUR 5.16bn | 1.98% | 10.67 | stockanalysis.com, Aug 4, 2026 |
| Sumitomo Metal Mining (TYO 5713) | JPY 1.74tn | JPY 1.98tn | 10.12% | 11.29 | stockanalysis.com, Jul 1, 2026 |
Four cautions about that table, because it is the part of this piece I trust least.
No currency is converted anywhere in it. The revenue and market cap columns exist to show scale, and comparing 2.30 trillion won with 24.61 billion euros in your head is exactly the kind of comparison I do not want to smuggle in through a conversion I would then have to defend. The update dates run from July 1 to September 6, a spread of 67 days, and Sumitomo’s row is the stale one.
My row is the only one I built by hand. There is no page for a KOSDAQ listing on the reference site I use for the other three, so I summed four quarters of filed revenue myself (625,060 plus 497,011 plus 605,361 plus 576,712, giving 2,304,144 million won) and computed the margins and the multiple from that base. The 237.11 uses the owners’ trailing result of 43,735 million; the screen’s own 263.31 uses the fiscal 2025 owners’ figure instead, which is why the two differ.
And the row I keep looking at is Albemarle’s. Its multiple of 259.04 sits 1.65 percent away from the 263.31 on my screen. Two companies in adjacent parts of the same supply chain, priced on almost the same multiple of almost nothing. The lithium producer got there by watching prices collapse. This one got there partly the same way and partly because most of what it earns is counted for someone else.
An EcoPro BM stock revenue field that says one thing and holds another
The vendor screen reports revenue of 2,531,576 million won and marks the basis as trailing. That number is the fiscal 2025 annual figure, to the won. The genuine trailing sum from the four most recent filed quarters is 2,304,144 million. The field runs 9.87 percent above the actual trailing total, and the only way to see it is to add the quarters up.
The direction matters and I want to be precise about it, because I have gotten this backward before. The screen’s number is the larger one. Anything computed from it, including a price to sales reading, will look cheaper than the trailing arithmetic supports.
Revenue itself is worth two lines. Fiscal 2023 came in at 6,900,867 million won; fiscal 2025 at 2,531,576. That is a decline of 63.32 percent across two years. Inventory days went 73.5, then 110.4, then 101.7, then 125.0 across the four most recent quarters, so the stock of unsold material has been building while the top line has been shrinking. Operating cash flow for the 2026 first half was negative 161,032 million won, about negative $119.2 million, and free cash flow was negative 322,748 million, about negative $239.0 million. Summing 2023 through the 2026 first half gives cumulative free cash flow of negative 1,615,364 million won, roughly negative $1.20 billion. I am not extending any of those series forward. I am noting that they all point the same way.
Where EcoPro BM stock keeps the other side of that split
If minority holders took 57.01 percent of 2025 profit, a reasonable next question is how much of the balance sheet they own. The filings answer it directly.
At December 31, 2025, total equity was 2,016,007 million won. Of that, 1,728,773 million sat with the parent’s owners and 287,234 million with minority holders. That is 14.25 percent of equity. At June 30, 2026 the same split reads 1,795,196 and 301,302 out of 2,096,499, or 14.37 percent.
So the minority position carries roughly a seventh of the group’s book capital and received more than half of a year’s earnings. Dividing one by the other, the profit share ran 4.00 times the equity share in fiscal 2025 (my calculation, 57.01 divided by 14.248).
There are ordinary explanations for a gap like that. Subsidiaries with outside partners can be the profitable ones while the parent-level operation carries the losses, and a partner who funded a plant that is running well will collect on it regardless of how the rest of the group is doing. I am not able to confirm which of those applies, for the same reason as before: the entity-level detail is in notes I did not open. What I can say is that the gap is large, that it is arithmetic and not interpretation, and that it is not visible on any summary screen I use.
What the balance sheet did while the income statement swung
Debt to equity, five readings
126.73 percent at the end of 2022, then 172.71, then 118.70, then 142.16 at the end of 2025, and 159.07 percent at June 30, 2026. Total assets at that last date were 5,431,383 million won against liabilities of 3,334,884 million. The ratio has not settled in four years, and the most recent reading is the second highest of the five.
Capital expenditure, four readings
756,168 million won in 2023, then 1,023,789 million in 2024, then 418,130 in 2025, then 161,716 in the 2026 first half. The peak year for spending was the year the operating line went negative. Spending has since come down by roughly three quarters from that peak on an annualized view, which I mention as a fact about the past and not as a forecast about the next half.
The four quarters I added up
Because I had to build the trailing revenue total myself, the quarterly ladder is worth showing instead of hiding inside a sum. Discrete quarterly revenue ran 625,060 million won in the third quarter of 2025, then 497,011 in the fourth, then 605,361 in the first quarter of 2026, then 576,712 in the second. The last figure is 7.74 percent below the first, and the series has no direction to it; it goes down, up, and down again inside four quarters. Discrete quarterly operating profit over the same four periods ran 50,481, then 41,558, then 20,942, then 18,011, which does have a direction. Revenue wandered while the operating line fell by 64.32 percent from the first of those quarters to the last (my calculation). That divergence is the part I would want a fifth quarter to resolve before I did anything.
Who holds the shares
The vendor screen dated September 4, 2026 lists the largest shareholder group at 45.06 percent, treasury stock at 0.01 percent, foreign ownership at 14.64 percent and margin balance at 1.31 percent. The treasury position is small enough that it changes nothing in the per-share arithmetic above, which is why I used the full 97,830,189 count throughout.
A share count I once treated as one number
Years ago I built a small spreadsheet that valued Korean holding companies by dividing market capitalization by consolidated net income. I liked it because it was fast. It gave me a ranking in seconds and the rankings looked sensible, and for a while I used it to decide which filings were worth opening.
What I had done was put a market capitalization that counts only the parent’s shares over an earnings figure that counts every subsidiary’s profit in full. Those two lines are measured against different populations. For companies with small minority interests the error is a rounding difference and I never noticed. For a company like this one, where the minority share of profit runs above half, the same spreadsheet would have made it look roughly twice as cheap as any consistent calculation would.
I fixed the formula eventually. What took longer was accepting that the thing I had trusted was not a shortcut with a small error in it; it was two incompatible measurements sitting in the same cell, and the years it looked right were the years the incompatibility happened to be small.
Six ways I could be wrong about this reading
- A large minority interest is normal for a company that builds through partnerships. Cathode capacity is frequently financed together with the cell maker that will consume the output. If that is what is happening here, the split I have spent this piece on is a feature of the funding model, and the fix is to value the group instead of the listed slice.
- I did not open the subsidiary notes. Everything above rests on the consolidated split. The names, ownership percentages and individual results that would explain it are in disclosure I did not read.
- Fiscal 2025 may not be representative. One year in which the minority share reached 57 percent does not establish a run rate, even with the 2023 sign divergence beside it.
- The market is a long way above me. The vendor screen showed a 172,386 won average drawn from 14 houses on September 4, with a consensus opinion score of 3.79 out of 5. That average sits 62.63 percent above the close. I did not read a single one of those reports in full.
- My forward coverage is thin. One named analyst, Jung Won-seok of iM Securities, appears in Korean press from July 1, 2026, calling the investment program defensible while saying the results still need confirming. Beyond that I have a consensus screen and a multiple quoted in a July article. The vendor’s forward earnings and forward multiple fields are both empty, as they have been for every company I have written up this year.
- The interest coverage line I lean on has an unresolved definition. If the reported interest expense includes total finance costs instead of pure interest only, the ratios above are understated and the picture is less severe than I have drawn it.
What I am waiting for
I hold none of this and I have no order working. Three things would change that, in order of how much weight I give them.
The first is the interest line. If a quarterly operating result covers interest expense at better than 1.0 times, the single most persistent fact in this write-up stops being true, and I would reopen the file that afternoon.
The second is the split. If the owners’ share of consolidated net income rises above 60 percent for two consecutive reporting periods, the 263 and the 113 start converging and the screen stops misleading anyone who does not multiply.
The third is inventory. Days outstanding falling back under 90 while revenue stops declining would tell me the material is moving again.
The second of those is the one I want to flag as awkward. The owners’ share is disclosed quarterly, but it is disclosed as a line in a filing and not as a field on any screen I keep open, which means the condition I have written down is one I have to go and construct by hand each quarter. I have learned that conditions requiring manual construction quietly stop being checked. So I am writing the arithmetic here in full, in the same place as the condition, so that the next version of me has less to rebuild.
For the neighboring reading in this chain, I looked at where LG Energy Solution’s quarterly profit actually came from and at why a credit downgrade told me more than LG Chem’s discount to book. Both of those pieces examined an income statement. This one examined who the income statement belongs to, which is a different question about the same industry.
Prices and multiples reflect the September 4, 2026 close as checked at the time of writing. USD conversions are approximate, at roughly 1,350.4 won per dollar on that same date per Money Today. Korean won is the reference currency throughout. Financial statements are consolidated, from Korean regulatory filings; share count and shareholder data come from a Korean vendor screen dated September 4, 2026. Rights offering details are drawn from Korean press coverage of the June 30, 2026 disclosure and the September 2, 2026 pricing report; the analyst comment is reported secondhand via Korean press from July 1, 2026, and the deal commentary via Invest Chosun. I did not read the securities registration statement itself.