Unison Wind Carries Less Leverage Than Vestas or Nordex
Unison wind turbine maker (018000 on the KOSDAQ, the junior board of the Korea Exchange, where most of Korea’s small industrial names list) closed June with more liabilities than equity and with a paid-in capital account larger than its total equity, which in Korean accounting is the definition of a partial capital shortfall. Two months later the company said both problems were gone. I spent this session checking the two numbers it published to prove that, and they do not agree with each other by about 5.7 billion won. That gap is what I want to record here, alongside a comparison that surprised me more.
Debt to equity, 171.33 percent ~ 92.07 percent
Capital shortfall ratio, 19.05 percent ~ negative 1.66 percent
Liabilities as a share of assets, 63.14 percent ~ 47.94 percent
Contents
What Unison Wind’s Balance Sheet Showed on June 30
I started from the half-year statement of financial position. Total assets stood at 284.98 billion won, roughly 211.55 million US dollars. Liabilities were 179.95 billion won, about 133.58 million dollars. Equity was 105.03 billion won, about 77.97 million dollars. Divide liabilities by equity and you get 171.33 percent. Divide liabilities by assets instead and you get 63.14 percent, which matches the 63.15 percent one aggregator screen prints, the rounding being the only difference.
The paid-in capital account is where it gets interesting. That account held 129.74 billion won, about 96.31 million dollars, which is more than total equity of 105.03 billion won. Subtract equity from paid-in capital, divide by paid-in capital, and the result is 19.05 percent. Korean filings call that the capital shortfall ratio, and it is the number a KOSDAQ company watches because sustained erosion carries listing consequences. The company’s own announcement put the figure at 19.05 percent as well, so I know my basis matches its basis.
The Two Ratios Unison Wind Put Side by Side
On August 31, 2026 the company disclosed that its largest shareholder had converted its entire holding of a convertible bond into common stock. The face value was 37.6 billion won, about 27.91 million dollars, at a conversion price of 1,160 won per share. Korean outlets covering it, including an energy trade publication and a Korean business daily, printed the same two after figures: debt to equity falling to 92.07 percent and the capital shortfall ratio falling to negative 1.66 percent, the negative sign meaning equity now exceeds paid-in capital. One of them added that a double-digit leverage reading would be the first since 2012.
Working backward from 92.07 percent
A bond conversion, in accounting terms, moves a carrying amount out of liabilities and into equity while leaving total assets untouched. So there should be a single number that, subtracted from liabilities and added to equity, produces the published figure. Solve for it and that number is 43.343 billion won. Equity becomes 148.373 billion won, liabilities become 136.607 billion won, and the two still sum to 284.98 billion won, the asset total, which tells me the reclassification assumption holds.
Then I checked the other published figure independently. Paid-in capital after the conversion is 145.956 billion won, about 108.35 million dollars, a figure I took from the capital-history table and not from the press coverage. For the shortfall ratio to read negative 1.66 percent, equity has to be 148.379 billion won, which implies a move of 43.349 billion won. The two paths differ by 6 million won, which is rounding. Both land on roughly 43.3 billion won, about 32.18 million dollars.
The Gap Between the Bond’s Face Value and the Balance Sheet
Here is the problem. The bond’s face value was 37.6 billion won. The balance sheet move implied by both published figures is 43.3 billion won. The difference is about 5.7 billion won, roughly 4.26 million dollars.
If only the 37.6 billion had moved, debt to equity would read 99.80 percent and the capital shortfall ratio would still be positive at 2.28 percent. In other words, the company would not have been able to announce that the shortfall was cleared. The announcement and the arithmetic only agree if something beyond the bond’s face value left the liability side at the same time.
My best reading is that a separate liability attached to the conversion feature was extinguished along with the bond. Korean convertibles issued with price-reset clauses often carry a derivative liability measured at fair value, and this bond’s conversion price had been adjusted upward once in late 2025, which is a reset clause behaving normally. On conversion, both the bond and that derivative would be credited to equity. That would produce exactly the pattern I see. But I did not read the half-year notes, so I am not going to call the 5.7 billion won a derivative. I am calling it unidentified, and noting that it is 15.3 percent of the announced face value, which is large enough that a reader relying on the press figures alone would build the wrong before-and-after picture.
Unison Wind Was Already the Least Levered Name on the List
Everything above treats 171.33 percent as a problem being solved. Then I put the number next to companies that make the same product, and the frame inverted.
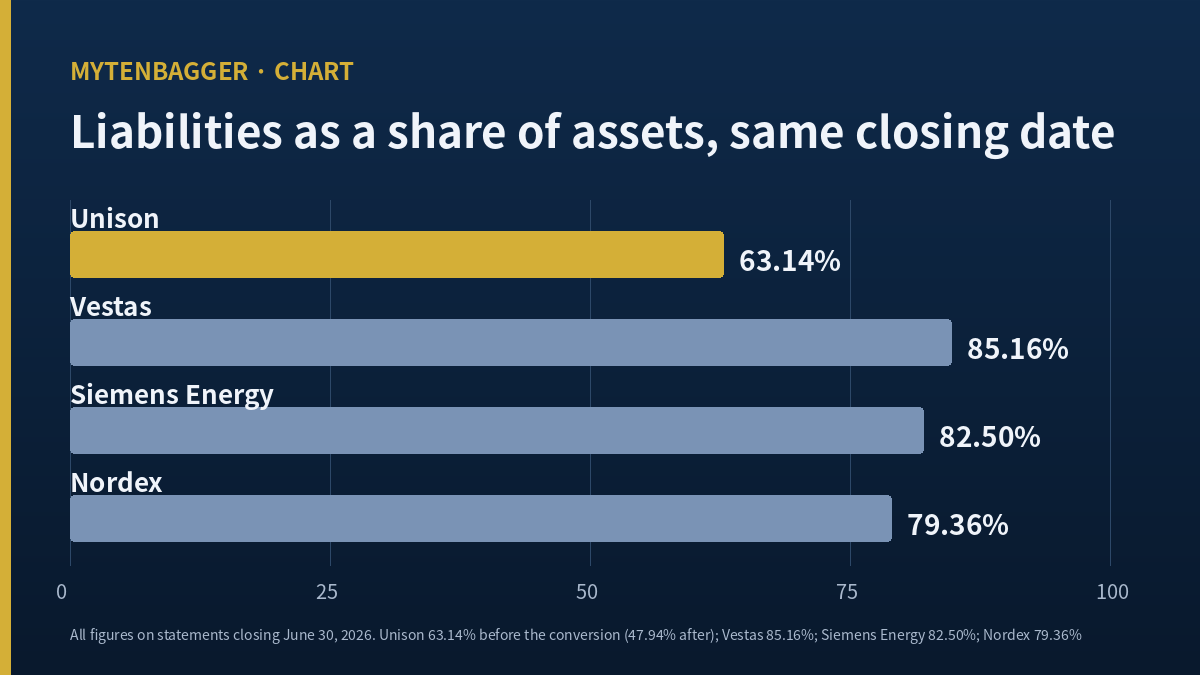
Vestas Wind Systems carried liabilities equal to 85.16 percent of assets, Siemens Energy 82.50 percent, and Nordex 79.36 percent, every one of them measured on a statement closing the same day as Unison’s. Unison’s 63.14 percent sits 16.22 points below the least levered of the three, and after the conversion it sits at 47.94 percent. On a liabilities-to-equity basis the distance is wider still: 573.77 percent at Vestas, 471.44 percent at Siemens Energy, 384.84 percent at Nordex, against 171.33 percent before the conversion.
Where those three figures came from
Vestas Wind Systems, Copenhagen listing VWS, trailing twelve months to June 30, 2026: assets 26,715 million EUR, liabilities 22,750 million EUR, equity 3,965 million EUR, data page last updated August 12, 2026.
Siemens Energy, Frankfurt listing ENR, trailing twelve months to June 30, 2026: assets 63,836 million EUR, liabilities 52,665 million EUR, equity 11,171 million EUR.
Nordex, Frankfurt listing NDX1, trailing twelve months to June 30, 2026: assets 7,070 million EUR, liabilities 5,611 million EUR, equity 1,458 million EUR, data page last updated July 29, 2026.
Three Balance Sheets Closing on the Same Day
I chose these three on one criterion and one only: their most recent balance sheet closes on June 30, 2026, the same date as the Korean company’s half-year statement. Not revenue size. Not market value. Not geography. For a leverage comparison the closing date is the thing that has to match, because a balance sheet is a photograph and two photographs taken four months apart of a business that raises capital in tranches are not comparable at all. I could find exactly three names in this industry where I could verify that date from a source that also printed the three totals I needed. That is why there are three and not five.
The spread across the three European names is narrow, 79.36 to 85.16 percent, a range of 5.80 points. Narrow spreads make me more willing to treat a comparison set as describing an industry norm. Three companies clustered within six points on the same measurement date is a different kind of evidence from three companies scattered across twenty points.
I am accumulating CS Wind, the world’s largest wind tower maker, and I wrote about why the US tax credit cliff is the thing that matters there. That piece and this one look like they belong to one industry file, and they do not. CS Wind’s problem is what happens to profit that already exists when a subsidy expires. The company in front of me now has no profit for a subsidy to touch. I am not putting the two in the same basket because they bolt towers and nacelles for the same customers.
Why Low Leverage May Be Bad News for Unison Wind
The obvious reading of that comparison is that the Korean company is conservatively financed and the Europeans are stretched. I do not believe that is what the table says.
A turbine maker’s liability side fills up when it is selling. Customer advances on signed orders, warranty provisions on an installed fleet, payables to a supply chain running at volume: all of that is a liability, and all of it is evidence of activity. A company with almost no orders in progress has almost none of those liabilities. So a low reading here may be measuring absence, not prudence. I could not verify the composition of the three European liability stacks, so I am putting this in the same place I put the 5.7 billion won: a reading I find persuasive that I have not proved.
What I can verify is the shape of the Korean company’s own liability side. Current liabilities were 155.42 billion won, about 115.37 million dollars, against non-current liabilities of 24.53 billion won, about 18.21 million dollars. So 86.37 percent of what it owes comes due inside a year. Current assets were 65.66 billion won, about 48.74 million dollars, which is 42.25 percent of current liabilities. That coverage did not change when the bond converted, because the bond was not a current liability item that a conversion improves. Leverage fell and liquidity stood still.
The long-dated debt that vanished two years ago
One earlier movement makes the current concentration legible. Non-current liabilities were 85.14 billion won at the end of 2023 and 22.12 billion won at the end of 2024, a fall of 63.02 billion won, about 46.78 million dollars. Total liabilities fell far less over the same stretch. Long-dated obligations came forward into the twelve-month window and mostly stayed there. That is why 86.37 percent is where it is, and it is a 2024 event and the 2026 conversion did not cause it.
What the Largest Shareholder Paid to Get There
The converting holder was the company’s largest shareholder, a construction and development firm. Its stake went from 9.02 percent to 19.13 percent, and with a related contractor holding 2.93 percent the combined position is 22.06 percent. The conversion price was 1,160 won a share.
Two things follow. First, the balance sheet repair was performed by an insider deciding to stop being a creditor, and the company said as much, framing it as tying the shareholder’s interests to long-term growth. Second, that insider more than doubled its stake at a price it agreed to years earlier. When a private equity buyer paid 23,700 won for control of another Korean renewables developer, the price it paid was public and I could set it beside the market quote. The structure here is different in a way worth stating plainly: that buyer wrote a cheque for shares, while this holder swapped a loan it had already made. The first tells you what someone thought the equity was worth on the day. The second tells you what someone decided about a loan.
No House Publishes a Forecast for Unison Wind
There is no sell-side estimate for this company. The consensus page for the ticker, read on September 15, 2026, showed Not Rated, a zero in the valuation field, a zero in the forward earnings field, and an empty count of contributing houses. The list of individual reports was empty too.
One document did have the name in it. A Meritz Securities sector note on Korean wind, written by analyst Moon Kyeong-won, CFA, and dated April 21, 2026, listed the company in a summary table of domestic wind-related stocks as 319 billion won of market value, 40 billion won of 2025 revenue, and a 10 billion won 2025 operating loss, with the market marked domestic. Three historical figures and no projection. The analysis in that note was pointed at other names.
With Doosan Enerbility the raw material was that the consensus valuation sat at roughly twice the quote, and the work was reading the disagreement inside a thick coverage set. Here the coverage set is empty, and reading an empty set is a different job with a different failure mode. I did not fill the gap with a forecast of my own. Every forward number in this piece is a date that has already been filed, not an estimate.
The Habit Unison Wind Broke for Me
Two ratios in one announcement read to me as a closed set. When I saw 92.07 percent and negative 1.66 percent printed next to a 37.6 billion won bond, I took the three numbers as one internally consistent statement and moved on to the comparison work. I came back to them only because a rounding check on the paid-in capital account happened to put the equity figure in front of me again, and the equity figure was too large.
The misreading has a name I can use later: I treated a set of published figures as complete because they were published together. Two percentages and an amount arriving in the same paragraph feel like a system that closes, and they are actually three separate assertions, each computed by someone with their own basis, none of them obliged to reconcile with the other two.
The habit I am replacing it with: when a company publishes a before-and-after percentage pair alongside a transaction amount, solve the pair for the implied balance sheet movement before using any of the three. If the implied movement does not equal the stated amount, that difference is the story and the percentages are not. In this case it took one line of arithmetic and it changed what the piece is about.
Where I stand and what would move me
I hold none of this and I placed no order. I am not able to price a business whose forward revenue nobody publishes and whose liability structure has 86.37 percent of its obligations inside twelve months against current assets covering 42.25 percent of them. Leverage falling to 92.07 percent does not change either of those facts, because the conversion moved a non-current item.
My thesis on the balance sheet breaks in one of two directions, and both are documents and not prices. If the 2026 annual report shows non-current liabilities back above the 85.14 billion won level of the end of 2023, the company has refinanced its way out of the current-liability concentration and the liquidity picture I described stops being the binding constraint. If the half-year notes or the annual notes identify the 5.7 billion won and it turns out to be something other than an extinguished conversion-feature liability, then my reading of the whole reclassification is wrong and the peer comparison is the only part of this piece worth keeping.
The secondary condition: if a second named house publishes a balance sheet view on this company, I will read the leverage comparison against theirs before trusting mine, because right now every percentage in this piece was computed by me from screens.
On access, there is no American depositary receipt for this name and I am not going to point at a particular brokerage. KOSDAQ small caps reach foreign accounts through whichever intermediary a reader already has, and the thing worth saying is not the plumbing. It is that a 235 million dollar company with no analyst coverage is thin in both directions at once. The absence of coverage is part of what makes the arithmetic in this piece available to anybody willing to do it, and it is the same absence that would make a position hard to leave. I do not treat those as two separate facts.
Twenty-One Things About Unison Wind I Could Not Verify
- I read the June 30, 2026 balance sheet from an aggregator screen and not from the half-year filing itself.
- I did not read the notes to that statement, which is where the 5.7 billion won would be named.
- I do not know whether the published percentages were computed on consolidated or parent-only figures.
- The screen I used showed no non-controlling interest line, so I assumed there is none.
- I did not see a statement of changes in equity, which would show the conversion entry directly.
- I did not verify whether total assets truly stayed constant across the conversion date.
- The conversion price of 1,160 won comes from press coverage and not from the filing.
- I did not read the bond’s original terms, so the reset clause is inferred from one price-adjustment report.
- I did not confirm the bond’s issue date, coupon, or maturity.
- I did not establish whether other convertible or warrant liabilities remain outstanding.
- The paid-in capital figure after conversion came from a capital-history table I did not cross-check against a filing.
- I did not confirm the treasury share count, which affects any market value calculation.
- I did not verify the listing thresholds attached to the capital shortfall ratio for this issuer.
- The three peer balance sheets come from one data provider and I did not check them against company reports.
- I did not verify the composition of any of the three companies’ liabilities, which is the load-bearing assumption of my counter-reading.
- They report in euros and I did not adjust for accounting framework differences.
- Two of the three data pages carry different last-updated dates, so the three totals were not all refreshed together.
- I did not speak to the company, its shareholder, its auditor, or any competitor.
- I have not seen the largest shareholder’s own accounts, so I cannot say what the conversion cost it.
- The absence of sell-side coverage rests on one consensus page and one sector note.
- The previous item is the weakest joint in this piece for a reason that also applies to the strongest one. My central finding exists only because the company published two ratios that could be inverted. A company that published a single percentage, or none, would have given me nothing to invert and I would have written that its balance sheet improved. So what looks like a discovery about this company may be a fact about disclosure formats, and the reader should discount the first four sections by however much they think that is true.
Which sentence here ages first
Before closing I want to rank my own sentences by how quickly they stop being useful, because that tells me where to start when I open this file again.
The first to go is the share price, about 0.90 dollars, and the market value of about 235 million dollars that comes from it. Those are stale within days. Second is the after picture, 92.07 percent and negative 1.66 percent, because both are computed on a June balance sheet and the September quarter will replace it. Third is the peer comparison, which holds only until the next reporting date moves one of the four photographs out of alignment. The slowest to age is the gap between 37.6 billion won and 43.3 billion won. That is a fixed relationship between a disclosed amount and two disclosed percentages, and no future filing makes it go away. It can only be explained. The weight of this piece sits on the last line, which is also the only line I could not close.
Prices and percentages reflect the September 15, 2026 close as checked at the time of writing and the error runs in the direction of staleness. Balance sheet items are the June 30, 2026 position. Korean won is the reference currency throughout and US dollar conversions are approximate, at about 1,347.10 won per dollar, the September 14, 2026 close, the most recent row available in the rate table I used. Euro figures for the three European companies are printed as reported and not converted.