SeAH Steel and US Tariffs: Cash Flow Went Negative, Profit Held
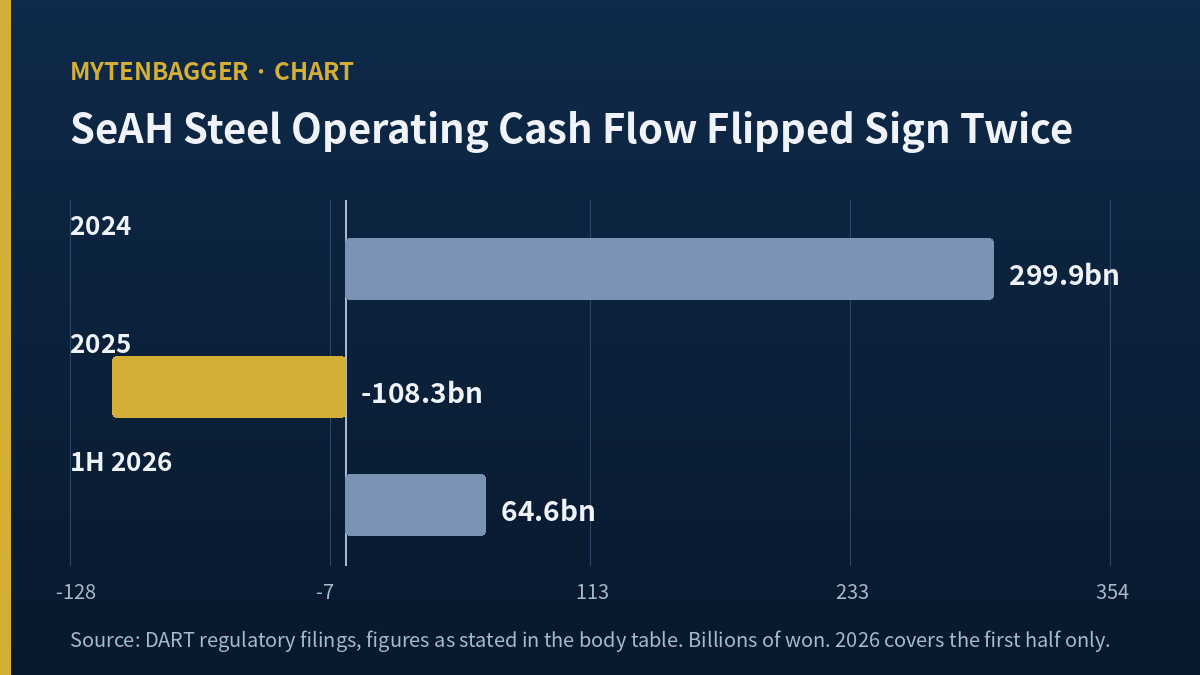
Two statements filed by the same company disagreed with each other for a full year, and I only noticed because I was reading them out of order. SeAH Steel stock closed at 135,600 won on Wednesday, August 19, 2026. What pulled me in was not the price. It was the fact that the income statement said 2025 was a profitable year and the cash flow statement said the company sent 108.3 billion won out the door.
| Period | Operating profit | Cash from operations |
|---|---|---|
| FY2024 | +202.9bn won | +299.9bn won |
| FY2025 | +49.6bn won | -108.3bn won |
| First half 2026 | +59.0bn won | +64.6bn won |
Source: statutory filings with Korea’s Financial Supervisory Service. Korean won is the reference currency; USD equivalents appear where they help. At roughly 1,397.7 won per dollar on August 19, 2026, the three cash figures are about +215m, -78m and +46m dollars.
The operating profit column never once turned negative. The cash column crossed zero twice inside eight quarters. That is the whole reason this piece exists, and I want to say up front that I did not finish the job: I can account for a minority of the swing and not the rest. A KOSDAQ platform company crossed the same line in the June 2026 quarter with a double-digit operating margin still intact — I counted the quarters in the SOOP note.
Contents
What SeAH Steel stock represents, in one paragraph
SeAH Steel Corp. trades on the Korea Composite Stock Price Index, or KOSPI, the main board of the Korea Exchange. That distinction matters for anyone screening from abroad: Korea runs two boards, KOSPI for larger established issuers and KOSDAQ for growth names, and this company sits on the former. It makes steel pipe. Oil country tubular goods, line pipe, structural and plumbing pipe. In the first quarter of 2026, pipe products accounted for 417.8 billion won of 448.6 billion won in consolidated revenue, with exports of 217.5 billion won running ahead of domestic sales of 200.3 billion won, according to Korean press citing the quarterly filing.
The practical consequence is that this company’s margin is set in Houston more than in Seoul. American rig counts, American tariff schedules and American antidumping determinations move the numbers. A reader in the United States is closer to the demand side of this business than a reader in Korea is.
Reading the cash column of SeAH Steel stock from the bottom up
2024: cash ran ahead of profit
In fiscal 2024 the company earned 202.9 billion won of operating profit and collected 299.9 billion won of operating cash, a ratio of 1.478 by my calculation. Capital spending of 90.4 billion won still left free cash flow of 209.5 billion won. On a market value basis that year would have looked generous against today’s 384.6 billion won of market value, though the two are a year and a half apart and I am not treating that as a valuation argument.
2025: the columns split
Revenue fell 17.9 percent to 1,484.8 billion won. Operating profit fell 78.6 percent to 49.6 billion won, still comfortably above zero. Operating cash flow went to minus 108.3 billion won and free cash flow to minus 154.1 billion won. The swing in operating cash from the prior year is 408.2 billion won, which is larger than the company’s entire current market value.
2026 so far: the columns close again
Through June 2026, operating profit of 59.0 billion won came with operating cash of 64.6 billion won, a ratio of 1.094 by my calculation. Free cash flow of 59.0 billion won on capital spending of 5.6 billion won. Whatever pulled the two columns apart appears to have stopped pulling.
The part of the swing I can name
Inventory is the obvious suspect and it does carry some of the load. Inventory stood at 269.1 billion won at the end of 2024, 319.9 billion at the end of 2025, and 367.8 billion at the end of June 2026. That is a build of 50.8 billion won across 2025 and 98.7 billion won cumulatively, a 36.68 percent increase from the 2024 close.
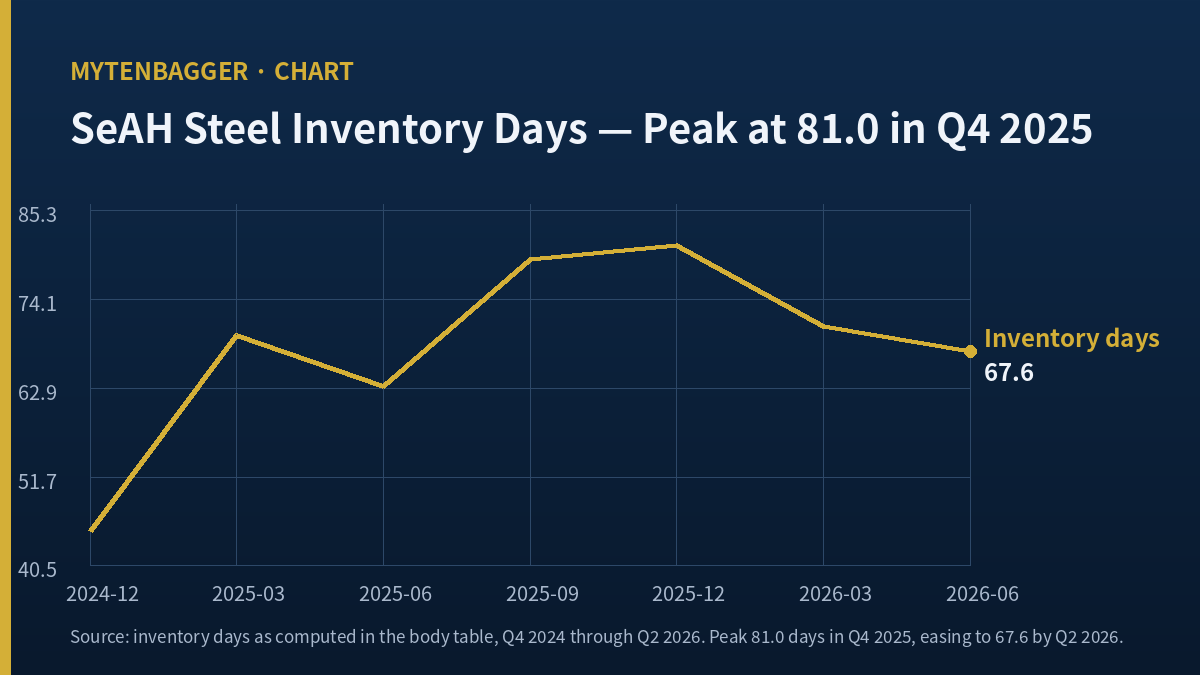
Days of inventory tell the same story with more texture. On the fourth quarter of 2024 the figure was 44.8 days. It ran 69.6, 63.2, 79.2 and 81.0 days through 2025, then eased to 70.7 and 67.6 days in the two quarters of 2026. Steel sat in the yard longer through the bad year and has been moving somewhat faster since.
Here is where my accounting stops. A 50.8 billion won inventory build explains 12.45 percent of a 408.2 billion won swing. The other 87.55 percent sits in receivables, payables, tax and working capital lines I could not retrieve, because Korea’s electronic disclosure portal blocked automated access on every attempt and the cash flow statement detail is not carried in the secondary sources I could reach. I am recording how big the hole is instead of filling it with a guess about what sits inside.
What the income statement was doing while SeAH Steel stock cash flow went negative
Quarterly operating margin, computed by me from filed single-quarter figures: 14.20 percent in the second quarter of 2022, 13.36 percent in the second quarter of 2023, 8.18 percent in the second quarter of 2024, then 6.75, 5.04, minus 1.56 and 2.30 percent across 2025, then 5.37 and 7.06 percent in 2026.
The trough quarter, at minus 1.56 percent, was the third quarter of 2025 and it sits almost exactly where the cash column was at its worst. Since then the margin has risen for three consecutive quarters. First half 2026 operating profit of 59.0 billion won is 1.19 times the full year 2025 figure of 49.6 billion won. Second quarter revenue of 495.2 billion won was the highest single quarter since the second quarter of 2023.
One quarter is missing from that list on purpose. The fourth quarter of 2024 computes to a 22.70 percent margin, which would be the best reading in the series. It is arrived at by subtracting nine-month figures from a full-year figure, and for this company the nine-month statements through 2024 were parent-only while the annual was consolidated. Subtracting one basis from the other produces a number that belongs to neither. I left the cell empty, and I am saying so out loud instead of dropping it quietly.
Tariffs work against this company and for it at the same time
The United States Section 232 duty on steel articles has stood at 50 percent since June 4, 2025. What was reduced on June 8, 2026 was the derivative-product rate, cut from 25 to 15 percent under the trade understanding reached with Korea, and pipe itself is outside that reduction. The company told regulators it could not reasonably estimate the financial effect of the duties on its statements, and Korean press quoted that language directly from the quarterly filing.
The same wall has a door in it. High duties suppressed imports, American pipe prices rose, and in a preliminary administrative review published in the Federal Register on March 16, 2026 this company’s antidumping margin came out at 0.00 percent. North American OCTG averaged 2,128 dollars per ton in the second quarter of 2026 against 1,892 dollars in the first, per figures cited by Daol Investment & Securities analyst Lee Jung-woo in a July 20, 2026 note. Management put the second quarter improvement down to North American oil and gas pipe volume and higher selling prices.
The input side is moving too, and not helpfully. American hot-rolled coil ran 1,106 dollars per metric tonne in late July 2026 and 1,264 dollars on August 10, per SteelBenchmarker, a rise of 14.3 percent in under a month. Rig activity, the demand signal on the other side, stood at 562 units in late May with fifteen added month on month and six consecutive weekly increases, per figures carried in Korean sell-side commentary. Output prices and input prices are both climbing, which is why I stopped short of claiming the tariff regime explains the margin by itself.
A date is attached to all of this. The United States International Trade Commission opened a five-year sunset review on April 7, 2026, final written submissions are due September 3, 2026 (Thu), and the determination follows in September. If the orders lapse, imports return and the price support goes with them.
Three pipe makers, one quarter, three margins
I picked the peers on a narrow test: companies that sold the same product into the same market in the same three months. All three reported a June-quarter 2026 result.
| Company | Q2 2026 revenue | Q2 2026 operating profit | Operating margin |
|---|---|---|---|
| Tenaris (NYSE: TS) | 2,967m USD | 494m USD | 16.65% |
| Vallourec (Euronext: VK) | 762m EUR | 88m EUR | 11.55% |
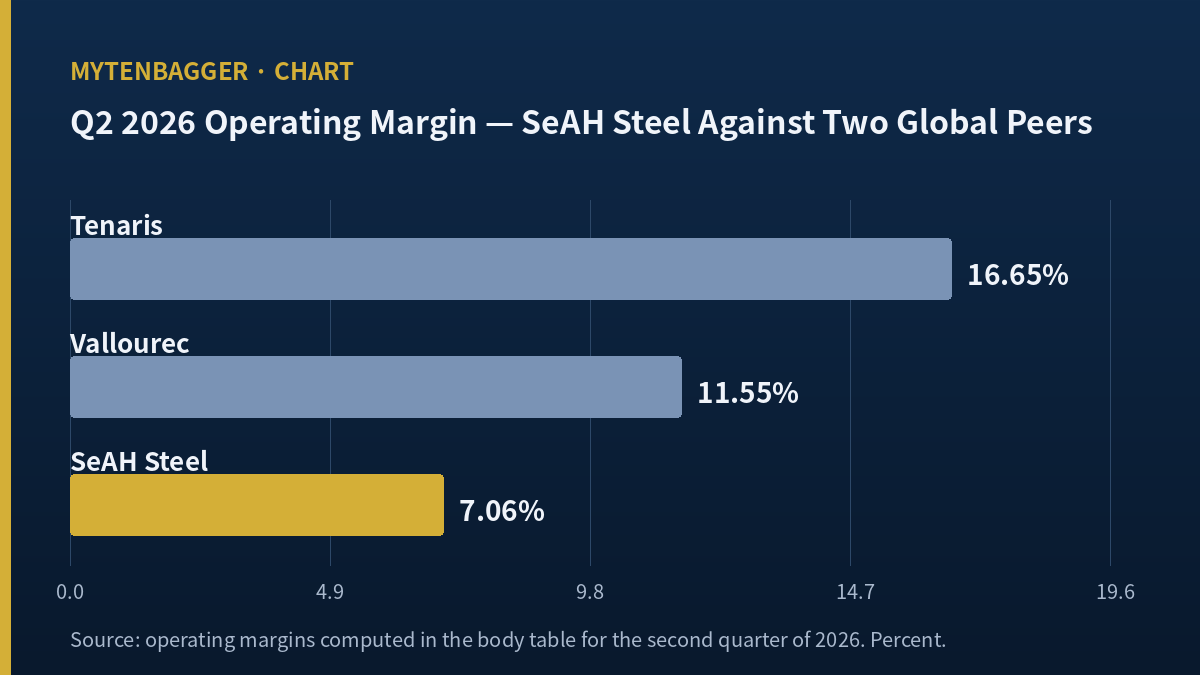
| SeAH Steel (KRX: 306200) | 495.2bn won | 34.9bn won | 7.06% |
Margins computed by me from each company’s reported revenue and operating profit. Currencies are left in their reporting units on purpose: converting three currencies through one exchange rate would add error without adding meaning.
Sixteen and a half, eleven and a half, seven. The ordering is not surprising, since Tenaris and Vallourec both run seamless mills with different cost structures and this company is predominantly a welded producer. What interests me is that Tenaris carried a market value near 26.85 billion dollars as of August 17, 2026 while this company carries roughly 0.28 billion dollars. Ninety-seven times the market value on a margin a little over twice as wide.
Vallourec’s own management noted that inventory levels across the chain now sit below the five-year average and that restrained imports, driven by existing tariffs and open trade investigations, are supporting North American mill utilization. That is the same tailwind, described by a company that does not have to write it in Korean.
Dividend arithmetic behind SeAH Steel stock
Dividend per share went 1,800 won in 2018, rising each year to 8,000 won in 2023, then 7,000 and 5,500 won. A 31.25 percent cut from the peak. Over the same stretch net profit belonging to owners of the parent fell from 188.8 billion won to 30.0 billion won, a decline of 84.11 percent. Total distribution moved from 22.7 billion won to 15.6 billion won by my calculation, on 2,836,283 shares outstanding.
The payout ratio therefore climbed from 12.02 percent to 52.00 percent. Two accounts of that fit. Either the board protected the dividend through a bad year, or the dividend is now the first thing that gives if profit does not return. I do not think the data picks between them.
A small note on the yield figure itself. The data screen I use reports 4.14 percent. Dividing 5,500 won by that rate implies a price near 132,850 won, and this stock closed at 132,800 won on Friday, August 14, 2026, which is when the dividend field was last refreshed. Against the August 19 close the yield is 4.06 percent. Neither number is wrong. They are anchored to different days, and this piece is anchored to the later one.
Where I stand on SeAH Steel stock and what would move me
Market value of 384.6 billion won puts this outside Korea’s top hundred, and my standing practice is that names in that range get observation. The seven-point screen I run scores it 71, passing on revenue scale, earnings per share, price-to-book of 0.34, price-to-earnings of 12.82 and positive operating profit, failing on operating margin of 3.34 percent and return on equity of 2.7 percent. Both failures are 2025 annual figures, which is to say they describe the year this piece is about and not the two quarters since.
On the multiple: 12.82 uses the 2025 net profit of 30.0 billion won. Rolling twelve months, taking the first half of 2026 at 53.5 billion won plus fiscal 2025 minus the first half of 2025, gives 56.0 billion won and a multiple of 6.87 by my calculation. Same closing price, same share count, different twelve months. The screen’s under-15 verdict holds either way; only the margin of comfort changes.
What would move me is not the profit line. It is whether the two statements stay married. If third quarter 2026 operating cash comes in below operating profit again, I will treat the 2025 divergence as a working-capital pattern and no longer as a single bad year, and I will not change my read until I can name the missing 87.55 percent. If cash tracks profit for a second consecutive quarter, the divergence was a one-year event, and the question moves back to margin, where a single-quarter operating margin above 10 percent would tell me the recovery is faster than I assumed and one below 7 percent would tell me it has flattened.
Six ways I could be wrong about SeAH Steel stock
- A negative cash year is normal for this industry. Steel pipe makers carry heavy working capital and a single year of build during a downturn is unremarkable. I did not check whether peers ran negative operating cash in 2025, which would have settled this quickly.
- The direction is against me. Cash turned positive again, margin has risen for three quarters, and half-year profit already exceeds the full prior year. I am writing about a wound that is closing.
- Three Korean brokerages disagree. Sangsangin Investment & Securities analyst Kim Jin-beom put 220,000 won on the record on May 14, 2026; Daol’s Lee Jung-woo put 190,000 won on July 20; Hanwha Investment & Securities analyst Kwon Ji-woo put 170,000 won on March 18. A five-house average of 205,400 won was showing on August 20, 2026. Every one of those sits far above the current price. I read none of the underlying notes, only Korean secondary coverage of them.
- The first quarter of 2026 contained a one-off. Roughly 5.1 billion won of inventory valuation and provision reversal was flagged in Korean sell-side commentary, which would inflate that quarter’s 5.37 percent margin.
- Leverage rose for reasons I did not investigate. The debt-to-equity ratio went from 62.94 percent at the end of 2025 to 81.42 percent at the end of June 2026, with total liabilities up 241.5 billion won. Some of that may be the borrowing that funded the very working capital build I am worried about, in which case the two observations are one observation counted twice.
- Interest expense is doing something I could not read. First half 2026 interest expense of 17.5 billion won was 46.72 percent below the 32.8 billion won of the prior first half, which does not fit rising debt. On inspection the second quarter of 2025 alone carried 22.4 billion won, an outlier large enough that I stopped using the series. Dropping a line because I cannot read it is not the same as knowing it is unimportant.
When the two statements get compared again
What reading them out of order changed
I have been reading income statements first for as long as I have been keeping these notes, and treating the cash flow statement as confirmation. This company is the case where that ordering would have handed me the wrong year. Anyone reading only the profit line saw 2025 as a weak but profitable year. The cash statement said something closer to what the balance sheet then confirmed, which is that the company financed a build it had not yet converted. I did not catch that because I am careful. I caught it because I happened to open the statements backwards, and I would rather record the accident than dress it up as method.
Related notes where I worked through adjacent questions: on how far a Korean steel margin can compress, Hyundai Steel and the quarter its bar mill carried; on how offshore wind volume converts into reported results, CS Wind into an OBBBA cliff; and on separating money a company earned from money it raised, Taihan Cable and who paid for the backlog.
The third quarter of 2026 is the next time both columns are filled in on the same page. Korean issuers face a statutory filing deadline of November 15 for that period, though this company released preliminary results ahead of the formal filing in each of the last two quarters, so the comparison is likely to be available earlier than the deadline implies.
I will be reading the cash line before the profit line this time, which is a small change in order and, for this particular company, the only methodological thing I got out of the exercise. The 87.55 percent I could not name is still unnamed. If someone opens the same filings and closes that gap, they will have done the part of this work I left undone.
Prices, market value and multiples reflect the August 19, 2026 close of 135,600 won as checked at the time of writing. USD conversions are approximate, at roughly 1,397.7 won per dollar on that same date per Korean financial press, and Financial figures are taken from statutory filings with Korea’s Financial Supervisory Service; ratios and growth rates not stated in those filings are marked as computed by me. Peer figures come from each company’s own results release on the dates given.