Silicon2 Stock: 121 Days of Stock at a Company That Makes None
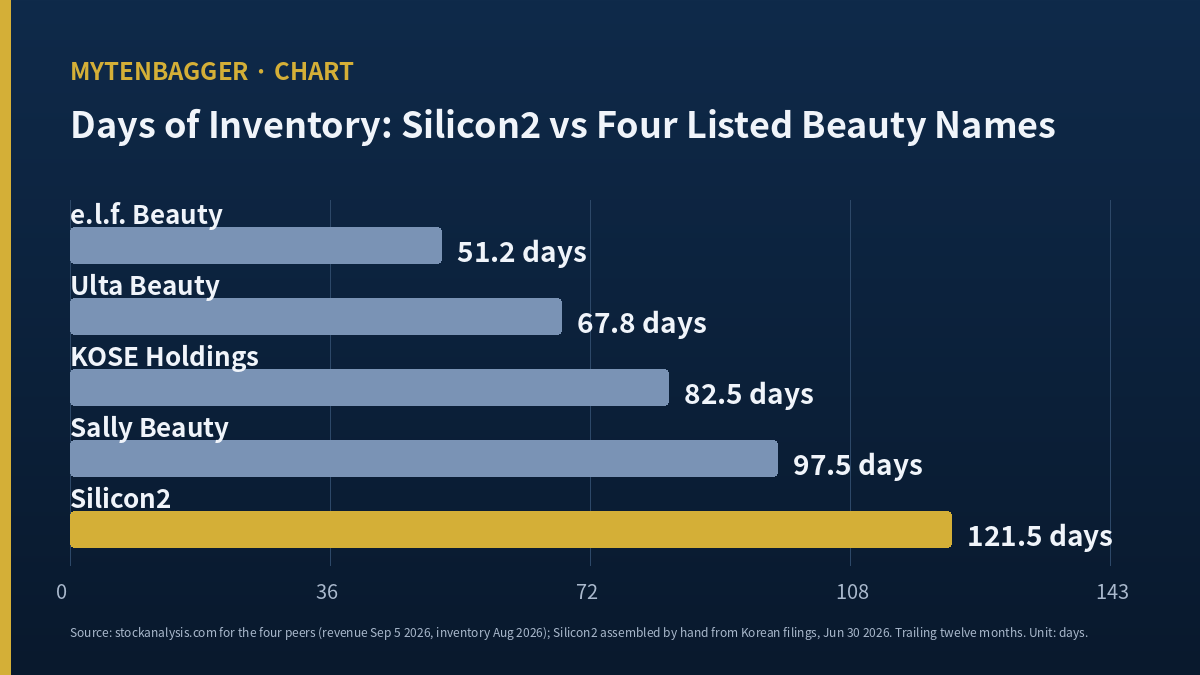
I went looking at Silicon2 stock expecting a light business. The company is a Korean exporter that buys other people’s cosmetics brands and moves them to buyers abroad. It owns no factory that I could find. Yet when I put its inventory next to four listed beauty companies that do own factories or stores, it turned out to hold goods longer than any of them: 121.5 days on my count, against 51.2 days for the fastest. That is the whole piece. Everything below is me working out what the company is buying with those extra days, and where the bill for them shows up.
- Revenue for the June 2026 quarter was KRW 402.6bn (about USD 298m), the largest the company has reported.
- That revenue splits into eight regions. Seven grew. One went backwards.
- The region that went backwards is the region a sell-side note in April had already said would go backwards, and had sized the stranded goods at KRW 30bn.
- Inventory at June 30, 2026 was KRW 451.0bn (about USD 334m), or 46.76 percent of total assets.
- Operating cash flow in that same June quarter was negative KRW 92.4bn (about negative USD 68m), in the best profit quarter the company has ever reported.
Contents
What Silicon2 stock is actually holding
KOSDAQ is Korea’s junior exchange, the venue for smaller and faster-growing listings, and it sits beside the main board KOSPI where the household industrial names trade. This company listed there in 2021. Its business is straightforward to state and awkward to model: it buys Korean cosmetics wholesale, warehouses them, and sells them on to retailers and consumers abroad through its own platform and through third-party marketplaces. What it reports is buying, warehousing, fulfilment and resale; I found no manufacturing operation of any scale in what I read, which is what the title of this piece is leaning on. The balance sheet is therefore mostly working capital, and the largest single line on it is goods waiting to be sold.
At June 30, 2026 that line was KRW 451.0bn, roughly USD 334m at the exchange rate I use throughout this piece. Total assets were KRW 964.5bn. So 46.76 percent of everything the company owns is unsold product, and it equals 65.46 percent of consolidated equity. Four years earlier, at the end of 2022, the same line was KRW 28.6bn. The five year-end figures I pulled from the filings run KRW 28.6bn, KRW 78.5bn, KRW 145.9bn, KRW 300.1bn, and then the June 2026 half-year figure of KRW 451.0bn. From the first to the last is 15.77 times.
Revenue grew too, of course, so the absolute figure by itself proves nothing. The question is whether goods are moving through faster or slower than they used to, and that requires a measure I can apply the same way to everyone.
Eight regions in one quarter, and the one that went backwards
Before the peer table, the revenue split, because it is where the inventory question gets its edge. A Korean broker note carried by Etoday on August 14, 2026 (Fri) laid out the June 2026 quarter by region. I have converted each figure at the same rate and checked that the eight add back to the reported quarterly revenue, which they do exactly.
| Region | KRW bn | USD m | Share | Year on year |
|---|---|---|---|---|
| Europe | 173.4 | 128.4 | 43.07% | +62% |
| North America | 87.3 | 64.6 | 21.68% | +79% |
| Asia | 57.5 | 42.6 | 14.28% | +29% |
| Middle East | 26.0 | 19.3 | 6.46% | -7% |
| South America | 24.4 | 18.1 | 6.06% | +76% |
| Russia and CIS | 22.4 | 16.6 | 5.56% | +75% |
| Oceania | 7.9 | 5.9 | 1.96% | +18% |
| Africa | 3.7 | 2.7 | 0.92% | +24% |
Seven of eight grew by between 18 and 79 percent. The Middle East fell 7 percent, and it is the only line in the table with a minus in front of it.
Now the part that made me stop. On April 1, 2026 (Wed), months before this quarter closed, a Yuanta Securities analyst named Lee Seung-eun published a note on the company. I read that note in full, which is unusual for me here, and it carried a KRW 56,000 number for the stock. Buried in the risk section was a specific and unhedged forecast: Middle East logistics were being disrupted by regional conflict, the company was carrying roughly KRW 30bn of goods tied to that region, and the analyst expected the region to shrink over the full year. Four and a half months later the reported figure for that region came in at minus 7 percent while everything else compounded.
So the KRW 30bn of stranded goods is not a hypothetical. It is roughly 6.7 percent of the June 2026 inventory balance, sitting in the only region that is not growing. I want to be precise about what that does and does not show. It does not show that inventory overall is bad. It shows that at least one identifiable slice of it has been slow for a reason that was visible in advance, and that the company chose to hold it anyway.
Silicon2 stock against four companies that also carry goods
Here is my peer table. I built it around one column, inventory days, and I computed that column myself for all five rows using the same formula so the comparison means something: trailing twelve month revenue divided by the closing inventory balance, then 365 divided by the result.
I did not use the inventory turnover figure printed on the data vendor’s own pages, even though it was available for all four peers, because that figure is built on cost of goods sold and I do not have a reliable cost of goods line for the Korean company. Mixing the two would have produced a table where one row was measured differently from the rest. The cost is that my numbers will not match the vendor’s for the four peers. The benefit is that all five rows are the same arithmetic.
| Company | Revenue (TTM) | Inventory | Days of inventory | Source and as-of date |
|---|---|---|---|---|
| e.l.f. Beauty (NYSE ELF) | USD 1.76bn | USD 247m | 51.2 | stockanalysis.com, revenue Sep 5 2026, inventory Aug 5 2026 |
| Ulta Beauty (NASDAQ ULTA) | USD 12.96bn | USD 2.41bn | 67.8 | stockanalysis.com, revenue Sep 5 2026, inventory Aug 27 2026 |
| KOSE Holdings (TYO 4922) | JPY 334.6bn | JPY 75.6bn | 82.5 | stockanalysis.com, revenue Aug 22 2026, inventory Aug 17 2026 |
| Sally Beauty (NYSE SBH) | USD 3.73bn | USD 996m | 97.5 | stockanalysis.com, revenue Sep 5 2026, inventory Aug 3 2026 |
| Silicon2 (KOSDAQ 257720) | KRW 1.354tn | KRW 451.0bn | 121.5 | assembled by hand from Korean filings, Jun 30 2026 |
Three things about this table are worth saying out loud before anyone leans on it.
First, I did not convert any of the four currencies. Running yen and dollars and won through one exchange rate to make the revenue column comparable would add error and remove nothing. Revenue here is a size indicator, and the column that carries the argument is a ratio, which is currency-neutral by construction.
Second, the as-of dates in the last column are not aligned, and they are not even aligned within a single row. For every peer, the revenue figure and the inventory figure were last refreshed on different days, up to twenty-four days apart for Ulta. KOSE is the stalest on both counts. I have printed each date so the spread stays visible, and did not hide it behind a single “as of September” line.
Third, the bottom row is the only one I built myself. The data vendor has no page for this company at all. I tried the KOSDAQ quote path and the overview path and both returned 404, which is consistent with what I have found for other Korean junior-market listings. So I summed four quarters of revenue from the filings and took the inventory balance off the June 30 statement.
Two ways to count the same days, and why I show both
My 121.5 days is not the only number available. The Korean data screen I also use reports inventory days of 101.9 for the same company on the same balance sheet date. Neither is wrong. They divide by different things.
The screen takes the closing inventory, divides by one quarter’s revenue, and multiplies by 91. I take the closing inventory, divide by four quarters of revenue, and multiply by 365. The June quarter was the largest in the company’s history, running 1.189 times the average of the trailing four. Annualising off that single quarter therefore flatters the ratio, and 101.9 multiplied by 1.189 gives 121.2, which is my figure to within rounding.
I use the trailing-twelve-month version because it is the one that matches how the four peer rows are built. If someone prefers the quarterly version, the company still sits behind Sally Beauty on that basis, just by less. The ordering in the table does not change; the distance does.
The quarter Silicon2 stock earned most and lost most cash
The June 2026 quarter produced the largest profit in the company’s history and the largest cash outflow in its history, and those two facts are the same fact seen from two statements.
Operating cash flow by quarter, taken from the filings and stated as discrete quarters: the March 2026 quarter was positive KRW 105.9bn (about USD 78m), and the June 2026 quarter was negative KRW 92.4bn (about negative USD 68m). The swing between them is KRW 198.3bn. For the half year the cumulative figure is only positive KRW 13.5bn (about USD 10m). Capital expenditure over the same six months was KRW 32.0bn, so free cash flow for the half was negative KRW 18.6bn.
Inventory rose 50.26 percent over those six months. That is the answer to where the cash went, and it is not a mystery so much as a decision. A distributor that wants to serve large Western retailers has to hold goods before the order arrives, because those buyers do not wait. Korean broadcaster IFM reported on June 11, 2026 (Thu) that the company described the build as pre-emptive, made against price increases and regional risk. The same report noted short-term borrowings rising from KRW 22.7bn to KRW 67.7bn and flagged lengthening settlement terms and slower inventory turns.
When I looked at APR Corporation, a Korean beauty device maker whose record quarter did not bring cash with it, the inventory build turned out to be product already spoken for, and the following quarter’s revenue confirmed it. That was a manufacturer pre-building its own goods. This is a middleman pre-buying somebody else’s. The manufacturer’s downside is unrecovered cost; the middleman’s downside is the full purchase price, and the middleman also loses the right to buy at all if the brand decides to distribute directly.
I built the table before I checked whether it added up
An admission about process, because it changes how much weight the regional section above deserves.
I laid out the eight regional revenue figures, converted them, computed each share, and wrote the paragraph about the Middle East before it occurred to me to add the eight numbers together and compare the total against the reported quarterly revenue line. When I finally did, they matched exactly. KRW 402.6bn from the sum, KRW 402.6bn from the income statement.
That was luck. If a broker’s regional table had been drawn on a different revenue definition, or had excluded a small category, or had been reported on a non-consolidated basis, the shares I had already computed would have been wrong and I would have had no way of noticing, because each individual share would still have looked plausible. The check that would have caught it took nine seconds and I ran it last.
I have adopted the obvious rule for next time, which is to sum any breakdown against its own total before doing anything else with it. What I cannot fix retroactively is the ordering of my confidence. I believed the paragraph before I had earned the right to.
Eighteen quarters of revenue under Silicon2 stock
The inventory build did not come from nowhere. Quarterly revenue went from KRW 35.3bn (about USD 26m) in the March 2022 quarter to KRW 402.6bn in the June 2026 quarter, which is 11.41 times across eighteen reported quarters. Trailing twelve month revenue as I sum it is KRW 1.354tn, roughly USD 1.00bn.
Growth of that speed is exactly why the inventory ratio deserves care without alarm. A company doubling its volumes every eighteen months will always look slow on any ratio that puts a closing balance over a trailing average, because the balance is sized for the volume just ahead while the figure it is divided by comes from the volume behind. Some of my 121.5 days is that effect and not a deterioration.
What the growth effect cannot do by itself is settle the ordering, and here I have to stop short. I did not pull revenue growth rates for the four peers. Without them I cannot say the table sorts by growth, and I cannot say it does not. What I can say is that the effect is a reason to hold the 121.5 days loosely, and that anyone wanting to dismiss the figure on growth grounds needs the four growth rates I did not collect.
What owning Silicon2 stock from a US account requires
There is no American depositary receipt for this company that I could find. I did not verify whether any specific fund holds it. The regional revenue split I built this piece on reached me through a Korean news report of a Korean broker note, two removes from the company.
One more practical point specific to this name. When I wrote about Amorepacific and the peer group split by a 23-point gap in returns on equity, the difficulty was that the comparison set was internally incoherent. Here the difficulty is the opposite and simpler: the company is absent from the English-language screens entirely, so there is no incoherent comparison to argue with. There is nothing at all until someone assembles it.
Numbers I left out of this Silicon2 stock note
Cost of goods sold and gross margin
A Korean broker note put the June quarter cost ratio at 68.0 percent, down two percentage points from the prior quarter. I did not carry that into the peer table. The four peer gross margins on the vendor pages range from 43.1 to 71.6 percent and are computed on their own reporting conventions, and I could not establish that a Korean distributor’s cost ratio is measured over the same set of expenses. A margin column built on that uncertainty would have looked authoritative and meant little.
Market value of the peers
I collected it and then dropped the column. Size does not bear on how long goods sit, and including it would have invited the reader to rank the five rows by something the table is not measuring. For orientation only: this company’s market value on September 4, 2026 (Fri) was about USD 2.33bn. I have deliberately not ranked the five by size, because the peer values sit in three currencies and I said at the outset that I would not convert them.
Twelve places this reading could be wrong
- My inventory days formula uses revenue where the conventional one uses cost of goods. The conventional ratio uses cost. My version is internally consistent across five rows but is not the textbook measure, and it will read differently from any figure a reader looks up elsewhere.
- Closing balances, with no averaging. Using period-end inventory penalises any company whose balance happened to peak on the reporting date. For a business this seasonal that is a real risk in both directions.
- The as-of dates are ragged. Two of the peer inventory figures are over a month older than their revenue figures. A month is meaningful when balances are moving 50 percent in six months.
- Four peers is a small set, and none of them is a pure cross-border wholesaler. I chose them because they carry physical beauty inventory, which is the property the table is testing, but the business models differ underneath.
- KOSE showed conflicting figures on two pages of the same vendor site, differing by about JPY 42bn on market value. I used the statistics page consistently and did not use the market value at all. A vendor that disagrees with itself on one field may disagree on others.
- The regional split came from a news report of a broker note. I did not see the company’s own segment disclosure. The totals reconcile to the reported revenue line, which is reassuring but not the same as reading the primary document.
- The KRW 30bn of Middle East goods is an April estimate from one analyst and was never a disclosed figure. I have no way to know what that balance is now.
- A forecast that came true is not a forecast that was well made. Regional conflict was widely reported in April; predicting disruption from it was not a difficult call, and I should not treat one correct call as evidence that the rest of that note is right.
- Trade policy is outside the company’s control. Segye Ilbo reported on July 25, 2026 (Sat) a 12.5 percent US tariff covering Korea, quoting a Soongsil University professor to the effect that consumer goods are price-sensitive enough that even 2.5 additional points matters. The same report carried an industry view that the burden is manageable. I did not size this.
- Customer concentration has already bitten once this year. Hankyung Business reported in February 2026 that the largest customer, which had been just under a quarter of revenue in the September 2025 quarter, moved to distributing on its own. If a brand can leave, the goods bought for it become goods bought for nobody.
- The capital structure is about to change. A KRW 300bn third-party issue of redeemable convertible preferred shares was disclosed on August 18, 2026 (Tue), with payment due September 15, 2026 (Tue). Every per-share and per-equity figure in this piece predates that money.
- The strongest counter to my own framing: a distributor that has to hold more goods to win larger accounts is buying market position, and the peer table cannot tell the difference between that and goods nobody wants. My ratio is agnostic on the question that actually matters.

Prices and ratios reflect the September 4, 2026 (Fri) Korean close as checked at the time of writing; September 5 and 6 were non-trading days, so this is the prior business day. USD conversions are approximate, at roughly KRW 1,350.4 per dollar on that same date, and the Korean won is the reference currency throughout. Financial figures come from the company’s Korean regulatory filings, half-year report receipt number 20260814003895. Consolidated balance sheet totals were cross-checked against an independent screen. Peer figures come from stockanalysis.com company pages with the as-of dates printed in the table. The April 1, 2026 broker note was read in full as a published PDF; the other Korean broker material reached me through news reports, which I have named where used. Consensus and share count are from the WiseReport company page as displayed on September 4, 2026 (Fri).