Sun Kwang Earnings: Net Profit Rose 2.7x on 11% More Sales
Sun Kwang earnings are the reason I opened this file at all: net profit in 2025 was KRW 39.48bn, about 2.7 times the KRW 14.69bn of 2022, while revenue rose just 10.6 percent over the same three years. By my own decomposition, a little under 60 percent of that profit gain came from the operating line and the rest came from below it. I do not own the stock, and after taking the income statement apart I am watching it from the outside.
- KRW 190.42bn: 2025 revenue (2022: KRW 172.14bn).
- KRW 39.48bn: 2025 net profit (2022: KRW 14.69bn).
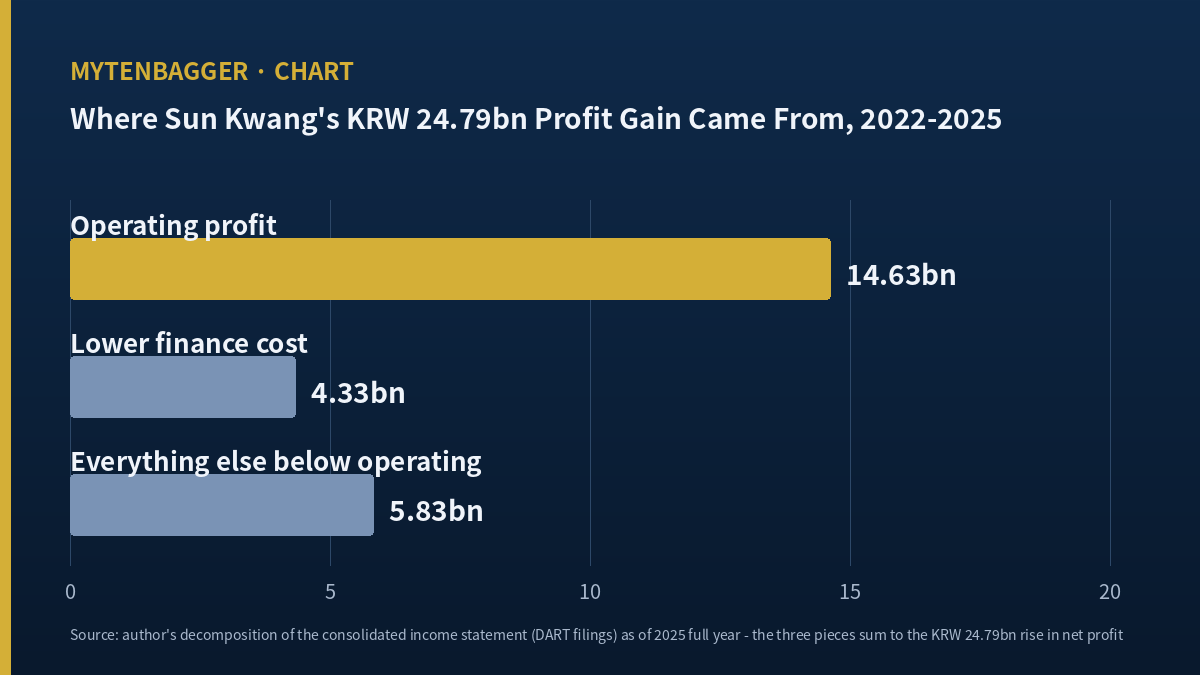
- KRW 24.79bn: the three-year increase in net profit.
- 59.0%: the portion of that increase that came from higher operating profit.
- 17.5%: the portion that came from a finance-cost line falling from KRW 11.14bn to KRW 6.81bn.
- 64.4%: the jump in April-to-June 2026 operating profit on 9.2% more revenue.
- USD 99.5M: market value at the September 29, 2026 close.
- Where I stand: not holding, watching, because the lines under operating profit are about to change.
Sun Kwang (KOSDAQ: 003100) is a port logistics company founded in 1948. KOSDAQ is Korea’s secondary exchange, where most smaller and mid-sized companies list. The company unloads and stores imported grain in silos at Incheon and Gunsan, and a subsidiary runs a container terminal at Incheon New Port. At the September 29 close of KRW 20,450 per share, the equity was worth about USD 99.5M.
Contents
Sun Kwang Earnings Over Four Years
I started with four annual income lines from the company’s consolidated DART disclosures, as compiled by the luxrix financial tool. DART is Korea’s electronic disclosure system, the rough equivalent of EDGAR. All figures are in KRW bn.
| Year | Revenue | Operating profit | Finance cost line | Net profit |
|---|---|---|---|---|
| 2022 | 172.14 | 26.76 | 11.14 | 14.69 |
| 2023 | 185.30 | 39.09 | 11.20 | 29.84 |
| 2024 | 186.75 | 36.37 | 8.96 | 28.30 |
| 2025 | 190.42 | 41.39 | 6.81 | 39.48 |
Source: luxrix financial tool (DART, consolidated, KRW bn). The finance cost line is the tool’s interest field; the tool falls back to total finance costs when a company does not report interest expense separately, and I have not confirmed which applies here.
Revenue barely moved: from KRW 172.14bn to KRW 190.42bn, up 10.6 percent in three years. Operating profit rose 54.7 percent. Net profit went up 2.7 times. Three lines, three very different growth rates, and the gap between the last two is what this piece is about.
The big step came in 2023. That year operating profit climbed from KRW 26.76bn to KRW 39.09bn on revenue up only KRW 13.16bn. Since then the operating line has not repeated that jump (KRW 36.37bn in 2024, KRW 41.39bn in 2025), while net profit kept climbing toward the operating figure.
Taking the Sun Kwang Earnings Gain Apart
Net profit grew by KRW 24.79bn from 2022 to 2025. I split that into three pieces, all by my own arithmetic on the table above:
Operating profit: KRW 14.63bn, or 59.0%
This is the part that comes from the business itself: handling more cargo at better prices or at lower cost. It is the largest piece, and it is real. But it carries less than two thirds of the gain.
A smaller finance cost: KRW 4.33bn, or 17.5%
The finance cost line fell from KRW 11.14bn to KRW 6.81bn. Less interest paid means more profit kept, with no change in how many tons of grain crossed the quay. This piece depends on debt levels and rates, and debt levels are now moving the other way, as I explain below.
Everything else below operating profit: KRW 5.83bn, or 23.5%
This is the residual after the first two, so it lumps together tax, equity-method income from associates and other non-operating items. I cannot split it further from the tools I used. What I can say is that nearly a quarter of the net profit gain did not come from moving cargo.
Put together, the income line tells me Sun Kwang earnings improved on three engines at once, and only one of them is volume or pricing. That matters for anyone extrapolating the 2025 figure, because the other two engines are the ones most exposed to the company’s current spending plans.
Sun Kwang Earnings From April to June 2026: The Same Pattern, Louder
The most recent three-month period repeats the story. Revenue from April to June 2026 was KRW 51.65bn against KRW 47.29bn a year earlier, up 9.2 percent. Operating profit was KRW 12.35bn against KRW 7.51bn, up 64.4 percent. Net profit was KRW 13.38bn against KRW 7.66bn, up 74.6 percent. In that period net profit was higher than operating profit, which tells me something below the operating line added money.
I had a similar exercise with CJ Logistics, where parcel volume and profit went in opposite directions and I ended up with three estimates of one price change. Sun Kwang is the mirror problem: one profit number, three sources underneath it.
To see whether that jump is a new level or a bounce, I laid out ten consecutive three-month periods. The figures for October to December are derived by subtracting nine-month cumulative totals from the annual numbers, which is how the luxrix tool builds them.
| Period | Revenue (KRW bn) | Operating profit (KRW bn) |
|---|---|---|
| 2024 Jan-Mar | 44.23 | 8.46 |
| 2024 Apr-Jun | 47.31 | 8.45 |
| 2024 Jul-Sep | 47.01 | 9.94 |
| 2024 Oct-Dec | 48.20 | 9.53 |
| 2025 Jan-Mar | 45.95 | 9.89 |
| 2025 Apr-Jun | 47.29 | 7.51 |
| 2025 Jul-Sep | 47.99 | 12.53 |
| 2025 Oct-Dec | 49.20 | 11.46 |
| 2026 Jan-Mar | 44.32 | 10.58 |
| 2026 Apr-Jun | 51.65 | 12.35 |
Source: luxrix financial tool (DART, consolidated). October-December rows are derived from annual minus nine-month totals.
Two things stand out. Revenue stayed between KRW 44.23bn and KRW 51.65bn for all ten periods, so the business does not grow in steps; it grinds. Operating profit moved more, from KRW 7.51bn to KRW 12.53bn. And the year-ago comparison for the latest period is the weakest operating result of the ten. That flatters the 64.4 percent figure. Measured against April to June 2024 instead, operating profit is up about 46.2 percent over two years, still a strong number and a more honest one.
Adding the latest four periods together gives revenue of KRW 193.16bn and operating profit of KRW 46.91bn for the twelve months to June 2026, both above the 2025 calendar year. So the improvement is not a single good season. Operating profit has been above KRW 10bn in each of the last four periods, something that did not happen once in the six periods before them.
For a US reader, those twelve-month figures convert to roughly USD 142.4M of revenue and USD 34.6M of operating profit. Against a market value of about USD 99.5M, the company trades at about 0.7 times trailing sales. That low multiple is the first thing most screening tools will show, and it is the reason I dug further before believing it. A company that turns about 24 percent of its twelve-month revenue into operating profit (my calculation on the figures above) and still trades that low usually has a reason sitting somewhere in the numbers, and in this case I think the reason is the spending that is about to hit the lines below operating profit.
For a company spending heavily on physical assets, I also looked back at Pan Ocean, whose tanker orders run into a wave of new ships in 2028. Different business, similar question: what the income line looks like in the year the new assets arrive.
Over the full January-to-June period the finance cost line was KRW 3.00bn against KRW 3.71bn a year earlier. That fell even though the company was borrowing more during 2026 to pay for construction. I can think of two explanations and I cannot choose between them from the public numbers: lower rates on the loans, or some of the interest on construction borrowing being capitalized into the asset being built. Under IFRS, borrowing costs tied to a qualifying asset under construction are added to the asset’s cost (IAS 23, IFRS Foundation). If that is happening, the income line looks better today and the cost shows up later as depreciation.
My first guess about the April-to-June jump was that new capacity had started contributing. That was wrong on timing. The big project, an automated grain terminal in Dangjin (South Chungcheong province) with a budget larger than three quarters of the company’s equity, is still being built; Korean press put its end date at 2027. So the jump came from the existing silos and terminal. That is good news about the current business and no news at all about the new one.
I had also assumed, without checking, that a port operator this size lives or dies on tonnage. The ten-period table above talked me out of that. Revenue barely moves from one season to the next, so the story of this company over the past three years sits in costs and in the lines under operating profit. I spent more time on the finance cost line than on any volume figure, which is not where I expected to end up when I opened the file.
A Grain Peer That Went the Other Way
The closest listed business I could find is GrainCorp (ASX: GNC), an Australian grain storage, handling and marketing company. It is much larger and far more exposed to harvests and grain trading than Sun Kwang, which describes its own business as unloading, storage and transport services for imported cargo. I picked it because it is a grain storage operator whose profit fell in its latest six-month period, the opposite of what happened at Sun Kwang.
For the six months to March 31, 2026, GrainCorp reported underlying EBITDA of A$136 million against A$202 million a year earlier, and net profit after tax of A$5 million against A$58 million (The Motley Fool Australia, May 14, 2026; IndexBox). It kept full-year guidance for underlying EBITDA of A$200-240 million, and the same report said total grain handled on the Australian east coast slipped to 26.5 million tonnes. I leave those figures in Australian dollars and do not compare them with Sun Kwang’s margins, because the two companies define and report their profit lines differently.
What the comparison does tell me is where the risk sits. GrainCorp’s profit swings with crop size and grain prices. Sun Kwang’s recent revenue has been steadier, which fits a company paid for handling and storage services instead of owning the grain it moves. That steadiness is part of why the new Dangjin terminal makes sense to management, and it is also why I care more about the lines below operating profit than about volume.
Why Sun Kwang Earnings Could Look Different by 2028
Two construction projects sit behind the income line. The first is the Dangjin grain terminal. The second is a one-fifth stake, bought in two payments in March and July 2026, in Incheon Global Container Terminal, a new company set up to run a fully automated berth at Incheon New Port that is due to open in August 2028 (Kyeongin Ilbo, Korean press, April 19, 2026). Neither earns anything yet.
The terminal stake matters for the income line in a specific way. Because Sun Kwang holds a minority position, the new company will not be consolidated. Its profit or loss will appear as a single equity-method figure below operating profit. If the new terminal runs at a loss while volume builds, which I cannot rule out from anything I read, the residual piece that added KRW 5.83bn to the 2022-2025 gain could start subtracting instead. I have no forecast for that figure, and none of the public sources I read offers one.
When they do start, three lines will move at once. Depreciation will rise as the Dangjin assets go into service, which pushes operating profit down before the new volume fills in. Interest that may be capitalized today will pass through the income line. And the associate stake will add or subtract equity-method income below operating profit, the same residual piece that supplied nearly a quarter of the 2022-2025 gain. Put simply, the two engines that did not come from moving cargo are the two most likely to change.
Sun Kwang Earnings: Three Paths and What Would Break My View
No brokerage I could find publishes estimates on this company, and the consensus line on the earnings page I checked was empty, so the probabilities below are my own guesses on public numbers.
Steady operating line, weaker lines below it (about 45%)
The silos and terminal keep earning roughly what they did in 2025, but the finance cost line rises as construction borrowing grows and capitalization ends. Net profit drifts back toward the low KRW 30bn area even as the business holds up. In this path the twelve-month operating profit stays in the mid-40s (KRW bn), and the gap between operating and net profit widens again, the reverse of what happened from 2022 to 2025.
April-to-June strength carries through (about 35%)
The 64.4 percent jump in operating profit proves durable, and it more than covers higher finance costs. Net profit in 2026 comes in above the 2025 level. For this to happen, July to September needs to look like the KRW 12.35bn of April to June and stay well clear of the KRW 9.94bn of the same season in 2024.
Construction drag shows early (about 20%)
Delays or cost overruns at Dangjin push up borrowing faster than planned, and depreciation starts before volume arrives. This is the path where the income line looks worst in 2027. The early sign would be a finance cost line that stops falling well before any new revenue appears.
What would change my mind, in the order I expect to learn it:
- The third-quarter report, due by November 16 (Mon), 2026: whether July-to-September operating profit stays above KRW 12bn. A figure back near KRW 10bn would tell me April to June was the high point of the cycle and the two-year comparison is the one to trust.
- Whether the finance cost line for January to September exceeds the prior year’s level, which would suggest capitalization is ending or rates are biting.
- Any disclosure of capitalized borrowing costs, which would let me separate the two explanations above. The annual report notes usually carry this, so the 2026 annual report is the latest point where I expect an answer.
- The first equity-method result from the container terminal stake, since it shows up in the same residual piece that drove 23.5 percent of the gain.
The Case Against My Caution
I want the other side written down as carefully as my own view.
- The operating line alone is strong. Even if I strip out everything below it, operating profit rose 54.7 percent in three years on almost flat sales, which says the existing assets are well run.
- The April-to-June jump is the largest year-on-year gain in operating profit since October-December 2023 among the three-month figures I checked, and it came before any new capacity.
- Management told Korean press that grain import volumes are stable from year to year (eToday, Korean press, January 14, 2025), which lowers the risk that the new terminal sits idle.
- The controlling family reshuffled its holdings in July among related companies at a price close to the market, with the group’s combined stake staying at about 58.5 percent (Edaily, Korean press, July 10, 2026). That keeps control stable during construction.
- At about USD 99.5M, the market value is roughly 3.4 times 2025 net profit converted at the same rate (USD 29.1M), a low multiple even after I set aside the below-the-line gains.
- The finance cost line may keep falling if rates ease, which would extend the second engine instead of reversing it.
- Revenue has held between KRW 44bn and KRW 52bn in every three-month period since early 2024. A business that predictable can carry construction debt more comfortably than its size suggests, because lenders and management can plan around a stable income stream.
Where I Leave It
I came to this company because the headline profit growth looked too good for a port operator with flat sales. After splitting it, I think the growth is real but mixed: the business improved, and debt costs and other items did a lot of the rest. The next two years will test exactly those other items, because both construction projects feed into them.
So my note to myself is short. I will open the November report to the finance cost line before I look at revenue. If that line is still falling while borrowing rises, I want to know why before I believe the 2025 profit is the new normal.
Prices reflect the September 29, 2026 close. Dollar figures are approximate, at roughly KRW 1,356.7 per dollar on the same date. Financial figures are consolidated, taken from DART disclosures through the June 30, 2026 period as compiled by the luxrix tool; three-month figures are derived by subtracting cumulative totals.