S1 Corporation Stock: The Payout Promise Needs a Better Year
Four listed security companies, four dividend yields. SECOM in Tokyo pays 1.86 percent. ADT in New York pays 2.79 percent. Securitas in Stockholm pays 3.41 percent. And S1 Corporation stock, listed in Seoul under the ticker 012750, pays 4.43 percent while trading at the lowest price-to-book of the group. I started this session wanting to know why the Korean name sits at the top of that column, and I finished it having moved the stock out of my dividend bucket.
The budget line, three rows
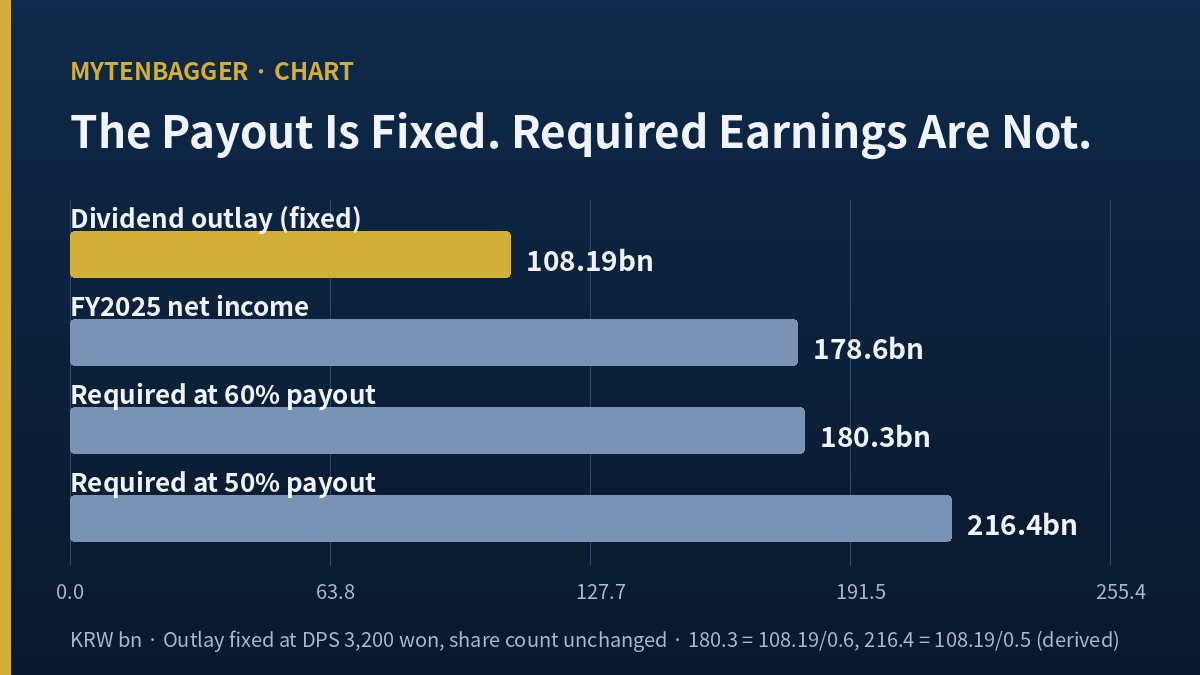
Cash the company actually sends out at ₩3,200 per share, fixed: ₩108.19 billion (disclosed to the won on March 19, 2026)
Net income needed for that cash to sit inside the company’s own 60 percent ceiling: ₩180.3 billion (my calculation)
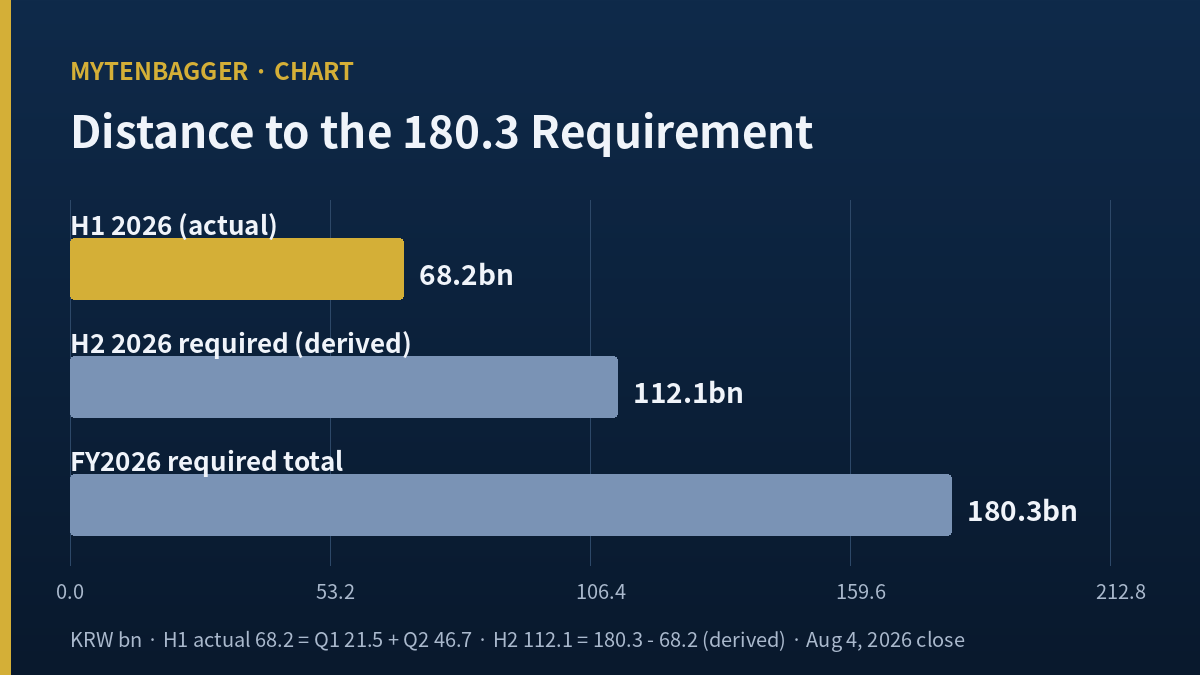
Net income S1 Corporation actually produced in 2025: ₩178.6 billion. First half of 2026: ₩68.2 billion
The required figure sits above last year’s result. That is the whole article in one line, and everything below is me checking that I did the division correctly and then asking what the company can do about it.
One admission before the numbers. I have screened for dividend yield for years and I had never once divided a payout ratio myself. I took the figure off the vendor screen and moved on. When I finally did the arithmetic on this name, the screen and the company’s own filing disagreed by more than seven percentage points, and the reason turned out to be structural rather than a rounding difference.
Contents
Where the S1 Corporation Stock Yield of 4.43% Comes From
S1 Corporation is a physical security and facility management company majority-associated with the Samsung group, listed on the KOSPI, which is Korea’s main board and the venue for its largest capitalisations. It is not a small company by domestic standards and not a large one by global ones: a market capitalisation of ₩2.75 trillion, roughly $1.9 billion.
| Metric | Value | Note |
|---|---|---|
| Close | ₩72,300 (about $50.6) | August 4, 2026 |
| Market capitalisation | ₩2.75 trillion (about $1.9bn) | 37,998,617 shares issued |
| P/E, P/B, P/S | 15.39, 1.44, 0.95 | Kiwoom trailing basis |
| Book value per share | ₩50,319 | 72,300 ÷ 50,319 = 1.44, so P/B checks against the close |
| Dividend per share, FY2025 | ₩3,200 (about $2.24) | Resolved January 29, 2026 |
| Dividend yield | 4.43% | 3,200 ÷ 72,300, my calculation |
| Operating and net margin | 8.12% and 6.18% | FY2025 consolidated |
| Debt to equity | 45.81% | Interest coverage 33.7x |
| Foreign ownership | 55.65% | Margin balance 0.01% |
Foreign ownership above 55 percent on a Korean mid-cap is unusual and it matters to the argument later. This is not a name that domestic retail money has bid up. It is a name that overseas institutions have held for the cash it distributes.
Which close I am using, and why it is not today’s
I write these entries in the small hours of Korean time, so the most recent settled price available to me is the previous session. August 5, 2026 is a Wednesday in Seoul, which makes the last completed trading day Tuesday, August 4. Every price in this piece is that close. The price path also depends on where you start the clock: up 1.26 percent over twelve months, down 15.54 percent over three, and down 29.81 percent (my calculation) from the ₩103,000 intraday high of the last 250 sessions. I am not picking one of those as the headline number, because the high was printed once inside the window and the stock is currently lying flat on its 20-day and 60-day averages.
The Band the Company Wrote for Itself in March
On March 19, 2026 the company filed what Korean regulators call a corporate value-up plan, a voluntary disclosure in which a listed issuer states its shareholder-return intentions. According to the Korean-language summary published by Digital Today, S1 said it would keep the FY2026 payout ratio in a band of 50 to 60 percent, and disclosed that the prior year’s ratio had been 60.6 percent. It also gave the total dividend amount to the won: ₩108,192,764,800 for the latest year and ₩91,287,645,300 for the year before, an increase of 18.5 percent.
Those two totals turned out to be the most useful numbers in the filing, because they can be divided.
₩108,192,764,800 divided by ₩3,200 per share gives 33,810,239 shares, with no remainder at all. I ran the prior year as a check: ₩91,287,645,300 divided by ₩2,700 gives 33,810,239 shares, again exactly. The same count twice, to the single share, which tells me the dividend-bearing share base did not move between the two record dates. That is also why the total-dividend growth of 18.5 percent equals the per-share growth (3,200 ÷ 2,700 − 1 = 18.52 percent).
But the issued share count is 37,998,617. The gap is 4,188,378 shares, or 11.02 percent of shares issued (my calculation). Treasury stock does not receive a dividend, so that gap measures the block the company is holding off the distribution list. I have not seen that figure printed anywhere, in Korean or in English, even though it falls out of two lines in a public filing.
It also explains a discrepancy I would otherwise have carried into the article. My indicator screen shows a payout ratio of 68.1 percent. Multiply ₩3,200 by all 37,998,617 shares and you get ₩121.6 billion; divide by FY2025 net income of ₩178.6 billion and you get 68.08 percent, which matches the screen. So the error was not in the denominator, where I usually find these problems. It was in the numerator, which had counted the treasury block as if it collected a cheque. The company’s 60.6 percent is the right figure, and the ₩108.19 billion behind it is the cash that actually leaves the building. When I looked at a Korean brokerage with the sector’s top dividend yield earlier this summer, the same division did not change the conclusion, because that issuer’s treasury position was nowhere near this size.
What the S1 Corporation Stock Dividend Requires in Net Income
Here is the mechanical part. The ₩108.19 billion cash outflow is fixed as long as the dividend stays at ₩3,200 and the dividend-bearing base stays at 33,810,239 shares. The denominator of the payout ratio, net income, is not fixed. So the earnings level the company needs in order to honour its own band is a single division.
| Condition | Net income required | Arithmetic |
|---|---|---|
| To land on the 60% ceiling | ₩180.3bn | 108.19 ÷ 0.6, my calculation |
| To land on the 50% floor | ₩216.4bn | 108.19 ÷ 0.5, my calculation |
| Reference: FY2025 actual | ₩178.6bn | Consolidated net income |
| Reference: H1 2026 actual | ₩68.2bn | Q1 ₩21.5bn plus Q2 ₩46.7bn |
FY2025 net income of ₩178.6 billion falls ₩1.7 billion short of the ceiling condition. That is precisely why the disclosed ratio came in at 60.6 percent, a shade above the band the company was about to publish. Read plainly: the company did not fit inside its own band using last year’s earnings. I do not take that as evidence the band was reckless. I take it as evidence that the current dividend already sits on the outer edge of it.
I confirmed the ₩178.6 billion figure two separate ways before building anything on it. The Kiwoom indicator set carries FY2025 consolidated net income at ₩178.6 billion, and working backwards from the disclosed ₩108.19 billion payout at the disclosed 60.6 percent ratio gives ₩178.53 billion. Two unrelated sources meeting at the same hundred million won is about as much comfort as a derived figure gets.
It is worth putting the full prior year on the table too, because 2025 was not a weak year. Consolidated revenue was ₩2,889.4 billion and operating profit ₩234.5 billion, the latter up 12.1 percent on 2024, as reported by the Korean business press when the results and the dividend were resolved together in late January. The dividend history has the same upward shape: ₩2,500 for FY2022, ₩2,700 for FY2023 and FY2024, then ₩3,200 for FY2025, according to the regulatory filings compiled in Korea’s electronic disclosure system. So the payout ratio did not drift above the band because earnings collapsed. It drifted because the dividend was raised 18.5 percent in a year when net income did not rise nearly that fast, and the ratio simply followed the two lines apart.
What the First Half Did to S1 Corporation Stock
The two quarters of 2026 so far have almost nothing in common.
| 2026, consolidated | Revenue | Operating profit | Net income |
|---|---|---|---|
| Q1 | ₩673.7bn (−0.1%) | ₩20.7bn (−62.4%) | ₩21.5bn (−48.8%) |
| Q2 | ₩723.1bn (−1.3%) | ₩64.4bn (+4.6%) | ₩46.7bn (−10.4%) |
| H1 total | ₩1,396.8bn | ₩85.1bn | ₩68.2bn |
Operating profit fell 62.4 percent in the first quarter. The company attributed it to retirement benefit costs booked after a lawsuit over average-wage calculation, a category of Korean labour litigation that has hit several large domestic employers. The Korean trade press carried that explanation without a figure attached to the charge, so I cannot size it, and I have not assumed it is finished.
The second quarter reversed the shape. Revenue fell 1.3 percent while operating profit rose 4.6 percent, gross margin moved from 23.3 to 24.2 percent and operating margin from 8.4 to 8.9 percent, according to segment detail reported by Bloter. A quarter in which the company sold less and kept more.
Net income still fell 10.4 percent in that same quarter. Something below the operating line moved against the company and I could not identify it. Seoul Economic Daily’s report does not break it out, and I am not going to name a cause from the outside. So the budget line above uses the fact of the decline and nothing more.
Why I did not add up the segments
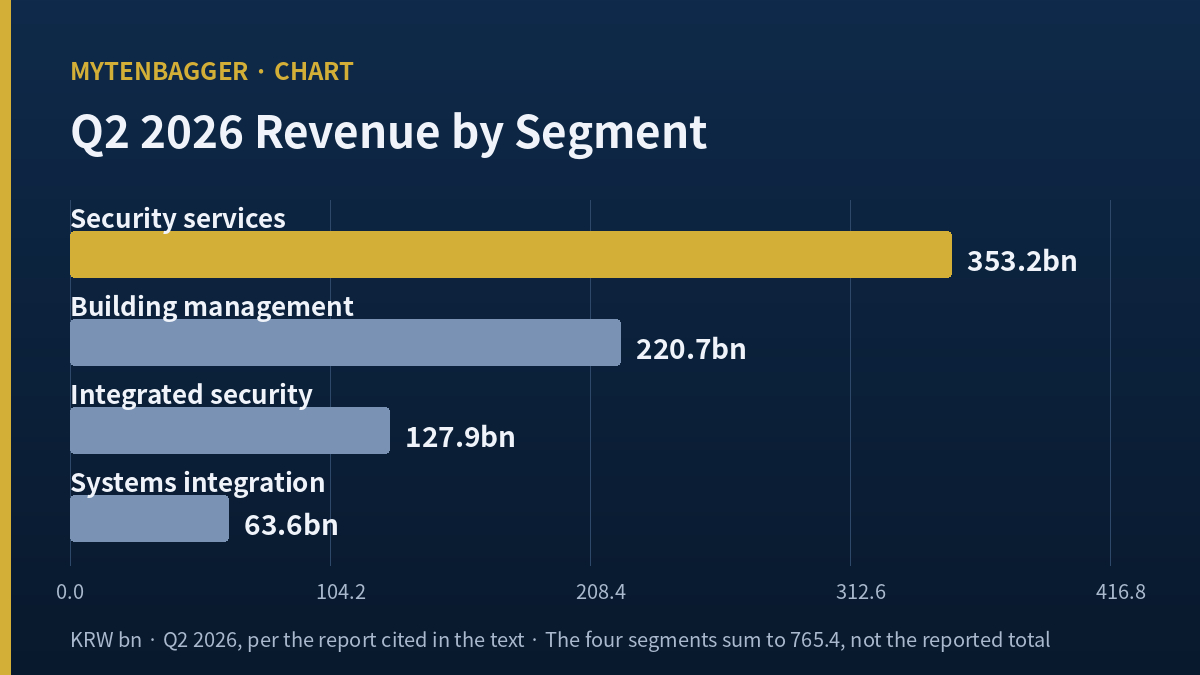
Q2 segment revenue was reported as security services ₩353.2bn (+0.7%), building management ₩220.7bn (+3.3%), integrated security ₩127.9bn (+2.2%) and security systems integration ₩63.6bn (−25.9%). Those four add to ₩765.4bn. The same article puts total revenue at ₩723.1bn. There is ₩42.3bn of overlap, which means the segments are either not mutually exclusive or are reported before intercompany elimination, and I could not establish which. So this piece uses the direction of each line and never the sum. The 25.9 percent contraction in systems integration alongside growth in building management is the readable part, and it explains how revenue can go backwards while margin improves: low-margin installation work left, recurring service work stayed.
S1 Corporation Stock Against SECOM, ADT and Securitas
Back to the column I opened with, now with the rest of the row attached.
| Company | Dividend yield | P/E | P/B | Operating margin |
|---|---|---|---|---|
| S1 Corporation (Seoul) | 4.43% | 15.39 | 1.44 | 8.12% |
| Securitas (Stockholm) | 3.41% | 16.45 | 2.14 | 7.03% |
| ADT (New York) | 2.79% | 10.91 | n/a | n/a |
| SECOM (Tokyo) | 1.86% | 23.80 | 1.77 | 12.74% |
Sort by yield and the Korean name is first. Sort by operating margin and it drops to second behind SECOM at 12.74 percent. The company distributing the most is not the company earning the most. That is not a criticism, it is what a high payout ratio looks like from the outside, and it is the same observation as the budget line at the top of this piece approached from a different direction.
Scale is worth noting alongside the ratios: Securitas carries a headcount of roughly 322,000 globally against the Korean company’s workforce of about 7,000 reported with its first-quarter results, so these are similar businesses run at very different sizes. Peer figures come from stockanalysis.com and the as-of dates differ by row. ADT is the August 3, 2026 US close at $7.88. The Securitas statistics carry a May 22, 2026 stamp, and the SECOM ratio and margin set carries June 11, 2026. The SECOM row is therefore close to two months old and may not include its most recent quarter. I use this table for ordering only, and I do not quote any of it as a precise multiple gap.
Retiring the treasury block would not reduce the dividend bill
The 4.19 million treasury shares I derived earlier have attracted attention. The consensus page at Hankyung’s market service lists a February 2, 2026 note from iM Securities analysts Jang Ho and Lee Sang-heon whose Korean-language title translates roughly as “after the DPS increase, share cancellation is also expected.”
Cancellation would improve per-share optics. Fewer shares issued means multiples get recalculated on a smaller capitalisation and continuing holders own a larger slice. What it would not do is reduce the cash the company sends out, because treasury shares were never collecting a dividend in the first place. The ₩108.19 billion is the same before cancellation and after it, and so is the arithmetic in the table above. I would welcome a cancellation. It just does not answer the question this article is asking.
The Other Side: Two Houses That Saw Strength
Two named Korean sell-side notes sit on the opposite side of my reading, and both are constructive on exactly the thing I am cautious about.
- LS Securities, analyst Kim Se-ryun, January 30, 2026, buy, valuing the shares at ₩104,000. The note’s Korean title runs along the lines of “solid results continue, dividend raised.”
- iM Securities, analysts Jang Ho and Lee Sang-heon, February 2, 2026, buy, valuing the shares at ₩96,000, adding the cancellation expectation described above.
Against the August 4 close those two sit 43.8 and 32.8 percent higher respectively (both my calculation), and the consensus average shown on the Hankyung page is ₩88,000, carrying a May 26, 2026 stamp. I am not adopting any of those figures as my own view of value. I am recording that the visible professional coverage leans the other way from me.
The relevant point is when they were written. All three predate the Q1 results released on April 30, 2026, and all three predate the second quarter. I could not find a named Korean sell-side estimate published after a quarter in which operating profit fell 62 percent and a quarter in which net income fell 10 percent. That is a coverage gap, and I am not filling it with a number of my own invention.
Why I Untagged S1 Corporation Stock as a Dividend Holding
I do not own the shares and I did not buy any during this session. But the decision I actually made was about classification rather than about buying. This name had been sitting in my dividend candidate list, where a 4.4 percent yield on a KOSPI mid-cap belongs by default. I have taken that label off. The company stays on my screen; it moves from “high-yield holding candidate” to “issuer whose distribution policy I am watching.”
The reason is that 4.43 percent is conditional. It assumes ₩3,200 per share persists, and that persistence now requires the company to keep choosing the dividend over the band it published five months ago. It already made that choice once, for FY2025, at 60.6 percent. First-half net income is 38.2 percent of the full prior year (my calculation), which is not by itself alarming for a business with this seasonality, but it is not a running start toward ₩180.3 billion either.
Two things would resolve this for me. Q3 results will show whether the average-wage retirement charge was genuinely a single event. The FY2026 year-end dividend resolution, which for this issuer has landed in late January in recent years, will show one number that settles the whole question. Hold the dividend and the company has ranked distribution above its stated band. Cut it and the band came first. I used the same approach when I sat down with a Korean insurer’s dividend on a crash day, except that there the benchmark was my own; here the company supplied it.
My reading breaks if second-half net income exceeds ₩112.1 billion (my calculation), which would lift FY2026 above ₩180.3 billion and pull the payout inside the band without touching the dividend. Given the recurring-revenue base and the balance sheet, with the kind of conservative Samsung-affiliate capital structure I looked at in the group’s IT services arm, that is not a fantasy number. It is simply not the base case I would back today.
What this costs a dollar-based holder
There is no US listing I could verify for this issuer, so access runs through a broker able to place orders on the Korea Exchange and settle in won. For a dividend name that matters more than usual, because the yield you actually receive is not the yield in the table. Korean dividends paid to foreign holders are subject to withholding at source before anything reaches your account, and whatever survives that arrives in won and has to be converted, so the realised figure depends on the exchange rate on the payment date rather than the one in this article. A holder in Seoul and a holder in Chicago are not buying the same 4.43 percent.
The Three Cards on the Table
While the budget line holds, the company picks one of three, and each one shows up in a public filing, so I can sit still and watch.
Card one: earn more. Produce ₩112.1 billion in the second half and FY2026 clears ₩180.3 billion. If the first-quarter charge was truly one-off and the second-quarter margin improvement holds, this is reachable.
Card two: adjust the dividend. Hold the 60 percent ceiling with net income near ₩150 billion and the payout becomes roughly ₩90 billion, implying about ₩2,660 per share (my calculation). That reverses three consecutive years of increases, which makes it the most expensive card politically.
Card three: run outside the band. The company did this for FY2025. The dividend holds, and the published range turns out to be guidance the company is willing to overshoot, which is how I will read the next value-up filing.
I think card three is the most likely. Cutting a dividend with 55.65 percent foreign ownership is a heavy decision, and the company has been leaning publicly on its shareholder-return record. But if that is the path, then the 4.43 percent yield at the top of my opening column is being carried by management’s willingness rather than by the earnings underneath it. Those two things have different life expectancies. SECOM at 1.86 percent is paying out of a 12.74 percent operating margin; S1 at 4.43 percent is paying out of 8.12 percent and a stated ceiling it has already crossed. That is the column I started with, read the other way round, and it is why I moved the label.
Prices and multiples reflect the August 4, 2026 Korean close as checked at the time of writing. USD conversions are approximate, at roughly ₩1,430 per dollar on that date, and the Korean won is the reference currency throughout. Dividend totals and the payout ratio come from the March 19, 2026 value-up filing; the required net income levels, the treasury share count and several percentage changes are derived from those disclosed figures rather than reported directly.
Related reading
- Korea District Heating Stock Yields 8% on a 21% Payout Ratio
- Young Poong Stock: Most of the Profit Is Not From Operations